
Security and attacks continues to be a very active environment, and the visibility that Cloudflare Radar provides on this dynamic landscape has evolved and expanded over time. To that end, during 2023’s Security Week, we launched our URL Scanner, which enables users to safely scan any URL to determine if it is safe to view or interact with. During 2024’s Security Week, we launched an Email Security page, which provides a unique perspective on the threats posed by malicious emails, spam volume, the adoption of email authentication methods like SPF, DMARC, and DKIM, and the use of IPv4/IPv6 and TLS by email servers. For Security Week 2025, we are adding several new DDoS-focused graphs, new insights into leaked credential trends, and a new Bots page to Cloudflare Radar. We are also taking this opportunity to refactor Radar’s Security & Attacks page, breaking it out into Application Layer and Network Layer sections.
Below, we review all of these changes and additions to Radar.
Layered security
Since Cloudflare Radar launched in 2020, it has included both network layer (Layers 3 & 4) and application layer (Layer 7) attack traffic insights on a single Security & Attacks page. Over the last four-plus years, we have evolved some of the existing data sets on the page, as well as adding new ones. As the page has grown and improved over time, it risked becoming unwieldy to navigate, making it hard to find the graphs and data of interest. To help address that, the Security section on Radar now features separate Application Layer and Network Layer pages. The Application Layer page is the default, and includes insights from analysis of HTTP-based malicious and attack traffic. The Network Layer page includes insights from analysis of network and transport layer attacks, as well as observed TCP resets and timeouts. Future security and attack-related data sets will be added to the relevant page. Email Security remains on its own dedicated page.

A geographic and network view of application layer DDoS attacks
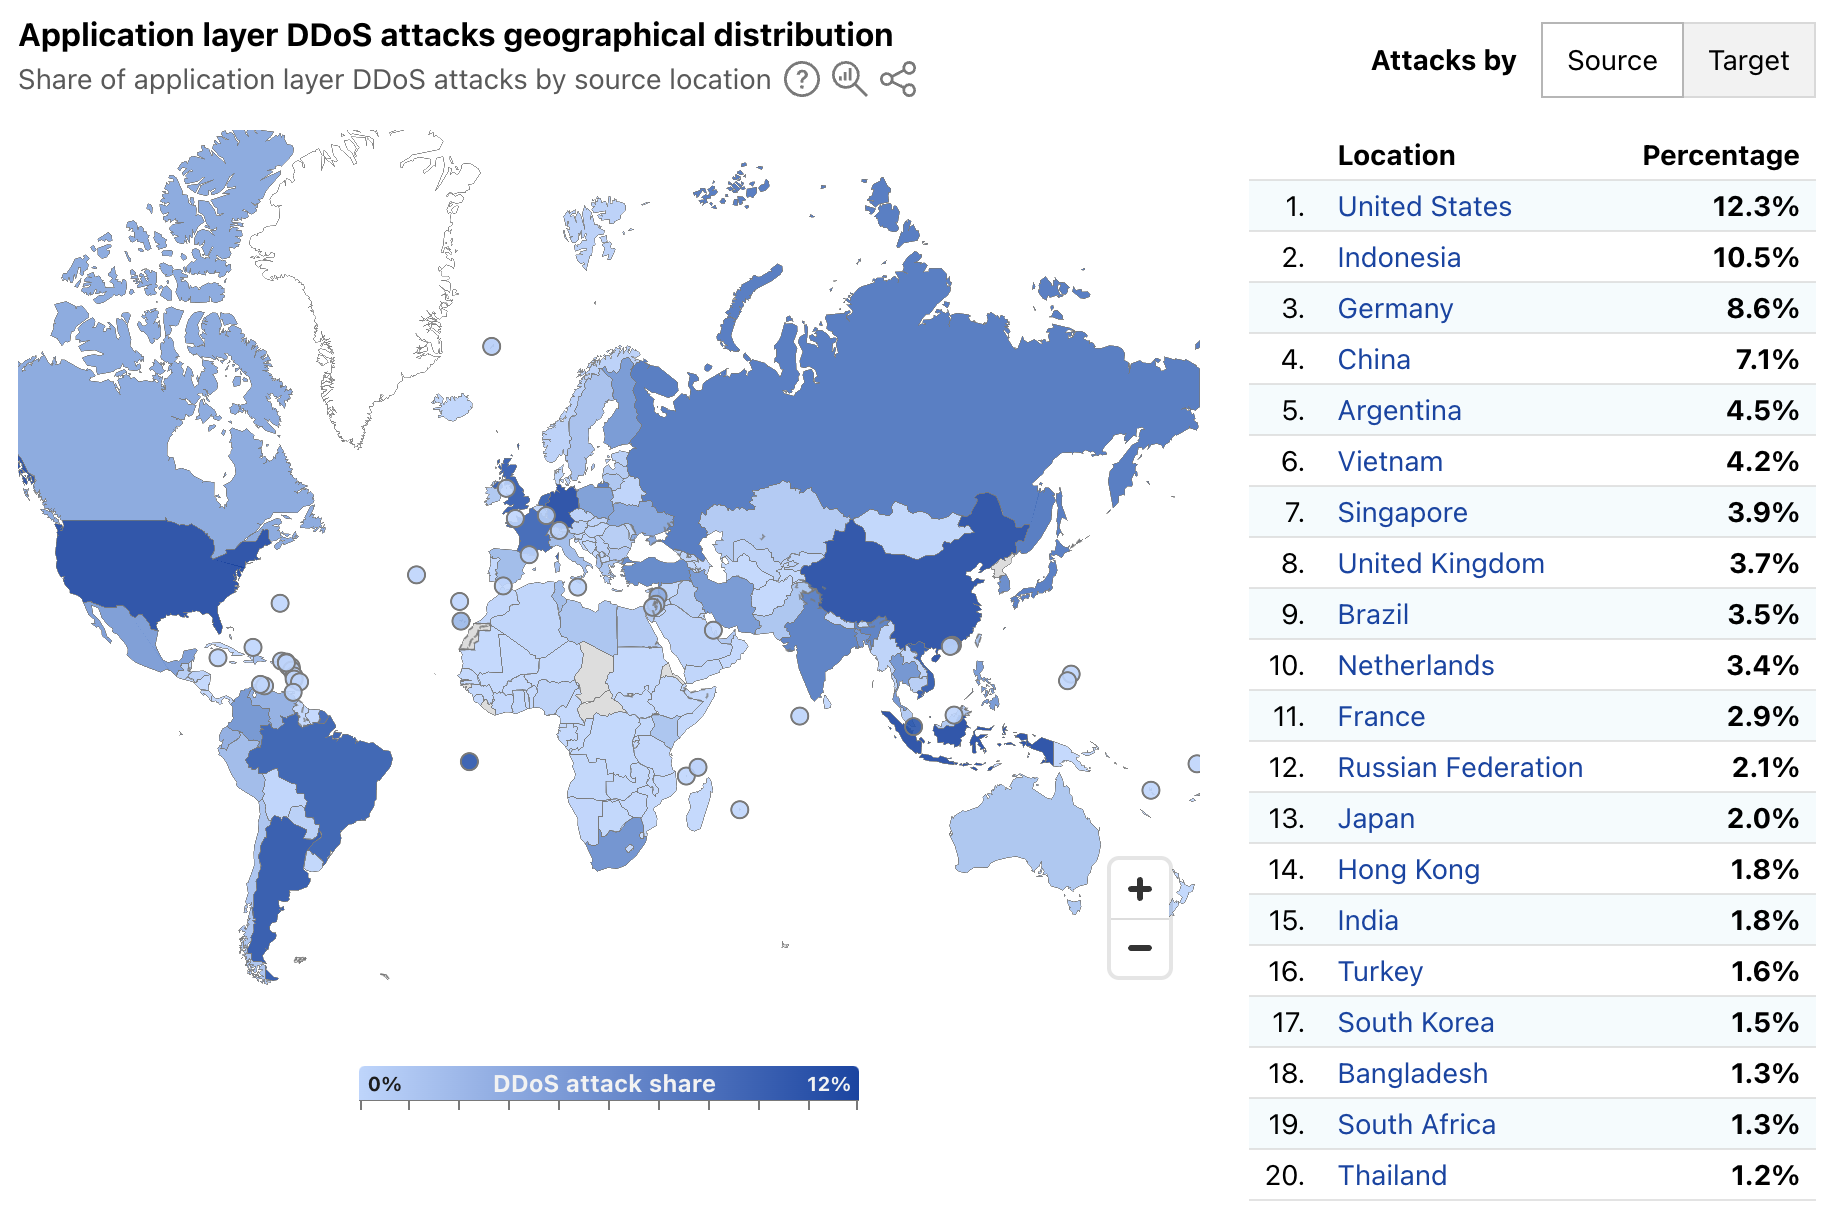
Radar’s quarterly DDoS threat reports have historically provided insights, aggregated on a quarterly basis, into the top source and target locations of application layer DDoS attacks. A new map and table on Radar’s Application Layer Security page now provide more timely insights, with a global choropleth map showing a geographical distribution of source and target locations, and an accompanying list of the top 20 locations by share of all DDoS requests. Source location attribution continues to rely on the geolocation of the IP address originating the blocked request, while target location remains the billing location of the account that owns the site being attacked.
Over the first week of March 2025, the United States, Indonesia, and Germany were the top sources of application layer DDoS attacks, together accounting for over 30% of such attacks as shown below. The concentration across the top targeted locations was quite different, with customers from Canada, the United States, and Singapore attracting 56% of application layer DDoS attacks.
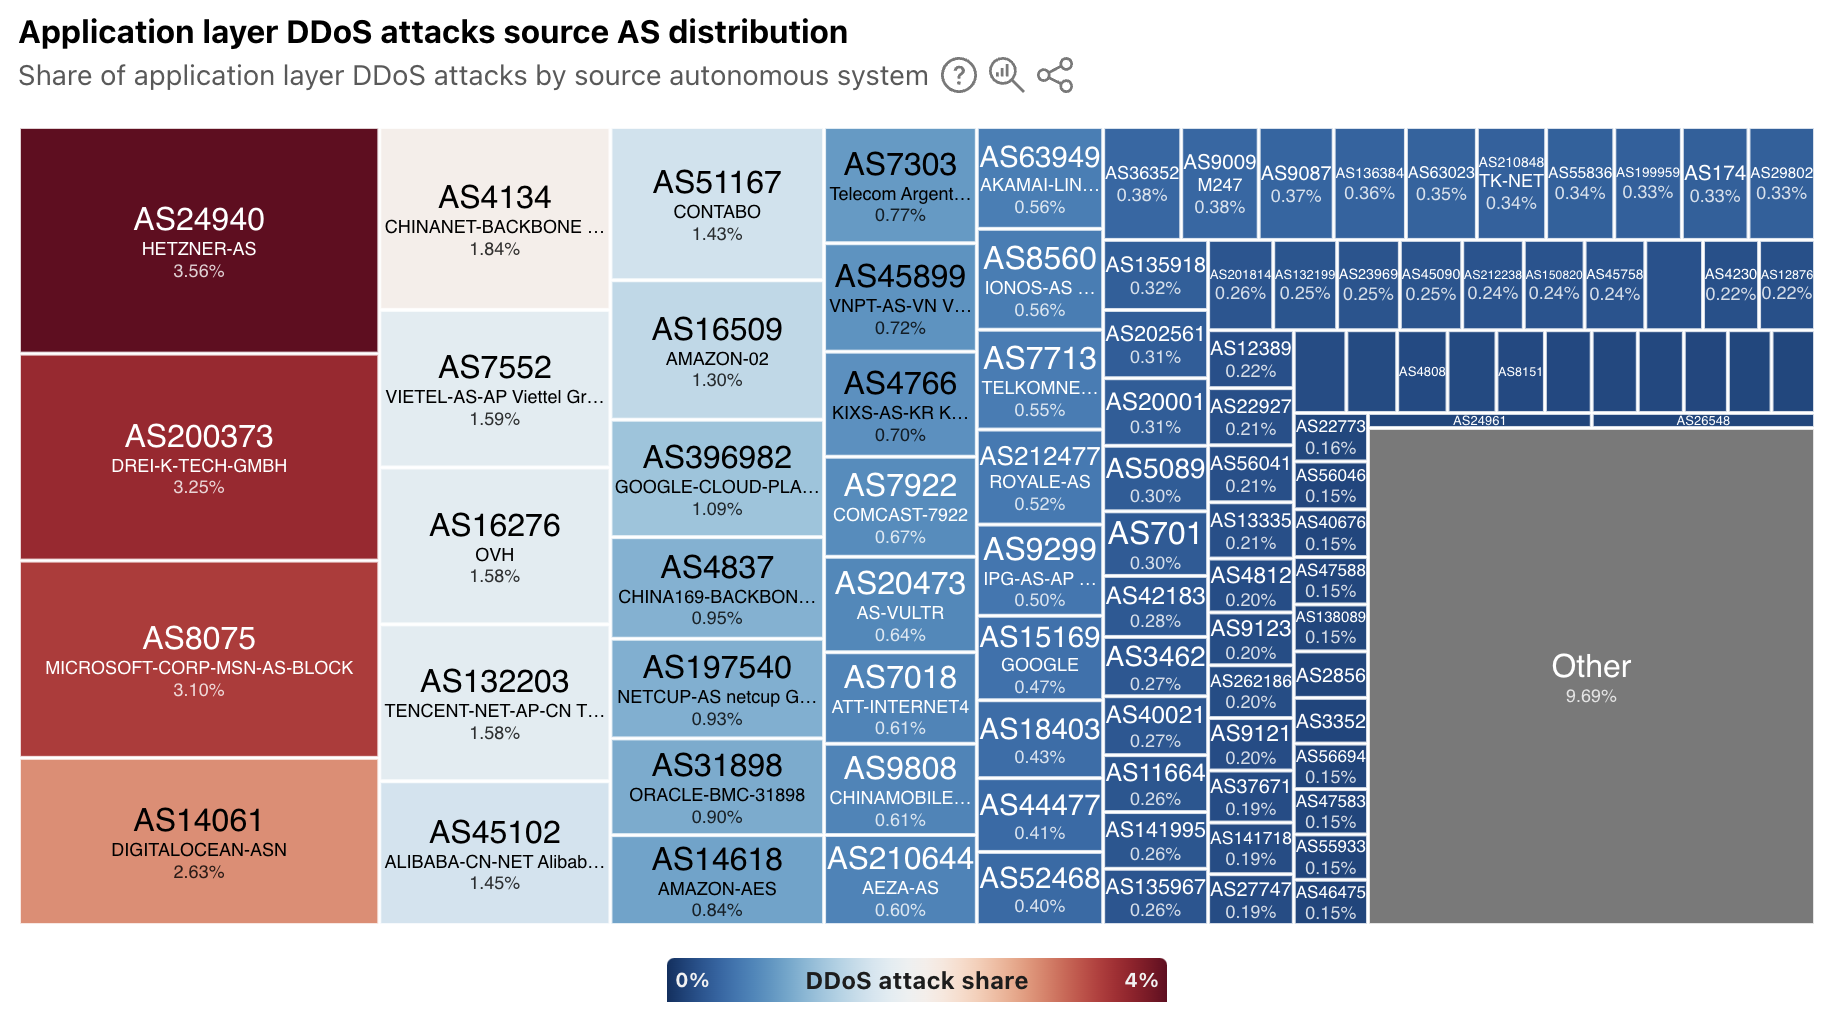
In addition to extended visibility into the geographic source of application layer DDoS attacks, we have also added autonomous system (AS)-level visibility. A new treemap view shows the distribution of these attacks by source AS. At a global level, the largest sources include cloud/hosting providers in Germany, the United States, China, and Vietnam.
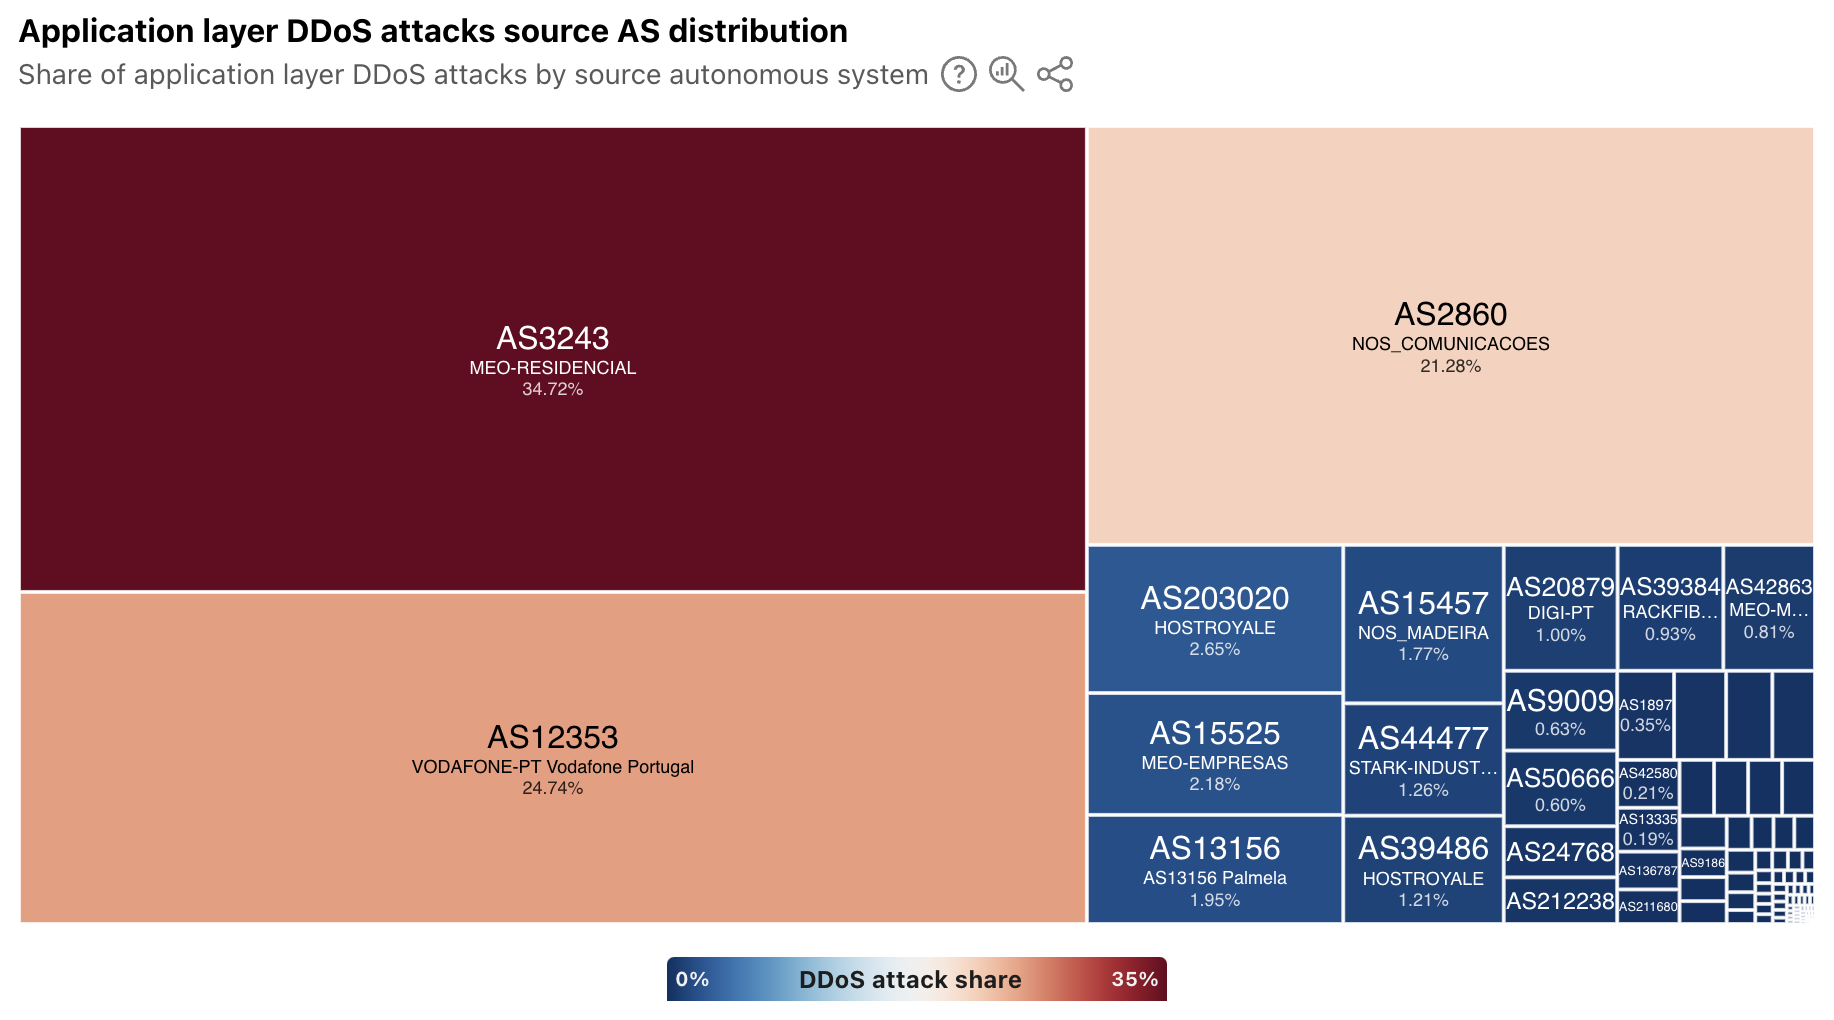
For a selected country/region, the treemap displays a source AS distribution for attacks observed to be originating from that location. In some, the sources of attack traffic are heavily concentrated in consumer/business network providers, such as in Portugal, shown below. However, in other countries/regions that have a large cloud provider presence, such as Ireland, Singapore, and the United States, ASNs associated with these types of providers are the dominant sources. To that end, Singapore was listed as being among the top sources of application layer DDoS attacks in each of the quarterly DDoS threat reports in 2024.
Have you been pwned?
Every week, it seems like there’s another headline about a data breach, talking about thousands or millions of usernames and passwords being stolen. Or maybe you get an email from an identity monitoring service that your username and password were found on the “dark web”. (Of course, you’re getting those alerts thanks to a complementary subscription to the service offered as penance from another data breach…)
This credential theft is especially problematic because people often reuse passwords, despite best practices advising the use of strong, unique passwords for each site or application. To help mitigate this risk, starting in 2024, Cloudflare began enabling customers to scan authentication requests for their websites and applications using a privacy-preserving compromised credential checker implementation to detect known-leaked usernames and passwords. Today, we're using aggregated data to display trends in how often these leaked and stolen credentials are observed across Cloudflare's network. (Here, we are defining “leaked credentials” as usernames or passwords being found in a public dataset, or the username and password detected as being similar.)
Leaked credentials detection scans incoming HTTP requests for known authentication patterns from common web apps and any custom detection locations that were configured. The service uses a privacy-preserving compromised credential checking protocol to compare a hash of the detected passwords to hashes of compromised passwords found in databases of leaked credentials. A new Radar graph on the worldwide Application Layer Security page provides visibility into aggregate trends around the detection of leaked credentials in authentication requests. Filterable by authentication requests from human users, bots, or all (human + bot), the graph shows the distribution requests classified as “clean” (no leaked credentials detected) and “compromised” (leaked credentials, as defined above, were used). At a worldwide level, we found that for the first week of March 2025, leaked credentials were used in 64% of all, over 65% of bot, and over 44% of human authorization requests.
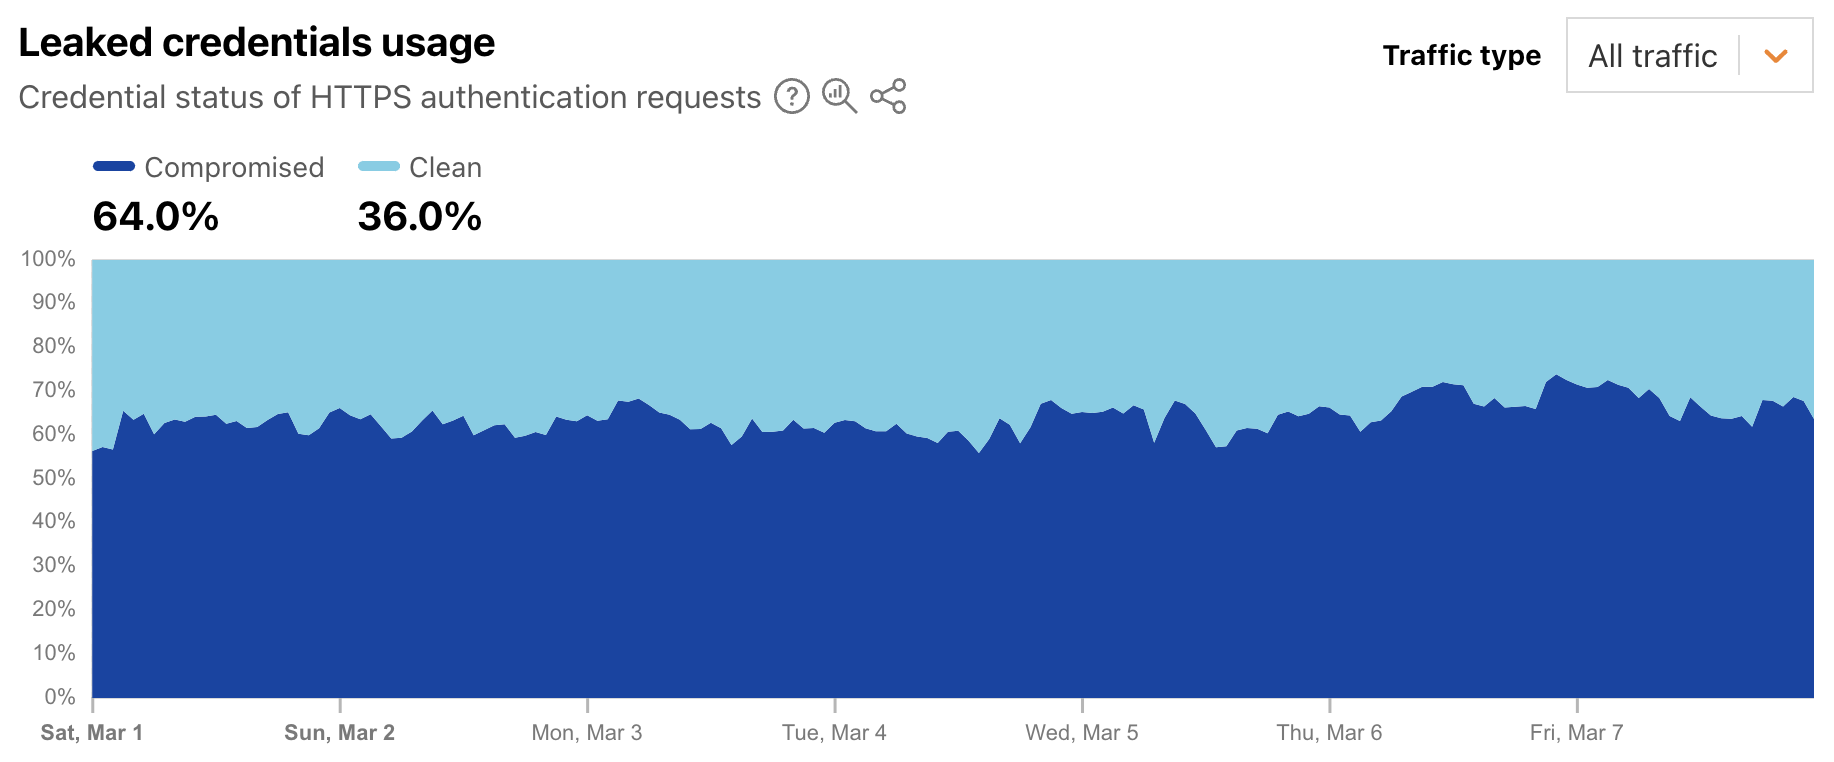
This suggests that from a human perspective, password reuse is still a problem, as is users not taking immediate actions to change passwords when notified of a breach. And from a bot perspective, this suggests that attackers know that there is a good chance that leaked credentials for one website or application will enable them to access that same user’s account elsewhere.
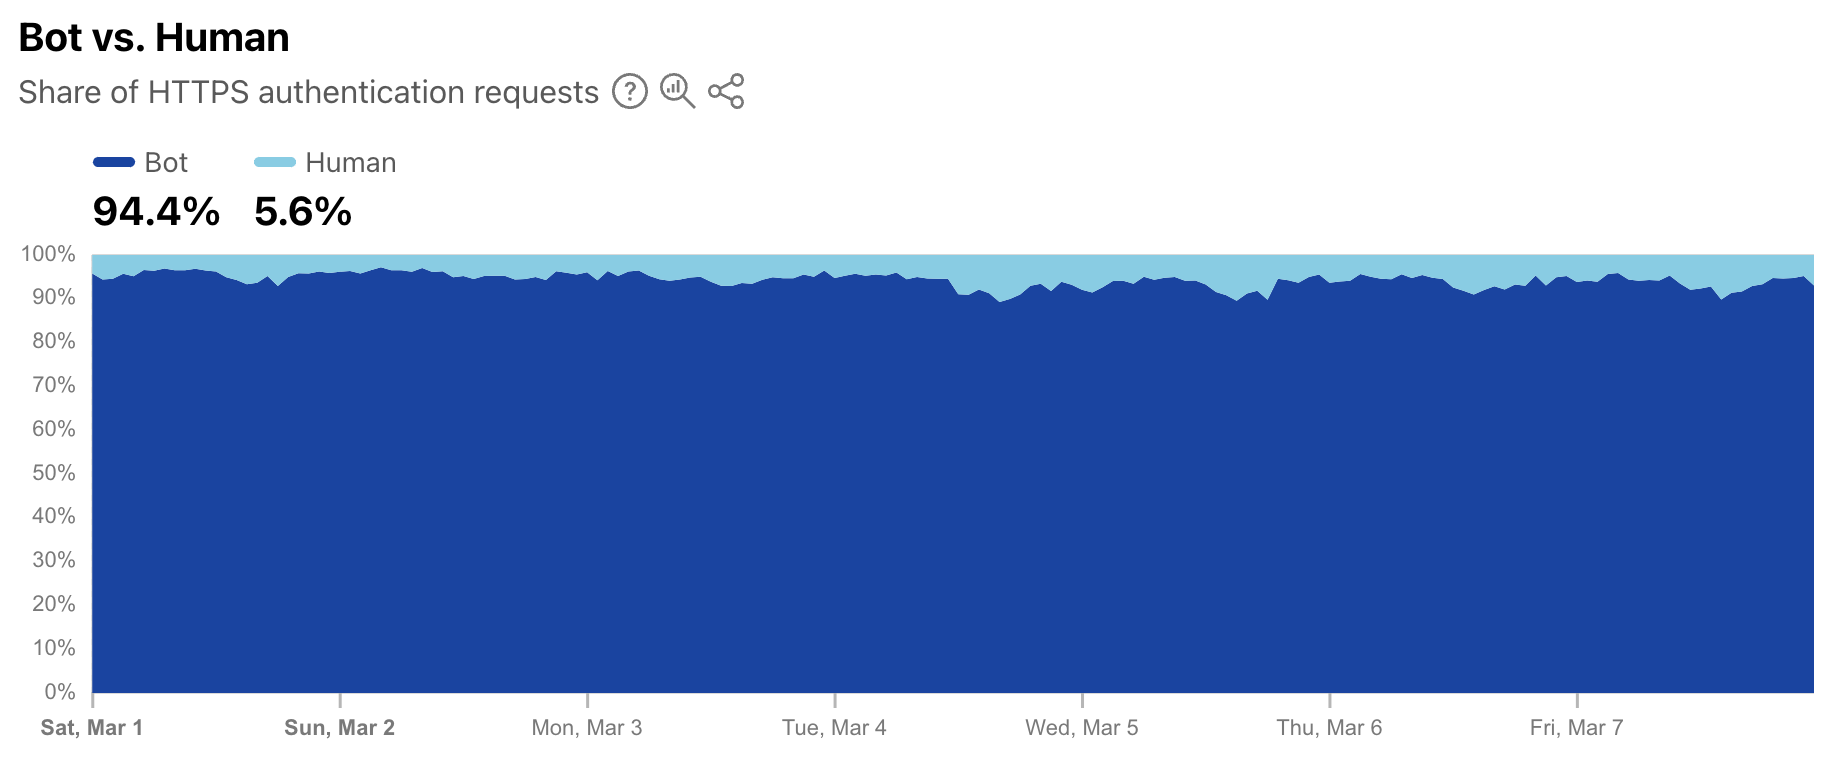
As a complement to the leaked credentials data, Radar is also now providing a worldwide view into the share of authentication requests originating from bots. Note that not all of these requests are necessarily malicious — while some may be associated with credential stuffing-style attacks, others may be from automated scripts or other benign applications accessing an authentication endpoint. (Having said that, automated malicious attack request volume far exceeds legitimate automated login attempts.) During the first week of March 2025, we found that over 94% of authentication requests came from bots (were automated), with the balance coming from humans. Over that same period, bot traffic only accounted for 30% of overall requests. So although bots don’t represent a majority of request traffic, authentication requests appear to comprise a significant portion of their activity.
Bots get a dedicated page
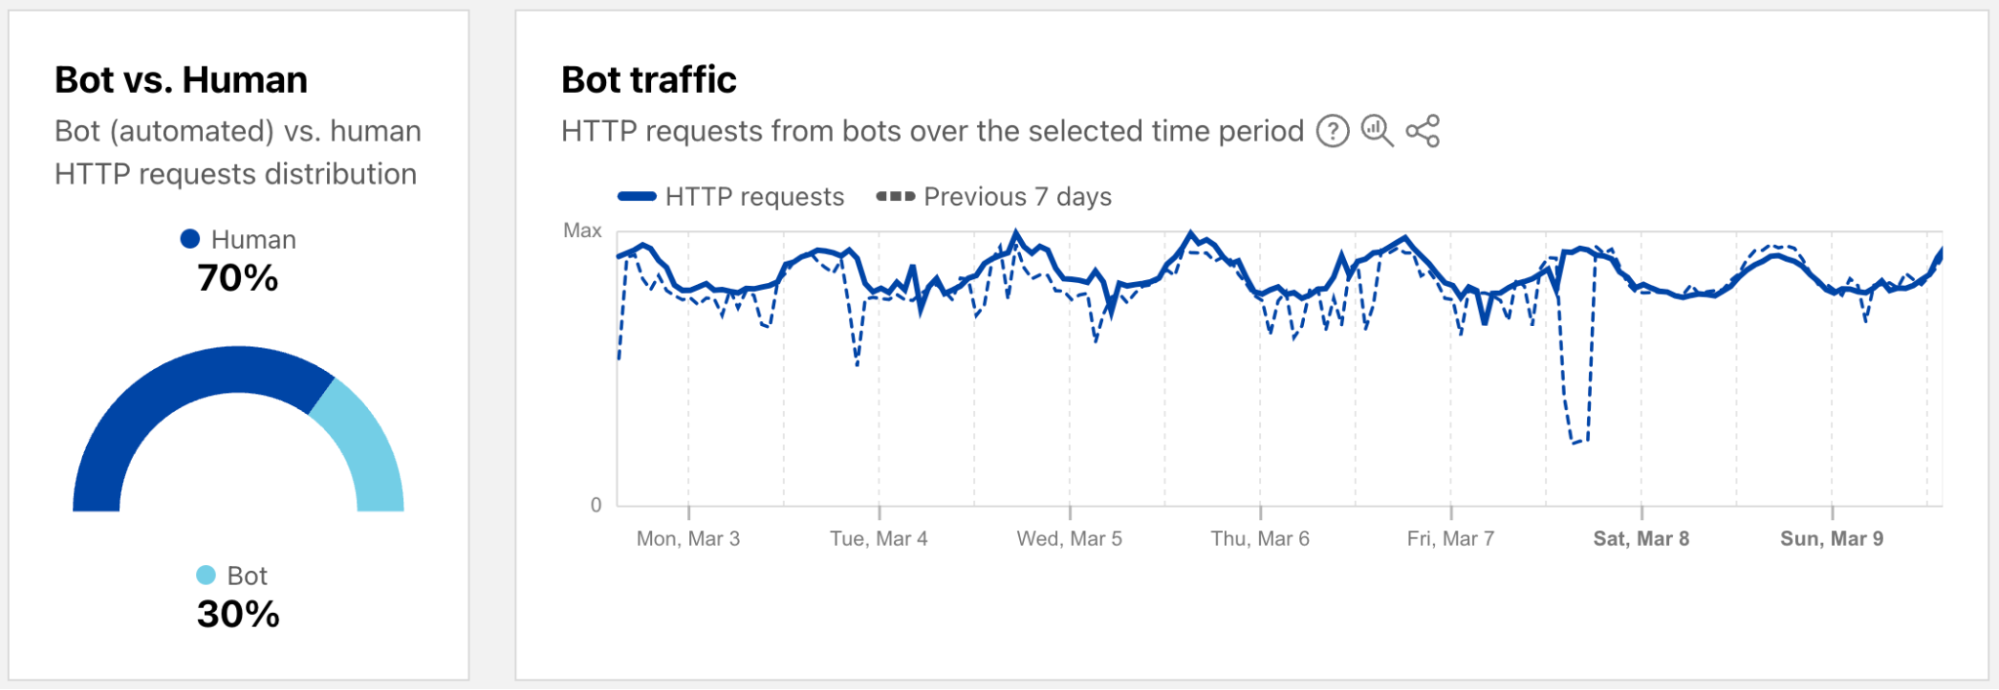
As a reminder, bot traffic describes any non-human Internet traffic, and monitoring bot levels can help spot potential malicious activities. Of course, bots can be helpful too, and Cloudflare maintains a list of verified bots to help keep the Internet healthy. Given the importance of monitoring bot activity, we have launched a new dedicated Bots page in the Traffic section of Cloudflare Radar to support these efforts. For both worldwide and location views over the selected time period, the page shows the distribution of bot (automated) vs. human HTTP requests, as well as a graph showing bot traffic trends. (Our bot score, combining machine learning, heuristics, and other techniques, is used to identify automated requests likely to be coming from bots.)
Both the 2023 and 2024 Cloudflare Radar Year in Review microsites included a “Bot Traffic Sources” section, showing the locations and networks that Cloudflare determined that the largest shares of automated/likely automated traffic was originating from. However, these traffic shares were published just once a year, aggregating traffic from January through the end of November.
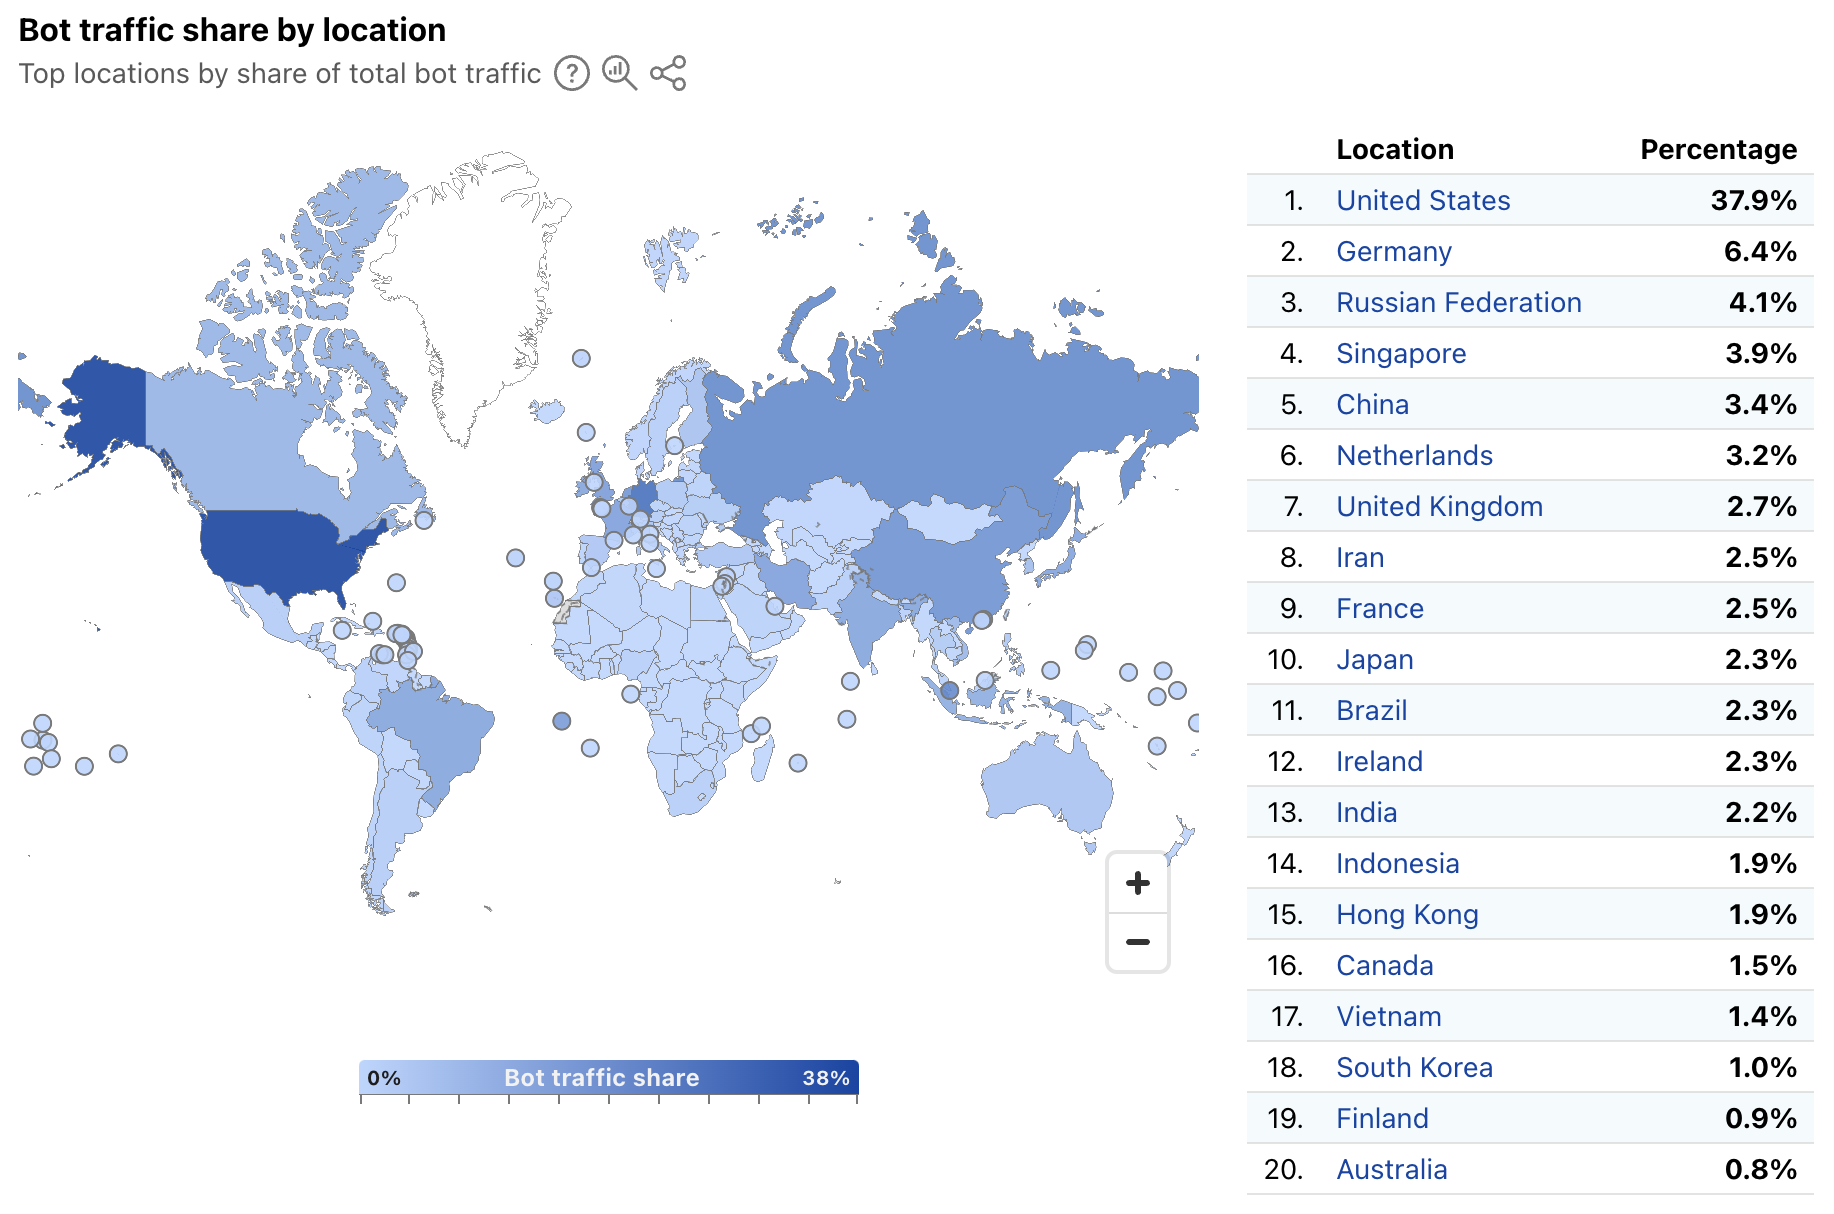
In order to provide a more timely perspective, these insights are now available on the new Radar Bots page. Similar to the new DDoS attacks content discussed above, the worldwide view includes a choropleth map and table illustrating the locations originating the largest shares of all bot traffic. (Note that a similar Traffic Characteristics map and table on the Traffic Overview page ranks locations by the bot traffic share of the location’s total traffic.) Similar to Year in Review data linked above, the United States continues to originate the largest share of bot traffic.
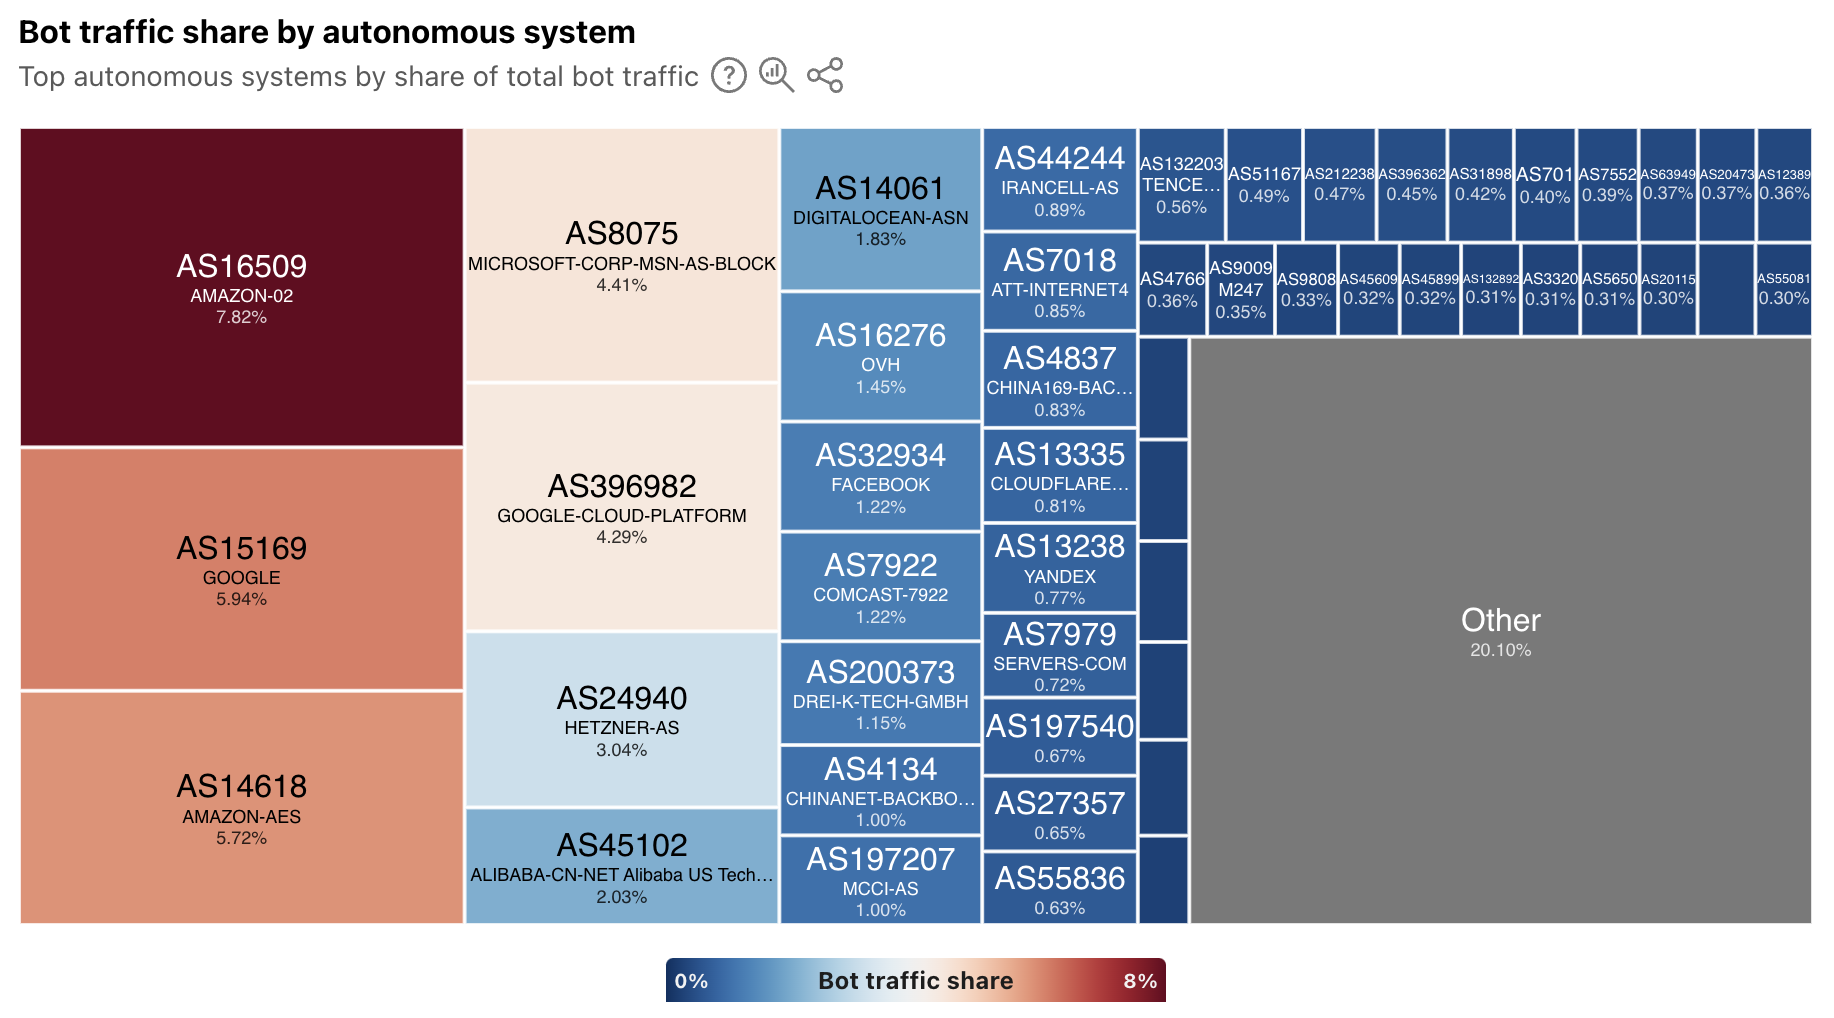
In addition, the worldwide view also breaks out bot traffic share by AS, mirroring the treemap shown in the Year in Review. As we have noted previously, cloud platform providers account for a significant amount of bot traffic.
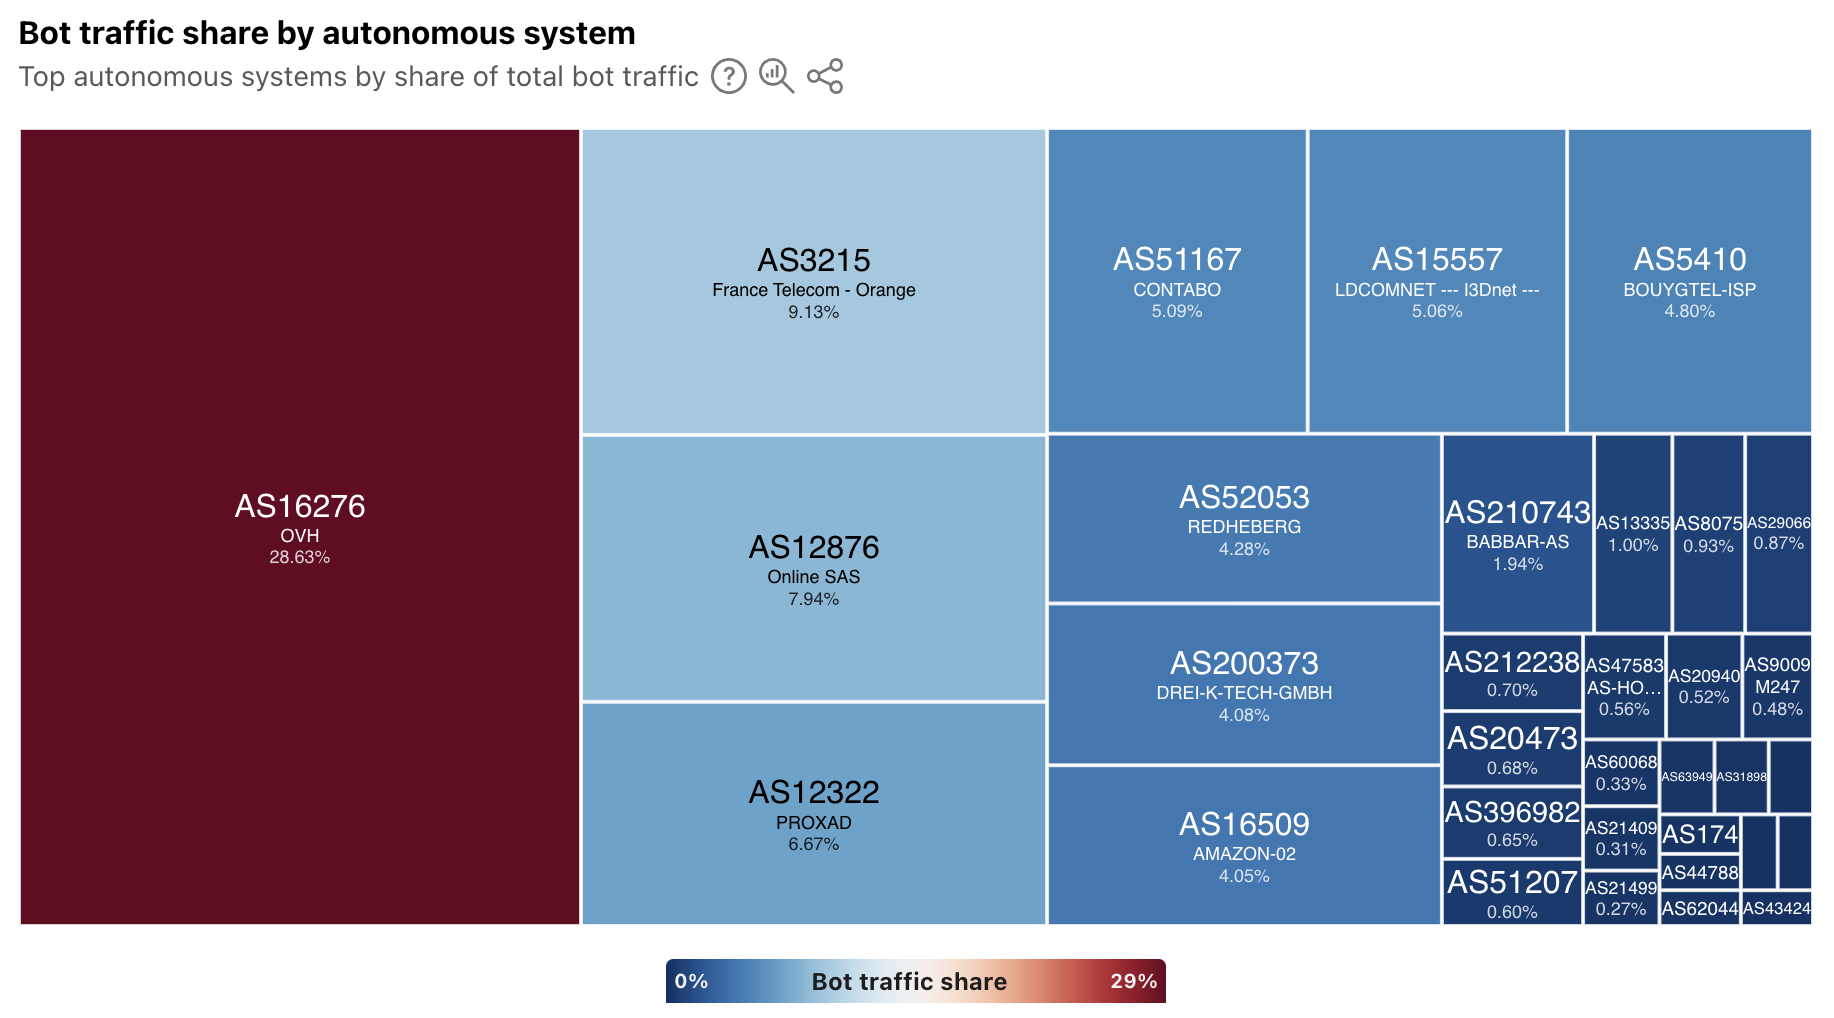
At a location level, depending on the country/region selected, the top sources of bot traffic may be cloud/hosting providers, consumer/business network providers, or a mix. For instance, France’s distribution is shown below, and four ASNs account for just over half of the country’s bot traffic. Of these ASNs, two (AS16276 and AS12876) belong to cloud/hosting providers, and two (AS3215 and AS12322) belong to network providers.
In addition, the Verified Bots list has been moved to the new Bots page on Radar. The data shown and functionality remains unchanged, and links to the old location will automatically be redirected to the new one.
Summary
The Cloudflare dashboard provides customers with specific views of security trends, application and network layer attacks, and bot activity across their sites and applications. While these views are useful at an individual customer level, aggregated views at a worldwide, location, and network level provide a macro-level perspective on trends and activity. These aggregated views available on Cloudflare Radar not only help customers understand how their observations compare to the larger whole, but they also help the industry understand emerging threats that may require action.
The underlying data for the graphs and data discussed above is available via the Radar API (Application Layer, Network Layer, Bots, Leaked Credentials). The data can also be interactively explored in more detail across locations, networks, and time periods using Radar’s Data Explorer and AI Assistant. And as always, Radar and Data Explorer charts and graphs are downloadable for sharing, and embeddable for use in your own blog posts, websites, or dashboards.
If you share our security, attacks, or bots graphs on social media, be sure to tag us: @CloudflareRadar and @1111Resolver (X), noc.social/@cloudflareradar (Mastodon), and radar.cloudflare.com (Bluesky). If you have questions or comments, you can reach out to us on social media, or contact us via email.