
Have you noticed something new in your Cloudflare analytics dashboard this morning? You can now see detailed DNS analytics for your domains on Cloudflare.
If you want to skip to the punch and start exploring, go check it out here. Otherwise, hop on the DNS magic school bus - and let us show you all the neat stats in your now-available DNS analytics.
DNS analytics dashboard: What does it know? Does it know things? Let’s find out.
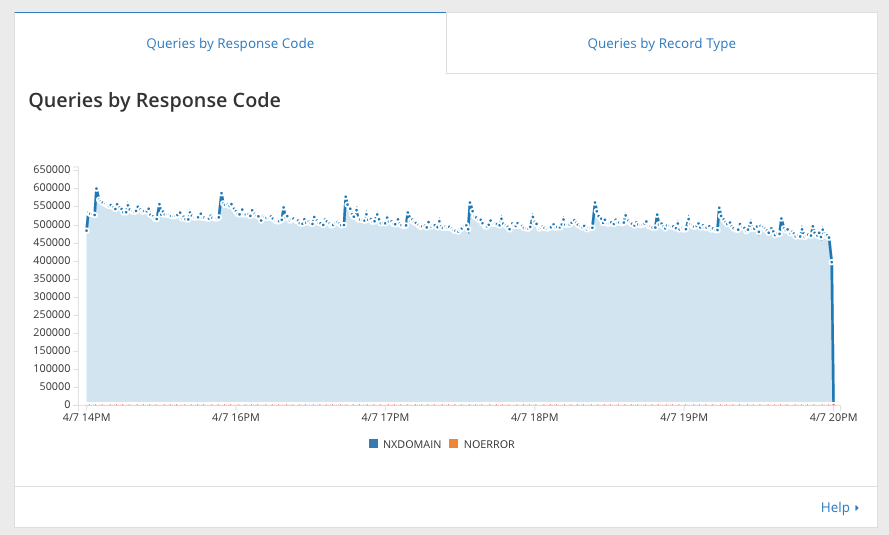
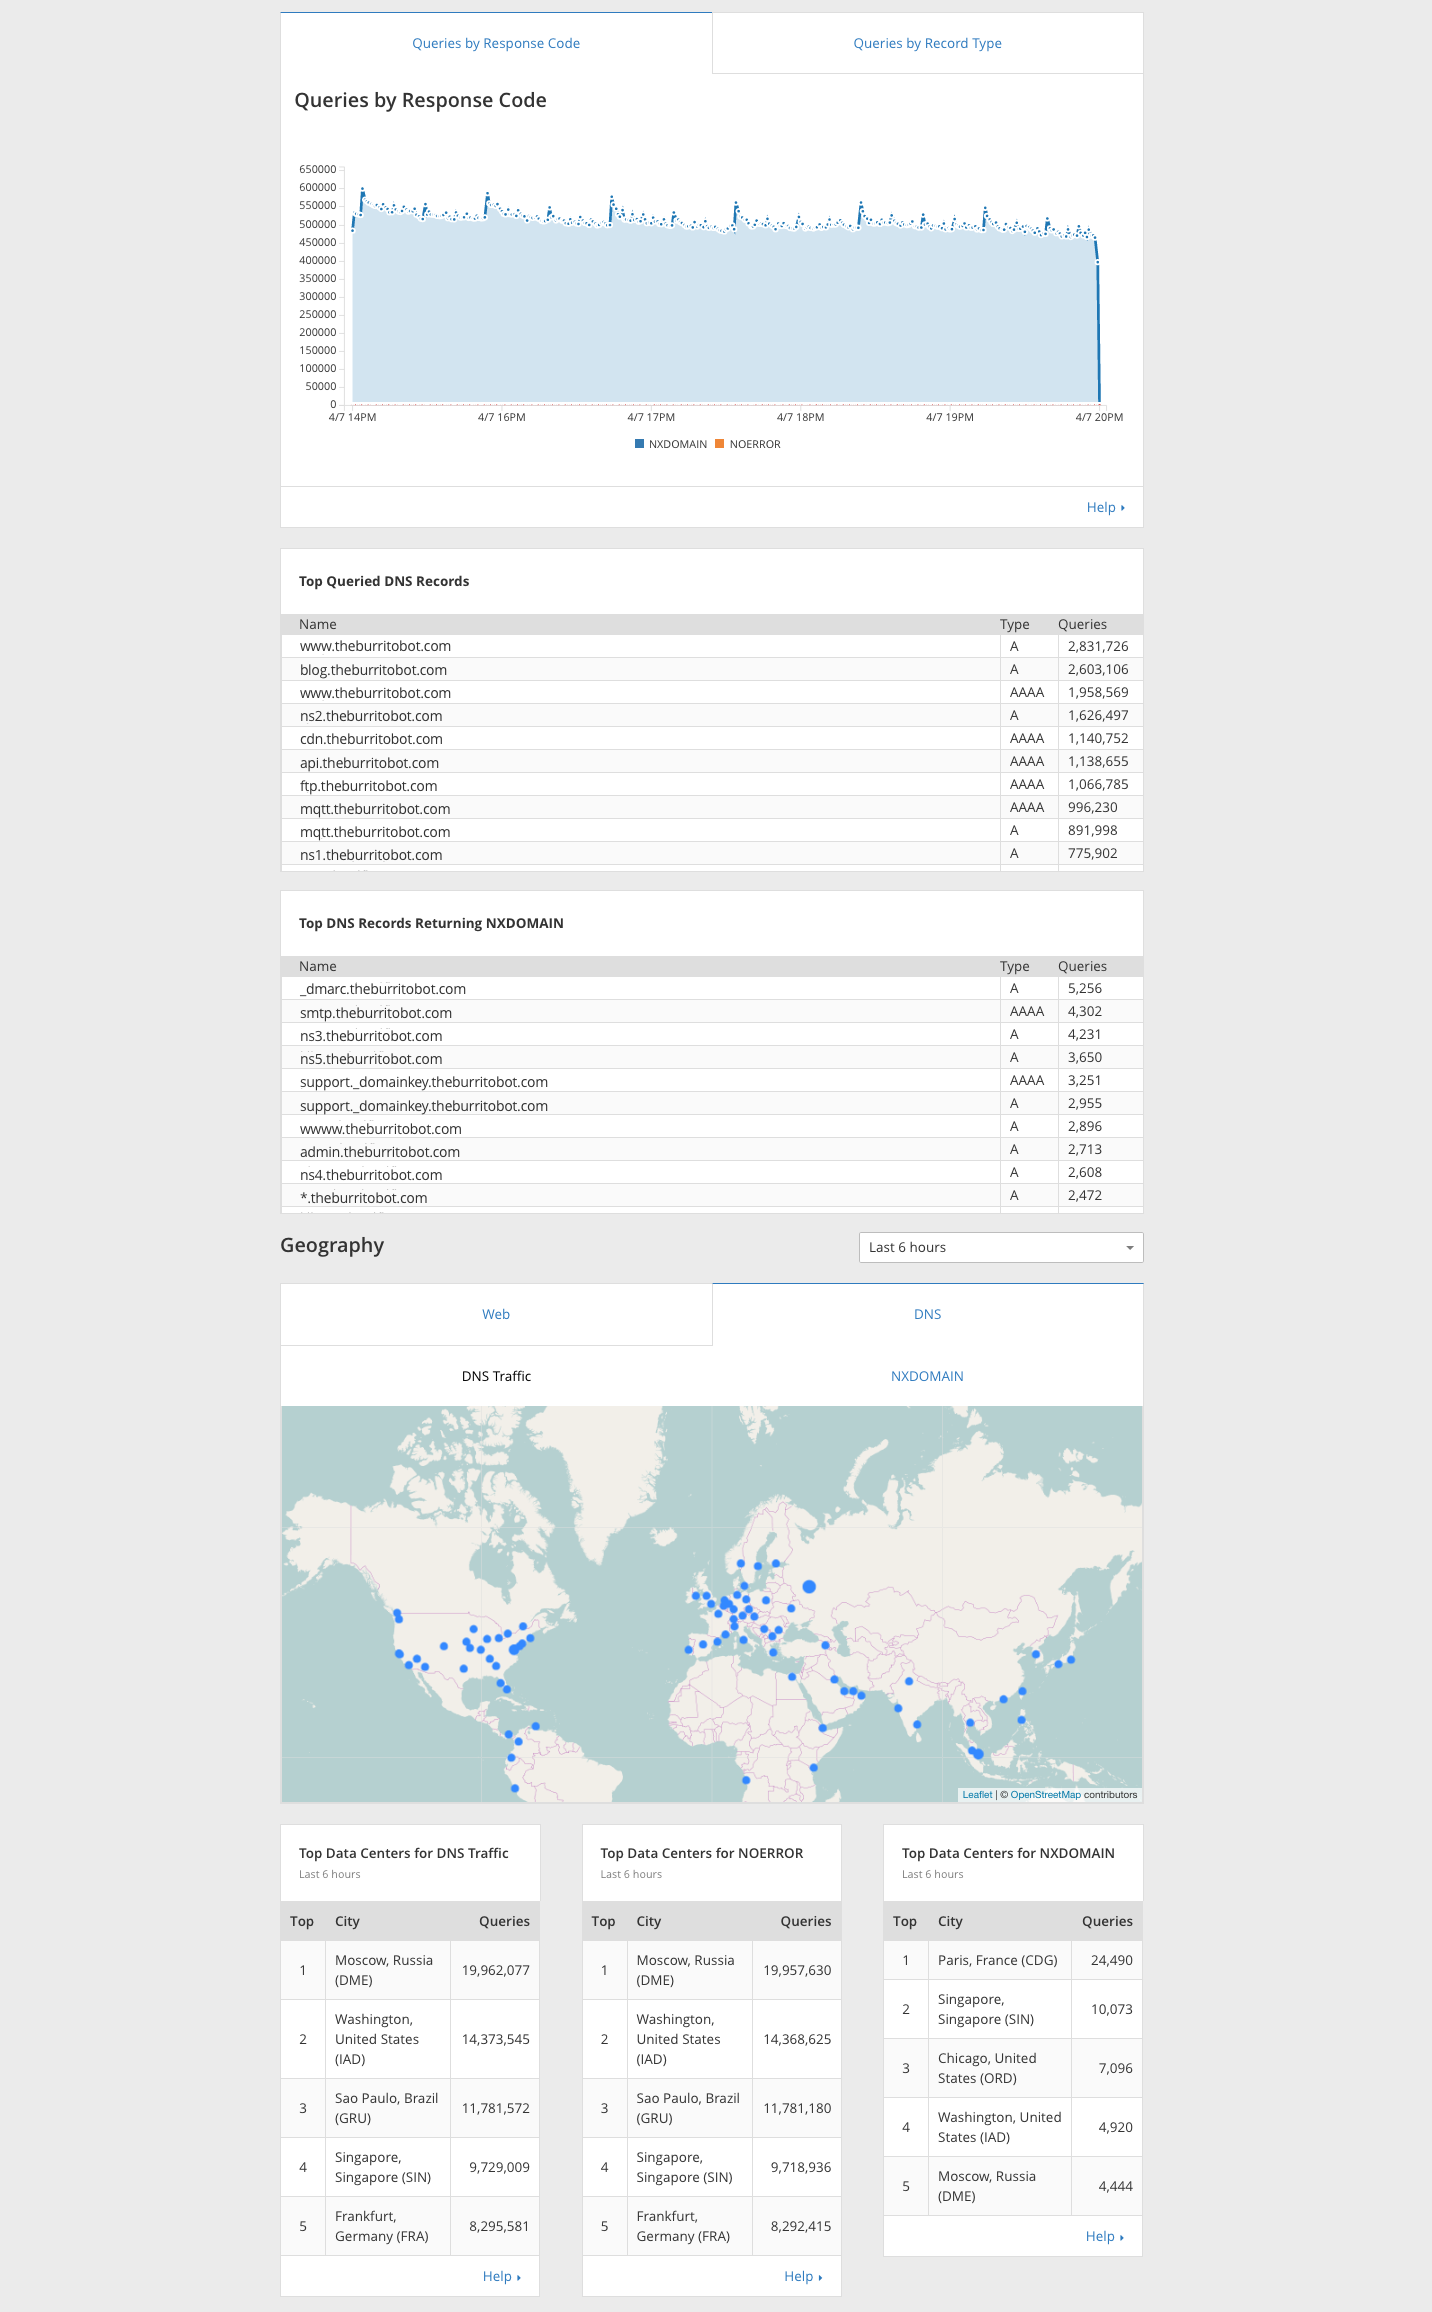
At the top of the DNS analytics dashboard you can see your DNS traffic health. This “Queries by Response Codes” graph breaks down queries by what response code Cloudflare DNS answered to the visitor. Like HTTP response codes, DNS response codes give an indication of what is happening behind the scenes. Mostly you will just see NOERROR, the HTTP 200 of DNS response codes, and NXDOMAIN, the HTTP 404 of DNS response codes. NXDOMAIN is particularly interesting - what are people querying for that doesn’t exist?
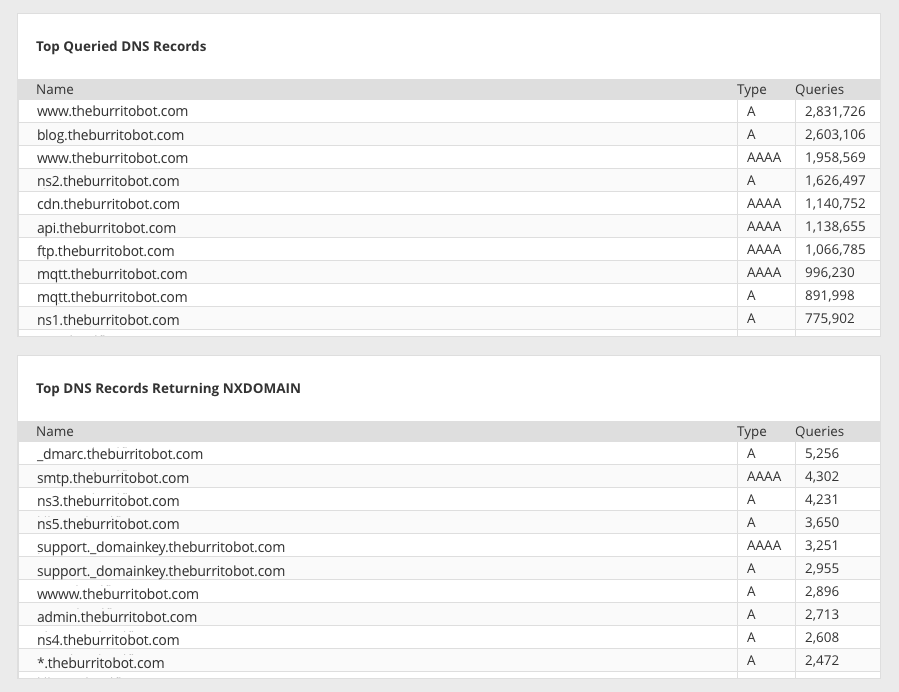
If you are an enterprise customer and you want to know what all the NXDOMAIN queries are, just scroll down a little bit where we show you the top queries for your domain and top queries for your domain for DNS records that don’t exist (aka top NXDOMAIN queries).
If you are curious then where all of these NXDOMAIN queries are coming from, all Pro, Business and Enterprise plan customers can scroll down a little bit further to the geography section where we show you the breakdown of where your queries come from and also where your queries returning NXDOMAIN come from.
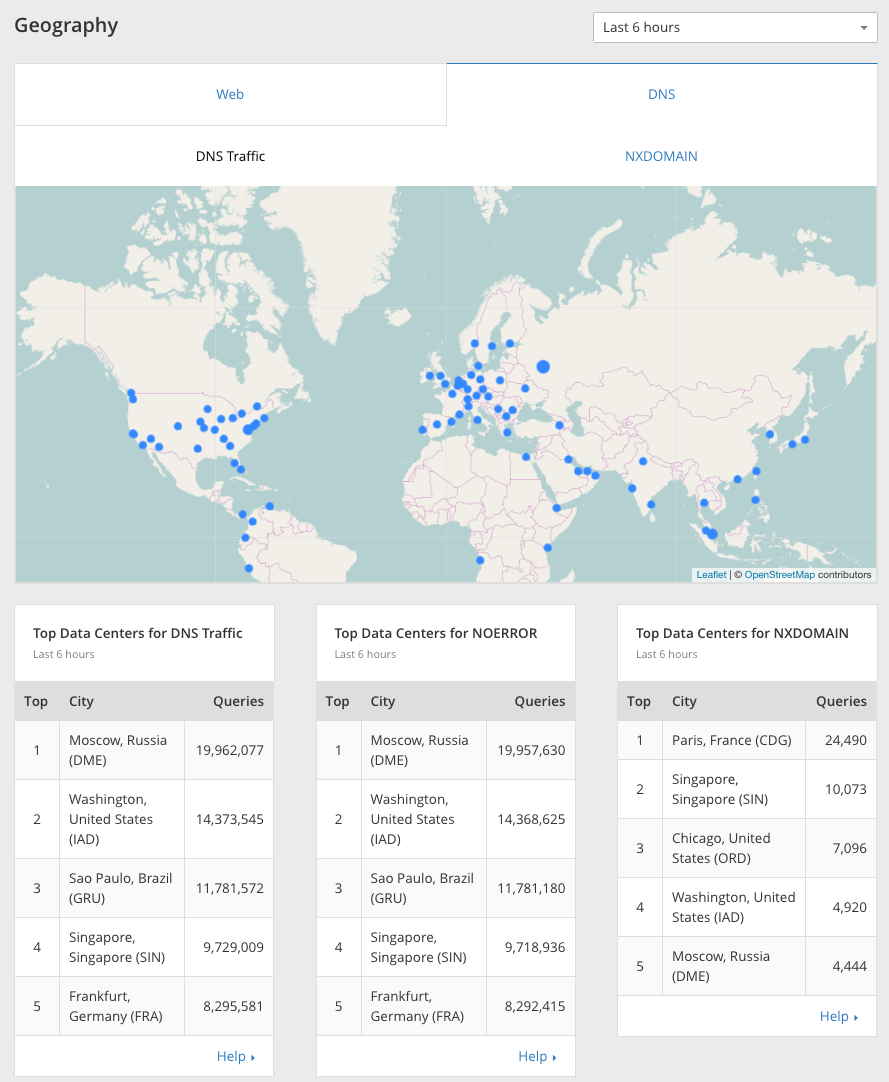
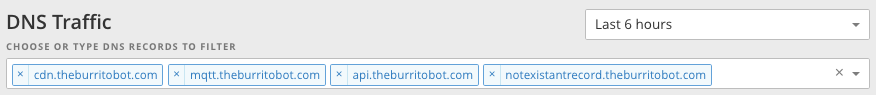
If you are an Enterprise customer and want to dive in deeper just for one or a few names, you can filter down the entire dashboard by hostname. You can even filter the dashboard by names that don’t exist in your DNS records so you can explore traffic for misconfigured records resolvers are looking for that don’t exist.
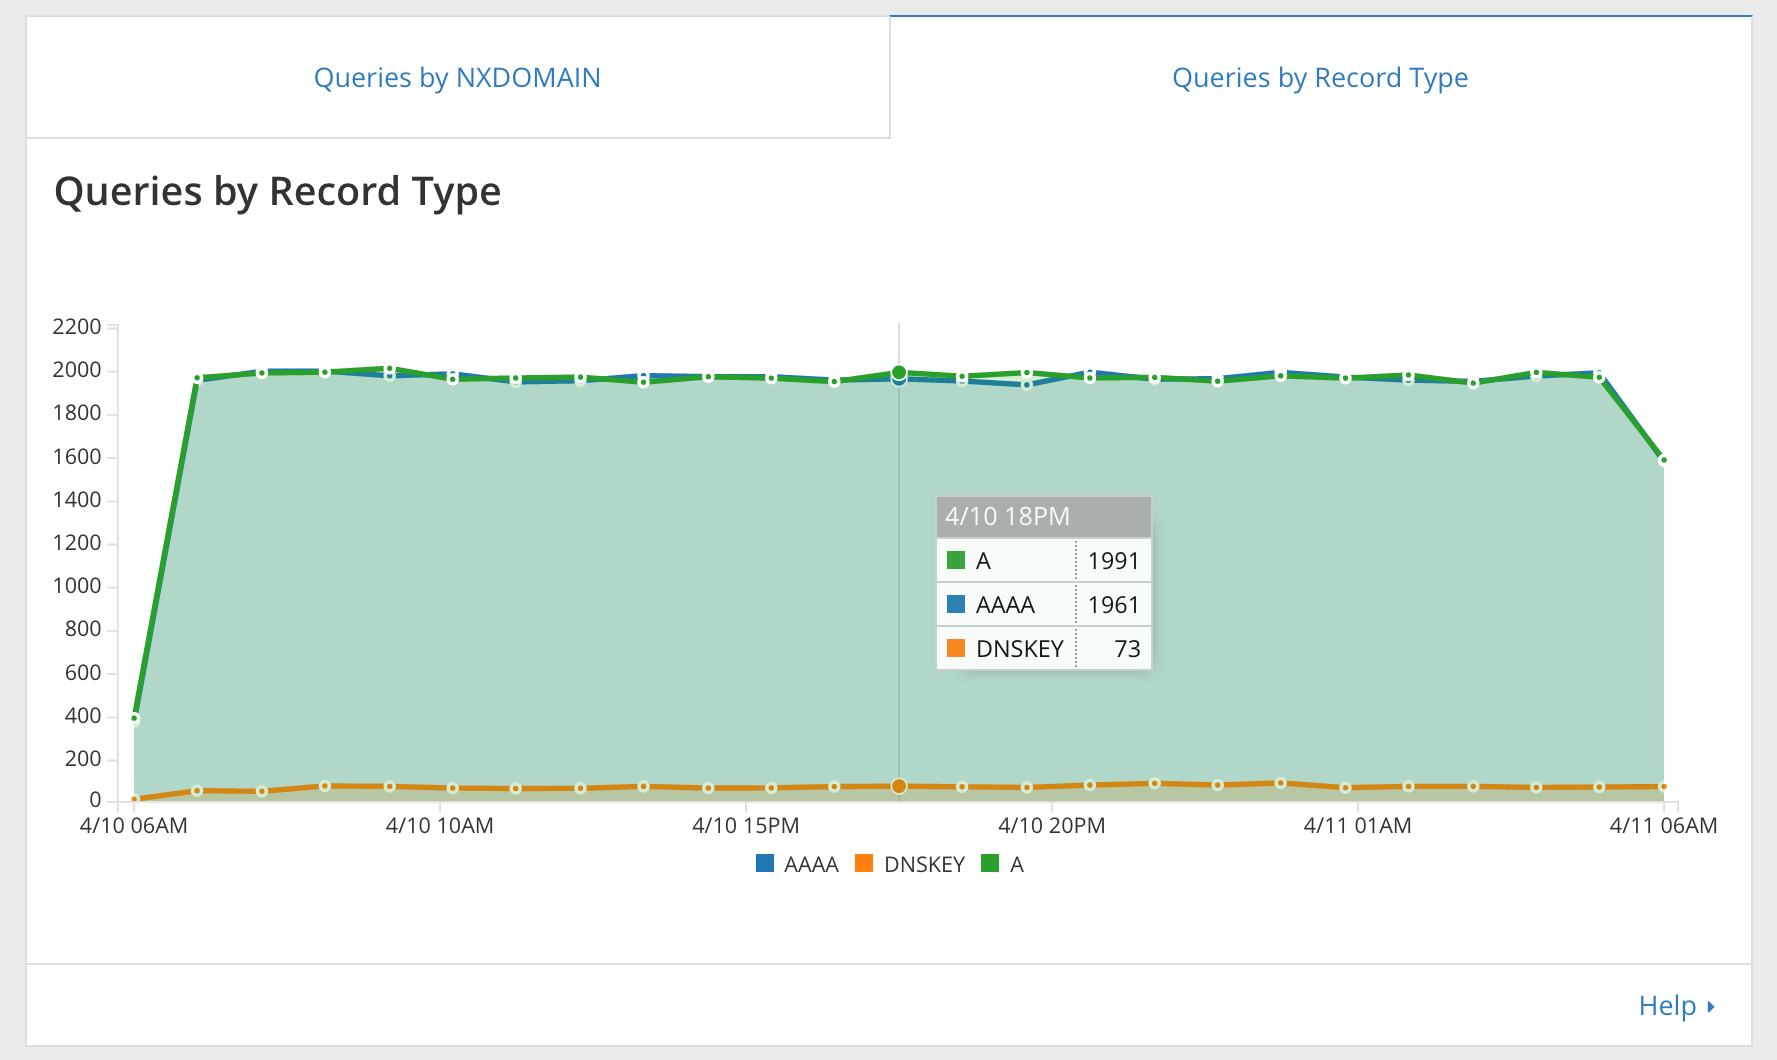
Lastly, back up at the top, business and enterprise customers can see a breakdown of traffic by record type. If your domain has DNSSEC enabled, you’ll even see queries for DNSKEY records, meaning DNS resolvers that are DNSSEC-aware are asking Cloudflare for your DNSSEC keys to verify DNS records are untampered with.
If you like what you’re seeing and wish you could use the data to piece together your own dashboards? You can. We’ve developed a Grafana plugin you can use to build your own dashboards and an API you can use to create your own tools. Plus the API gives you some added neat information like the distribution of queries over IPv6 vs IPv4 and UDP vs TCP, as well as the distribution of answers by query and response size. (DNS people rejoice -- now you can finally see if there’s a difference in query size between IPv6 and IPv4, and what is the breaking point where Cloudflare DNS answers switch from UDP to TCP.)
What about DNS Firewall and CNAME setup?
DNS Firewall customers, you’re next! Stay tuned! We have a really cool dashboard coming up for you that shows latency and errors on a per origin basis. We can’t wait for you to see it. In the meantime, you can see all your data through the Grafana plugin and API.
If you use Cloudflare but don’t see traffic in the DNS analytics dashboard, it’s because you use Cloudflare through a CNAME setup where your DNS is hosted outside of Cloudflare. Your DNS isn’t on us, so we can’t give you cool DNS analytics. If you’re interested in moving your DNS over to Cloudflare to try out DNS analytics and the newly announced Cloudflare Load Balancing, give our team a holler, they will swap your setup for you.
Let’s get started!
We are excited for you to get started digging into your DNS traffic. Let us know what you think by sending your feedback to [email protected]. Cloudflare DNS team eagerly awaits your feedback :). Now go on vacation, we’ll look after your DNS!