Color is my day-long obsession, joy and torment - Claude Monet

Over the last two years we’ve tried to improve our usage of color at Cloudflare. There were a number of forcing functions that made this work a priority. As a small team of designers and engineers we had inherited a bunch of design work that was a mix of values built by multiple teams. As a result it was difficult and unnecessarily time consuming to add new colors when building new components.
We also wanted to improve our accessibility. While we were doing pretty well, we had room for improvement, largely around how we used green. As our UI is increasingly centered around visualizations of large data sets we wanted to push the boundaries of making our analytics as visually accessible as possible.
Cloudflare had also undergone a rebrand around 2016. While our marketing site had rolled out an updated set of visuals, our product ui as well as a number of existing web properties were still using various versions of our old palette.
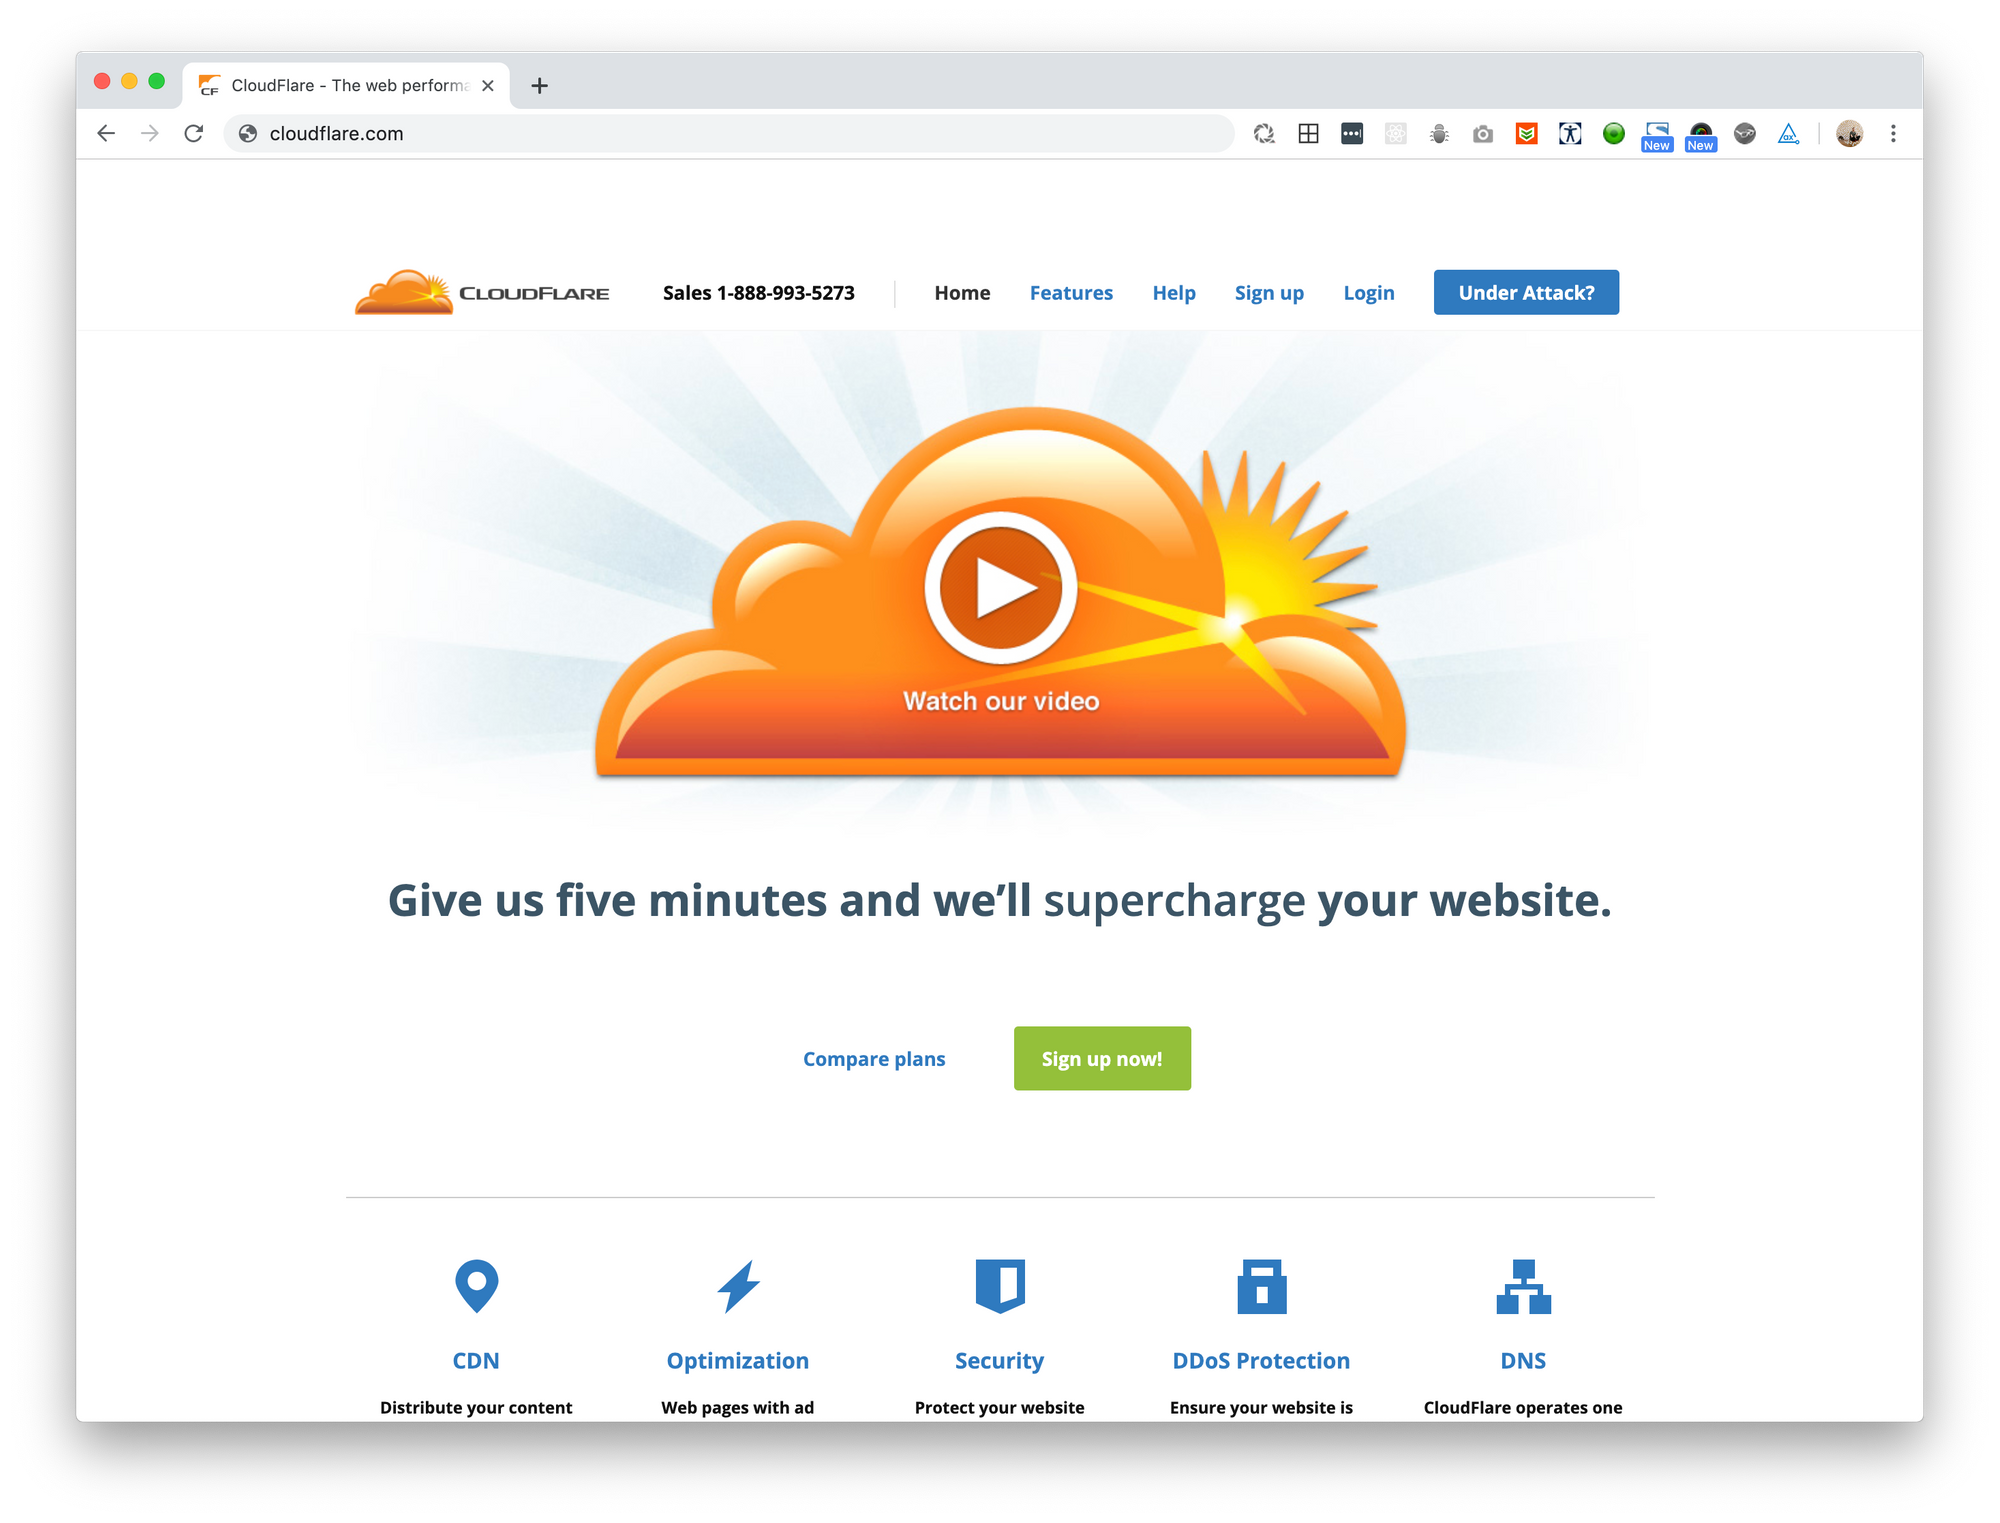
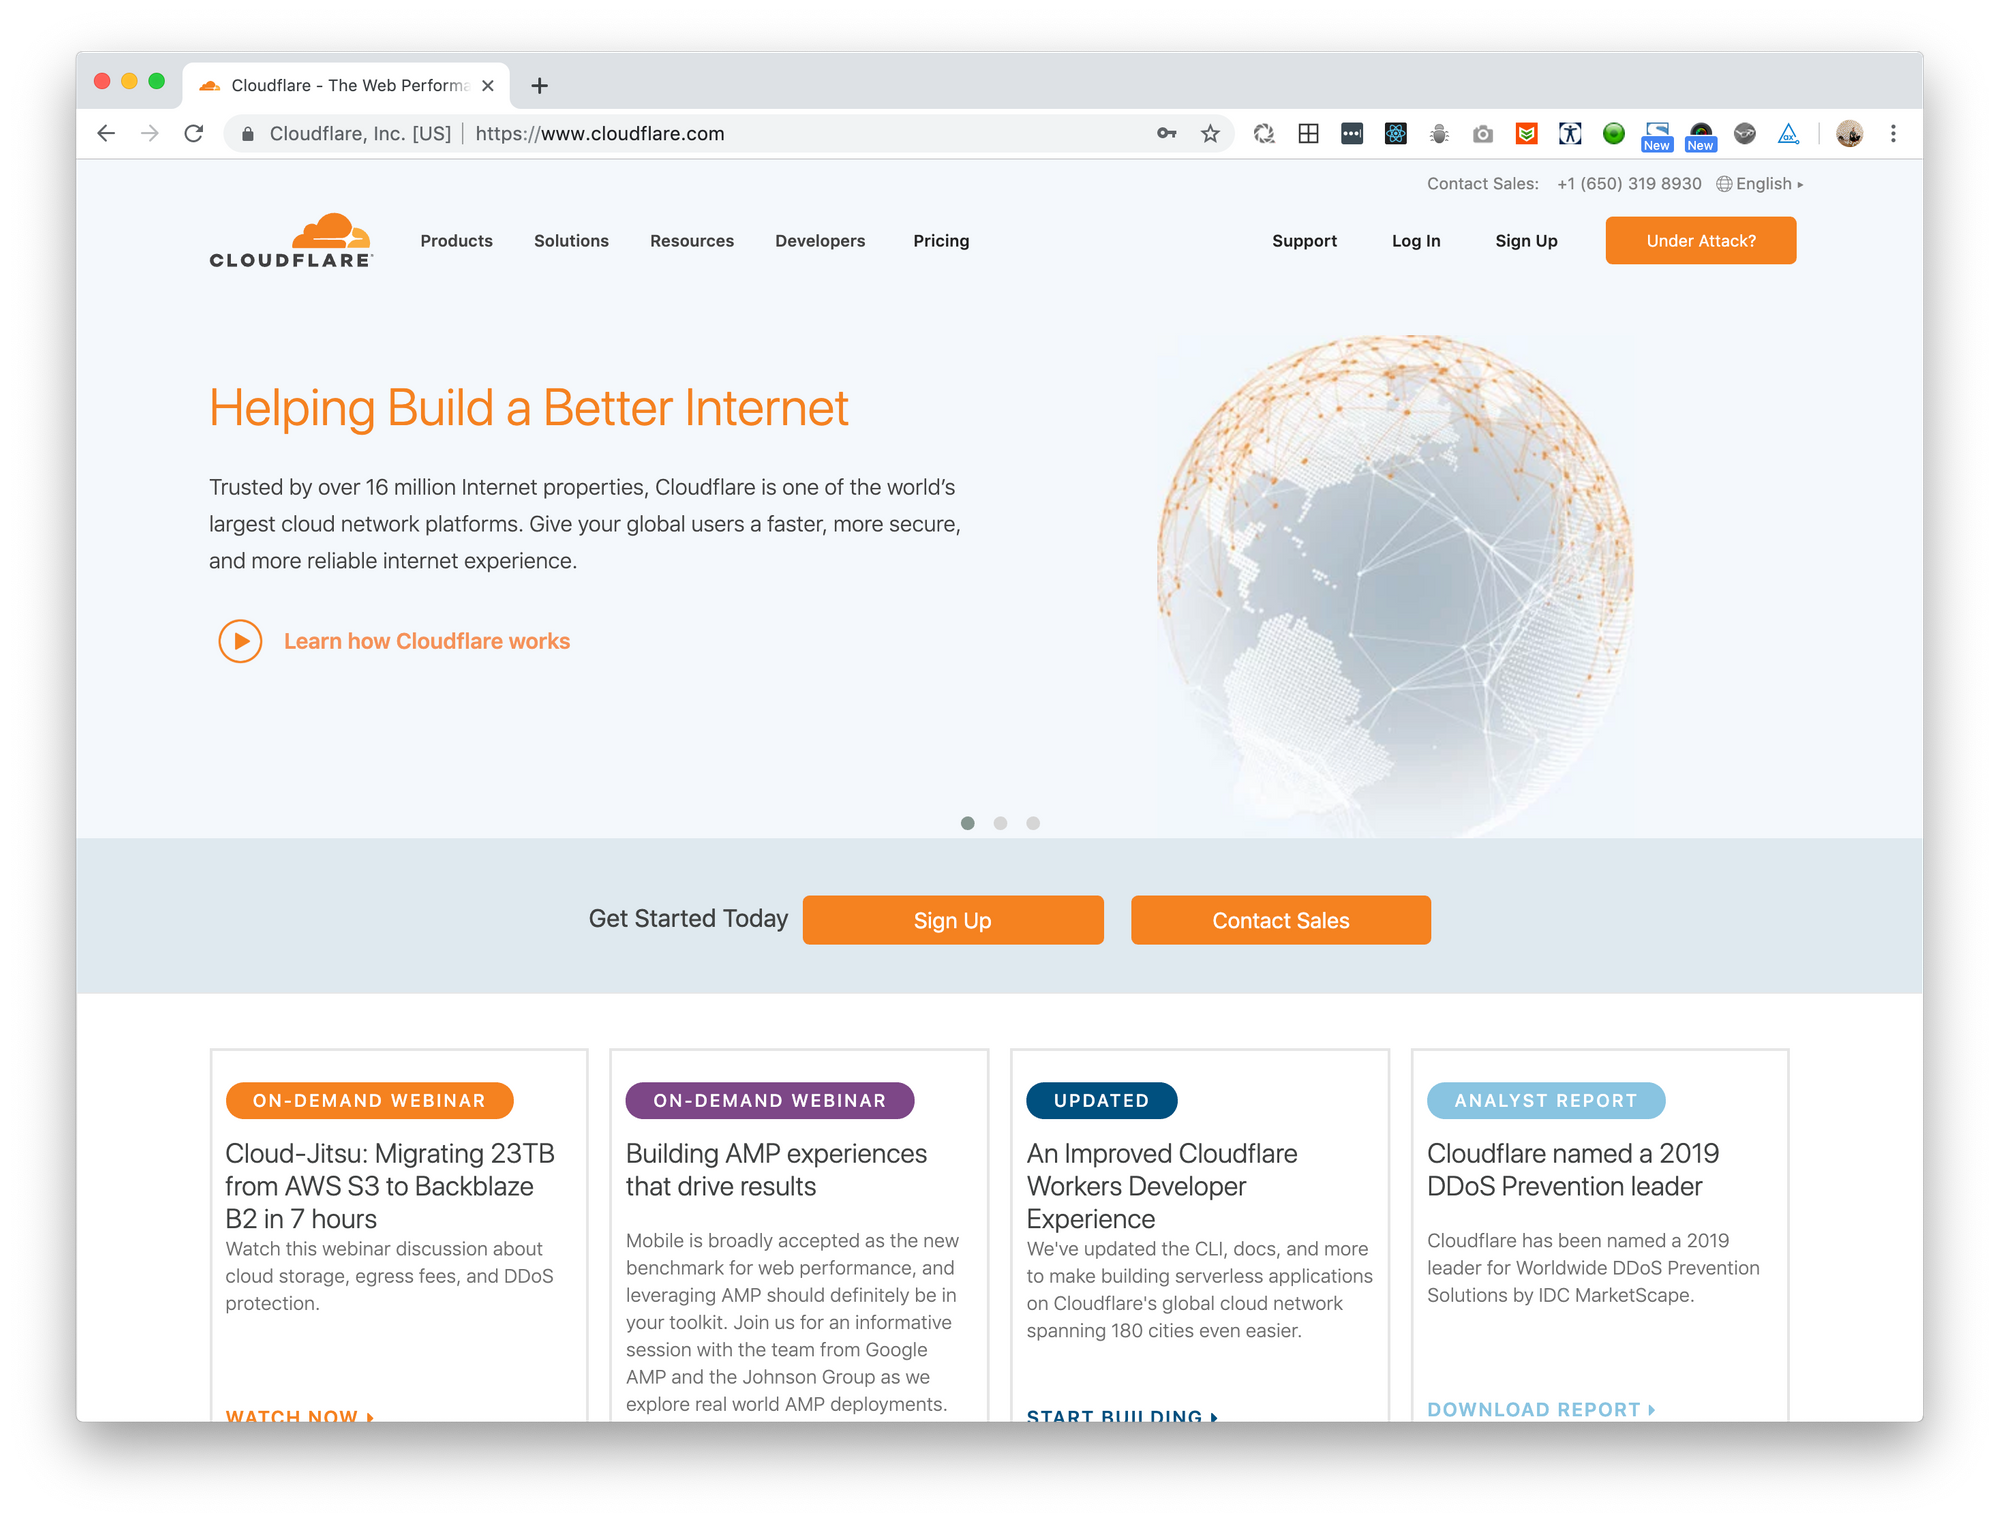
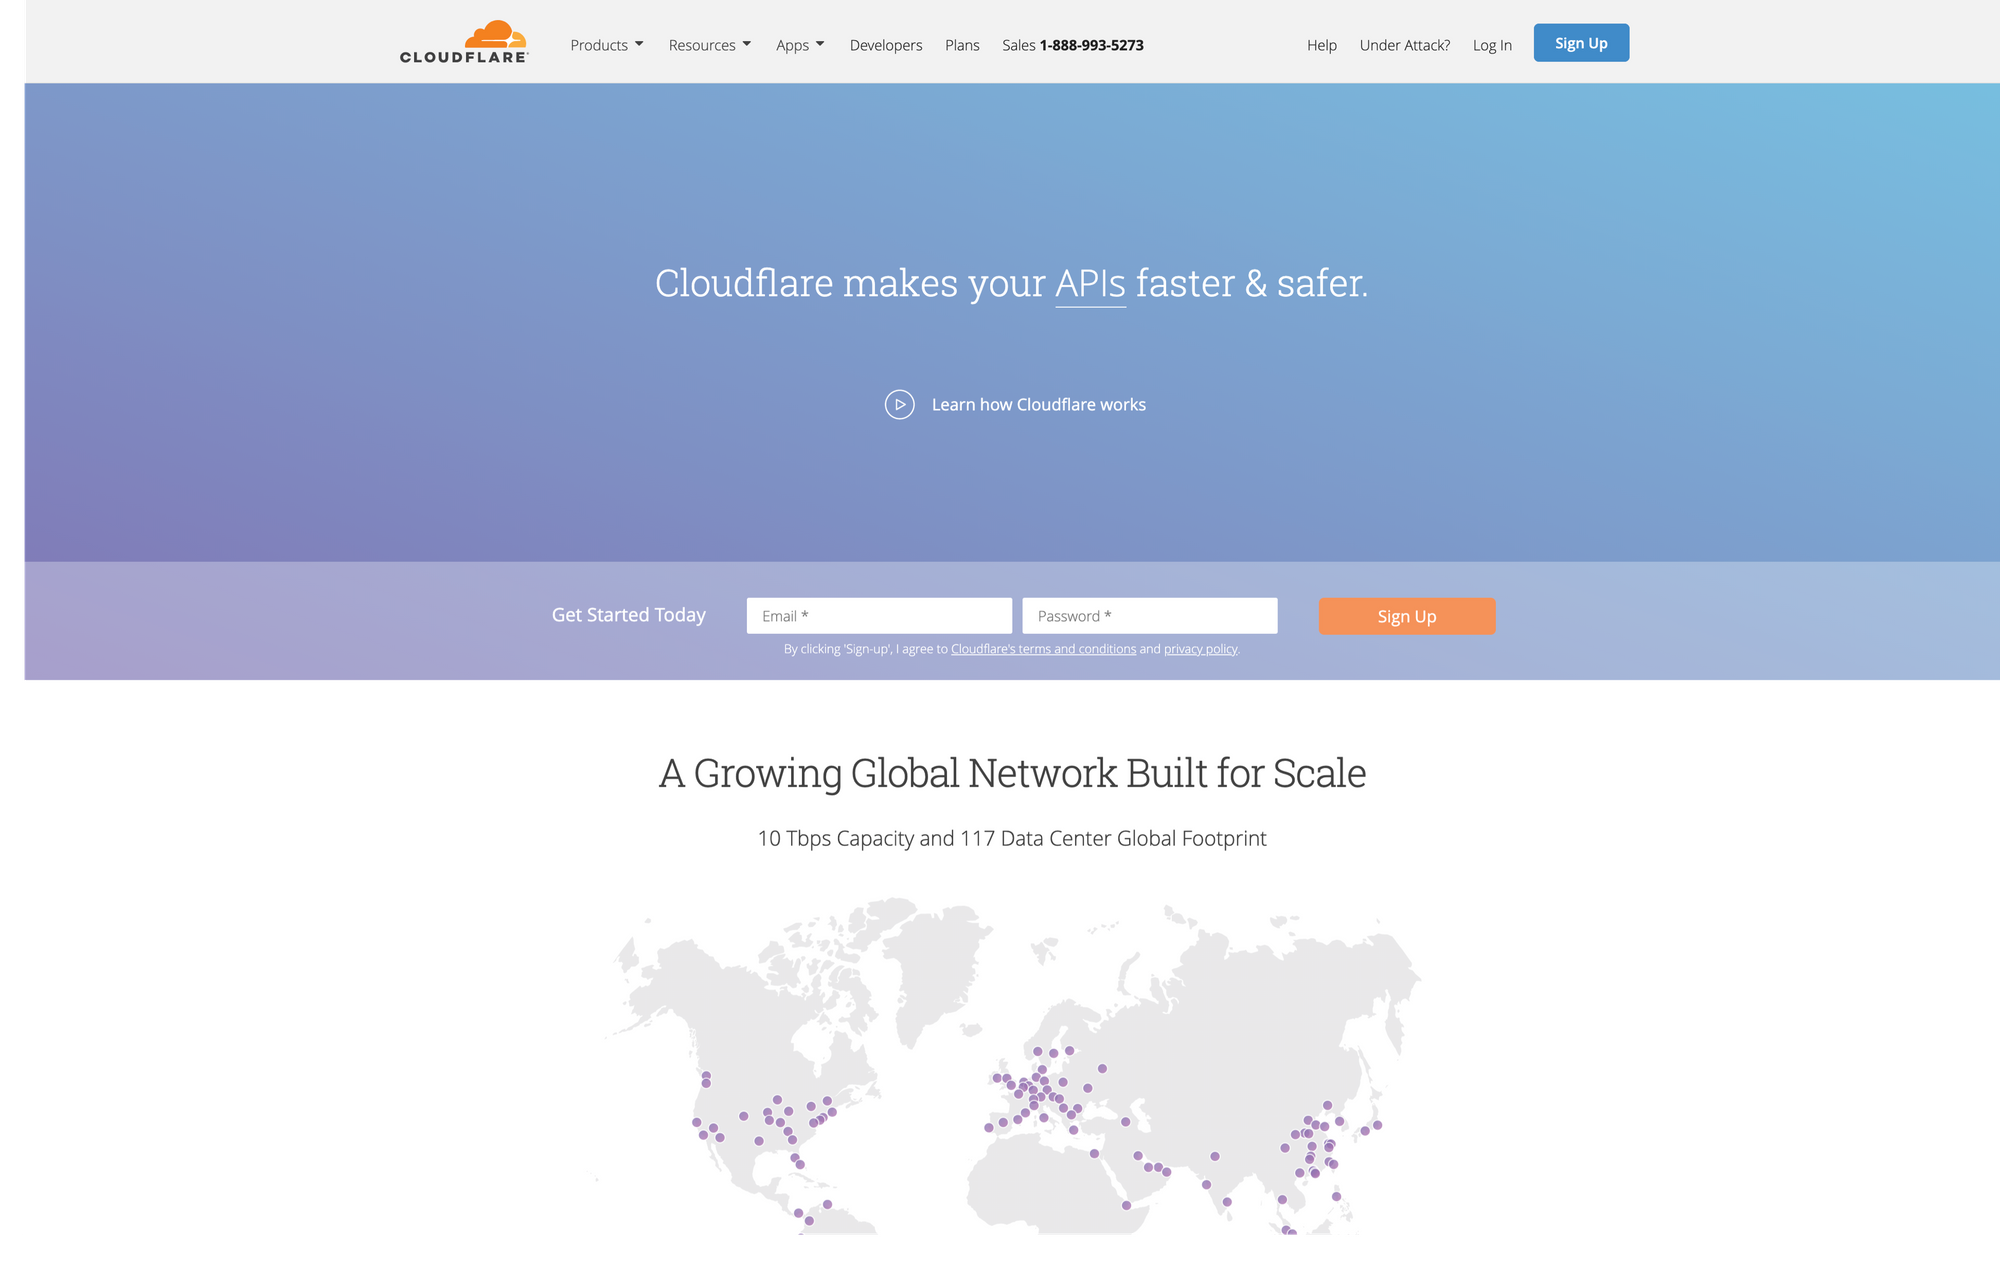
Our product palette wasn’t well balanced by itself. Many colors had been chosen one or two at a time. You can see how we chose blueberry, ice, and water at a different point in time than marine and thunder.

Lacking visual cohesion within our own product, we definitely weren’t providing a cohesive visual experience between our marketing site and our product. The transition from the nice blues and purples to our green CTAs wasn’t the streamlined experience we wanted to afford our users.
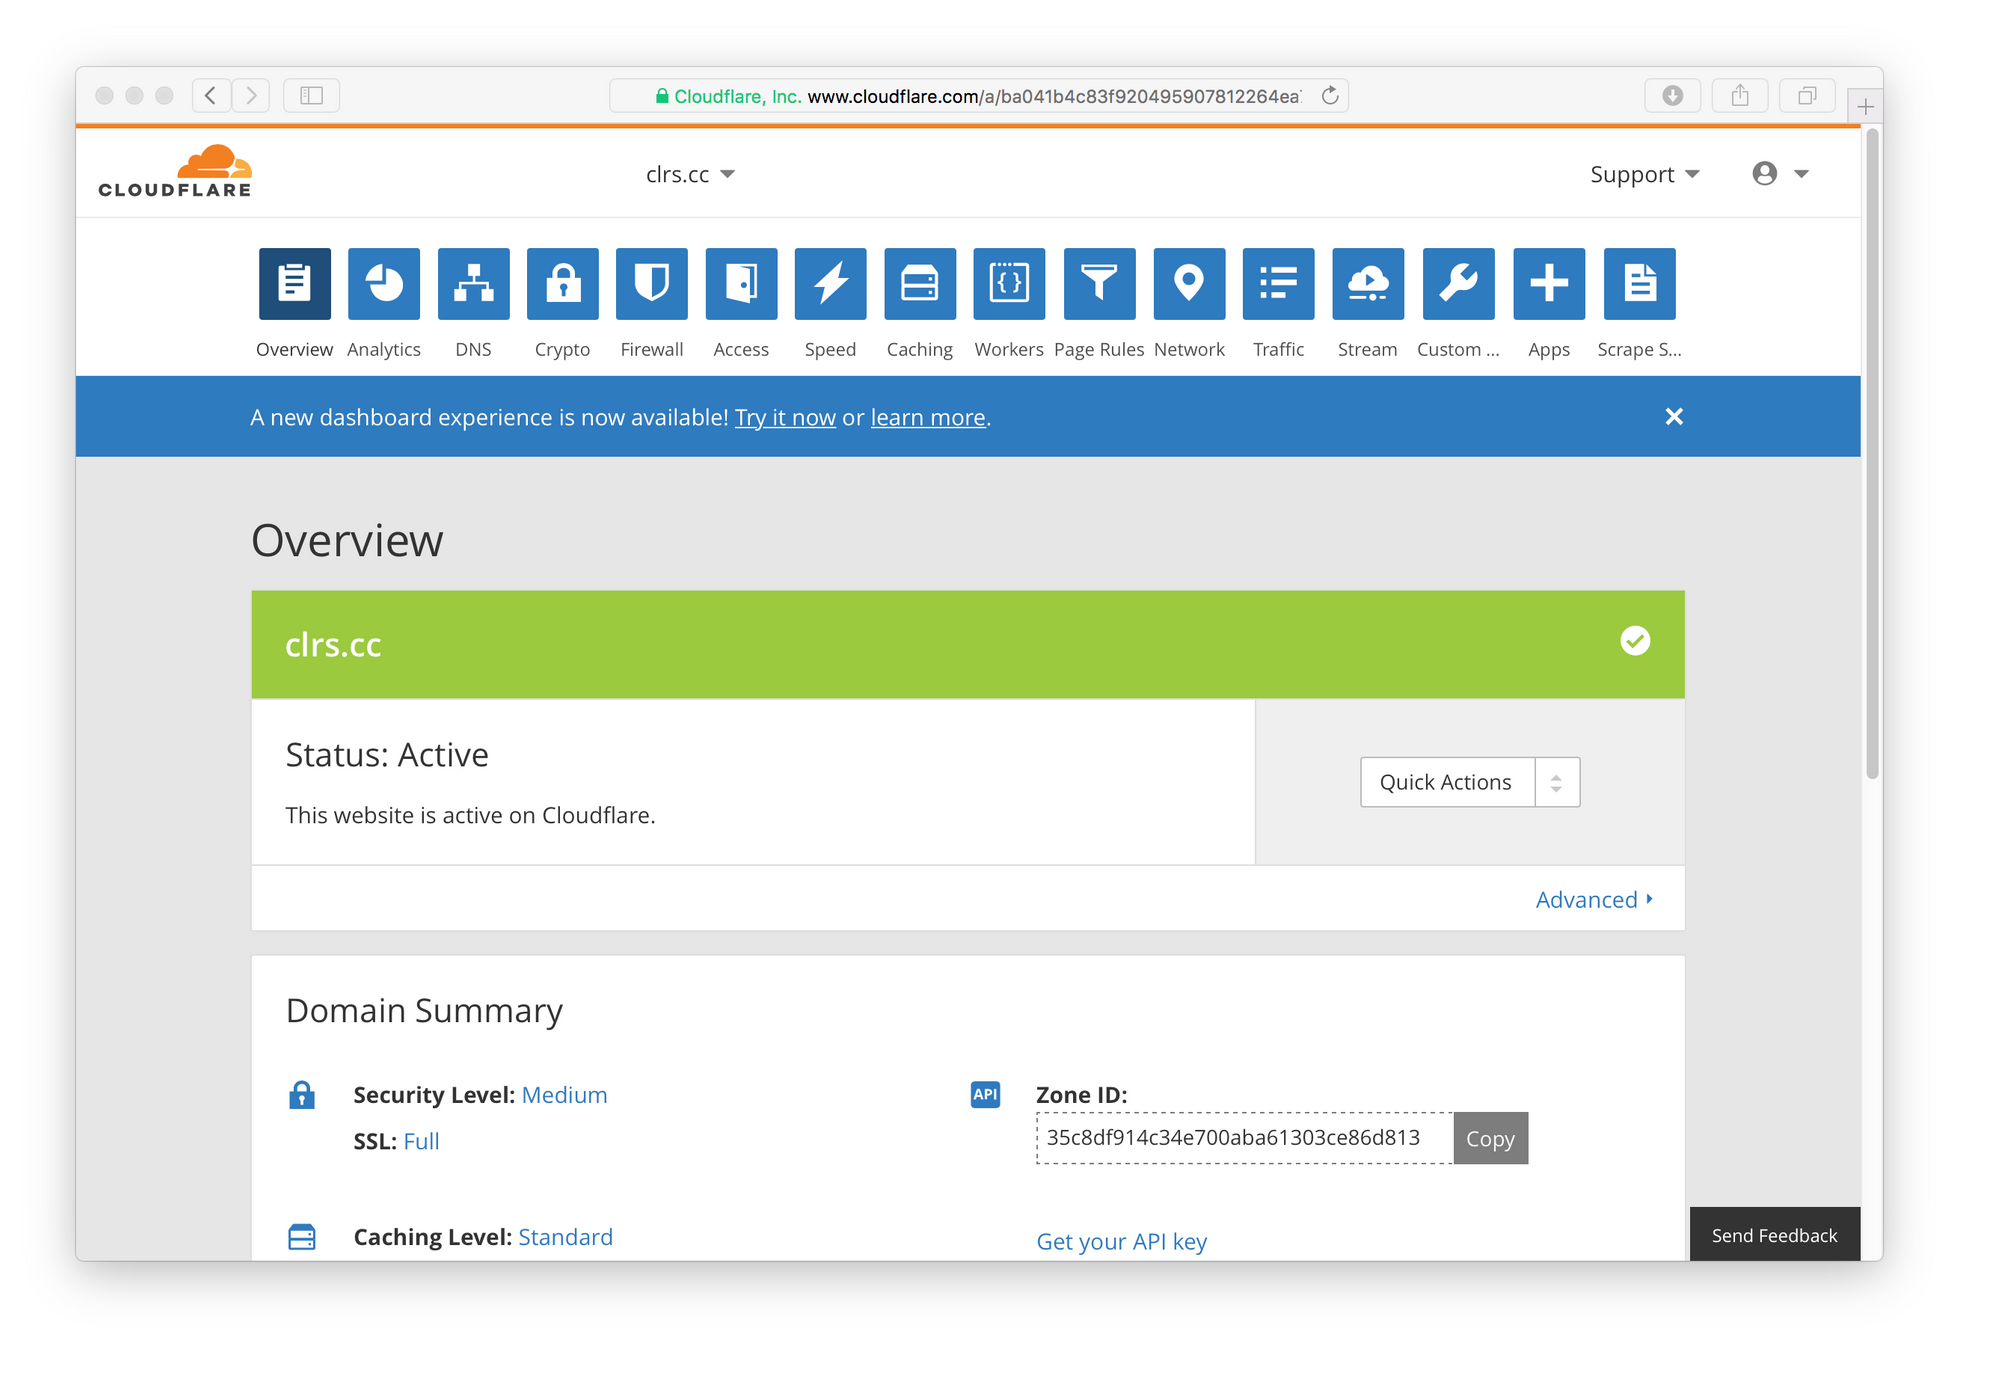
Reworking our Palette
Our first step was to audit what we already had. Cloudflare has been around long enough to have more than one website. Beyond cloudflare.com we have dozens of web properties that are publicly accessible. From our community forums, support docs, blog, status page, to numerous micro-sites.
All-in-all we have dozens of front-end codebases that each represent one more chance to introduce entropy to our visual language. So we were curious to answer the question - what colors were we currently using? Were there consistent patterns we could document for further reuse? Could we build a living style guide that didn’t cover just one site, but all of them?
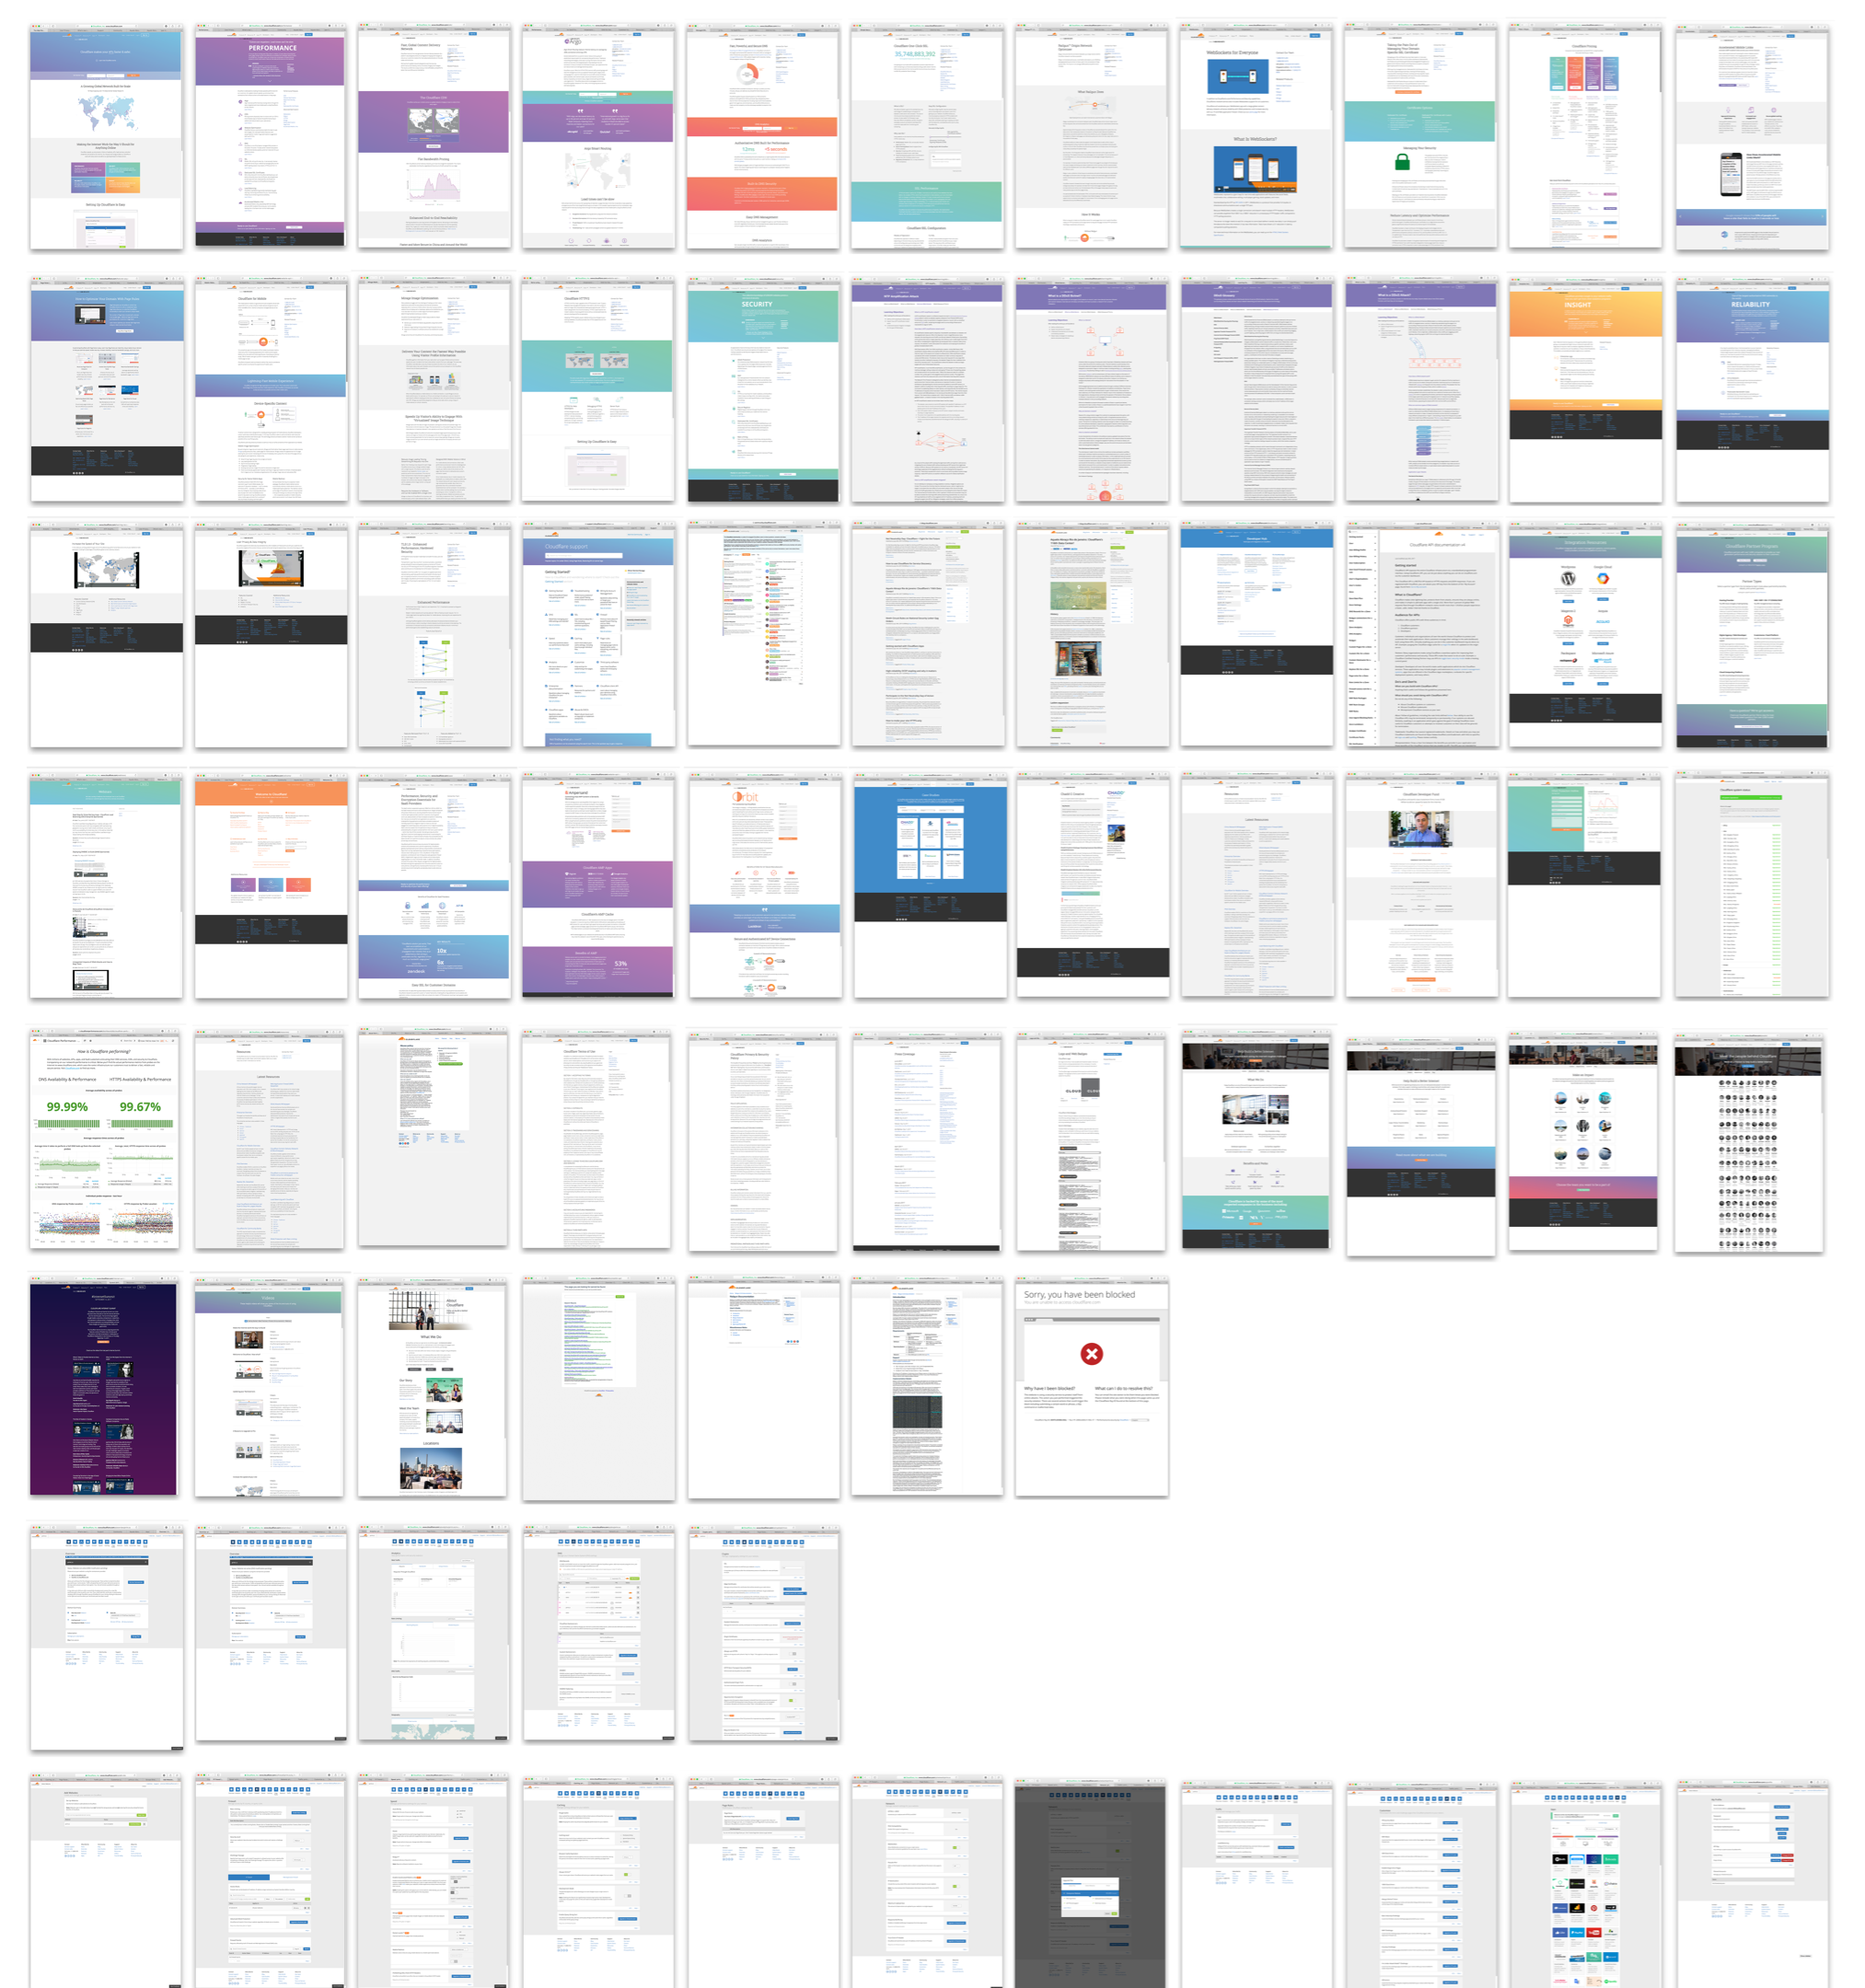
Our curiosity got the best of us and we went about exploring ways we could visualize our design language across all of our sites.

A time machine for color
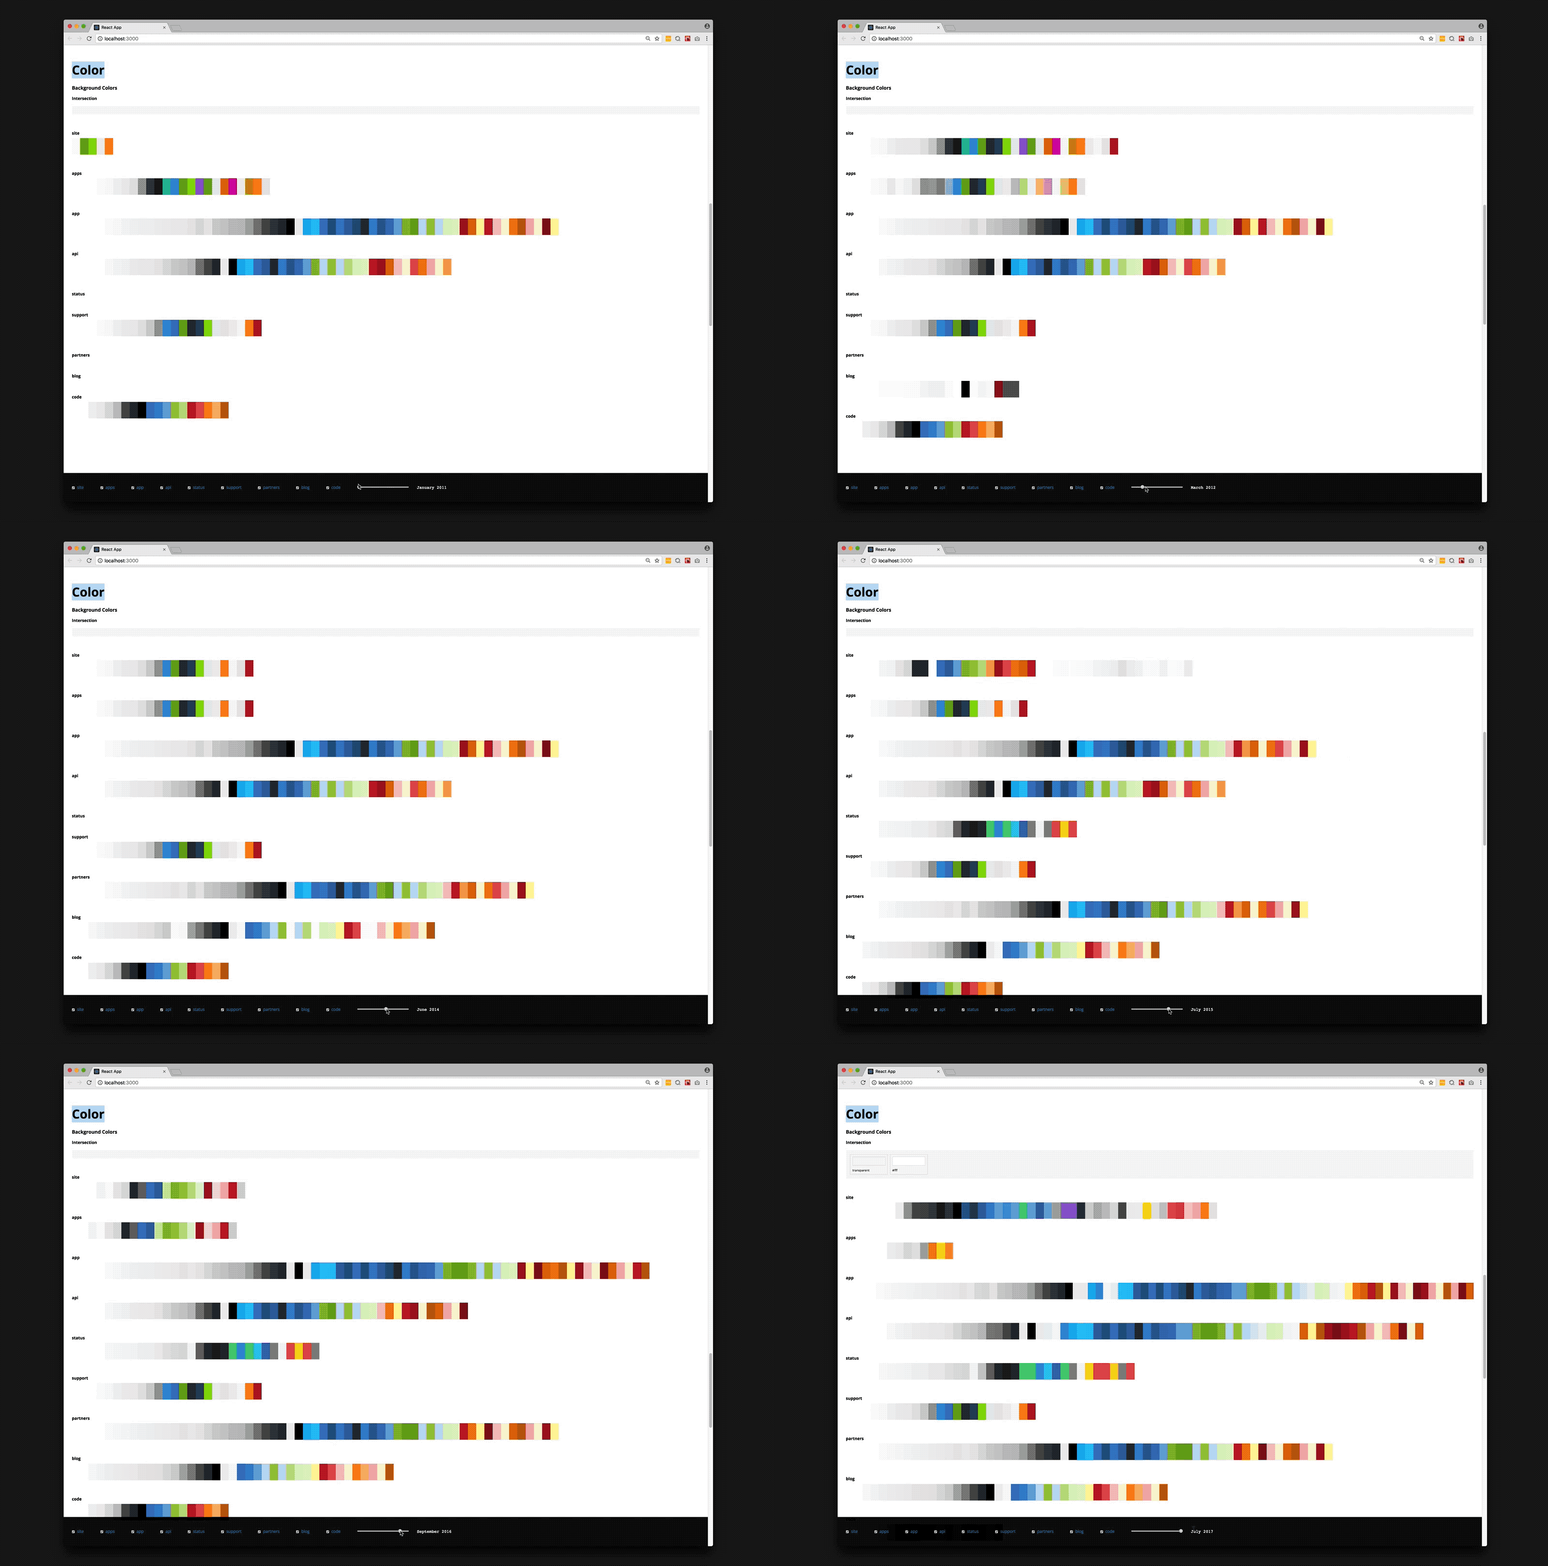
As we first started to identify the scale of our color problems, we tried to think outside the box on how we might explore the problem space. After an initial brainstorming session we combined the Internet Archive's Wayback Machine with the Css Stats API to build an audit tool that shows how our various websites visual properties change over time. We can dynamically select which sites we want to compare and scrub through time to see changes.
Below is a visualization of palettes from 9 different websites changing over a period of 6 years. Above the palettes is a component that spits out common colors, across all of these sites. The only two common colors across all properties (appearing for only a brief flash) were #ffffff (white) and transparent. Over time we haven’t been very consistent with ourselves.
If we drill in to look at our marketing site compared to our dashboard app - it looks like the video below. We see a bit more overlap at first and then a significant divergence at the 16 second mark when our product palette grew significantly. At the 22 second mark you can see the marketing palette completely change as a result of the rebrand while our product palette stays the same. As time goes on you can see us becoming more and more inconsistent across the two code bases.
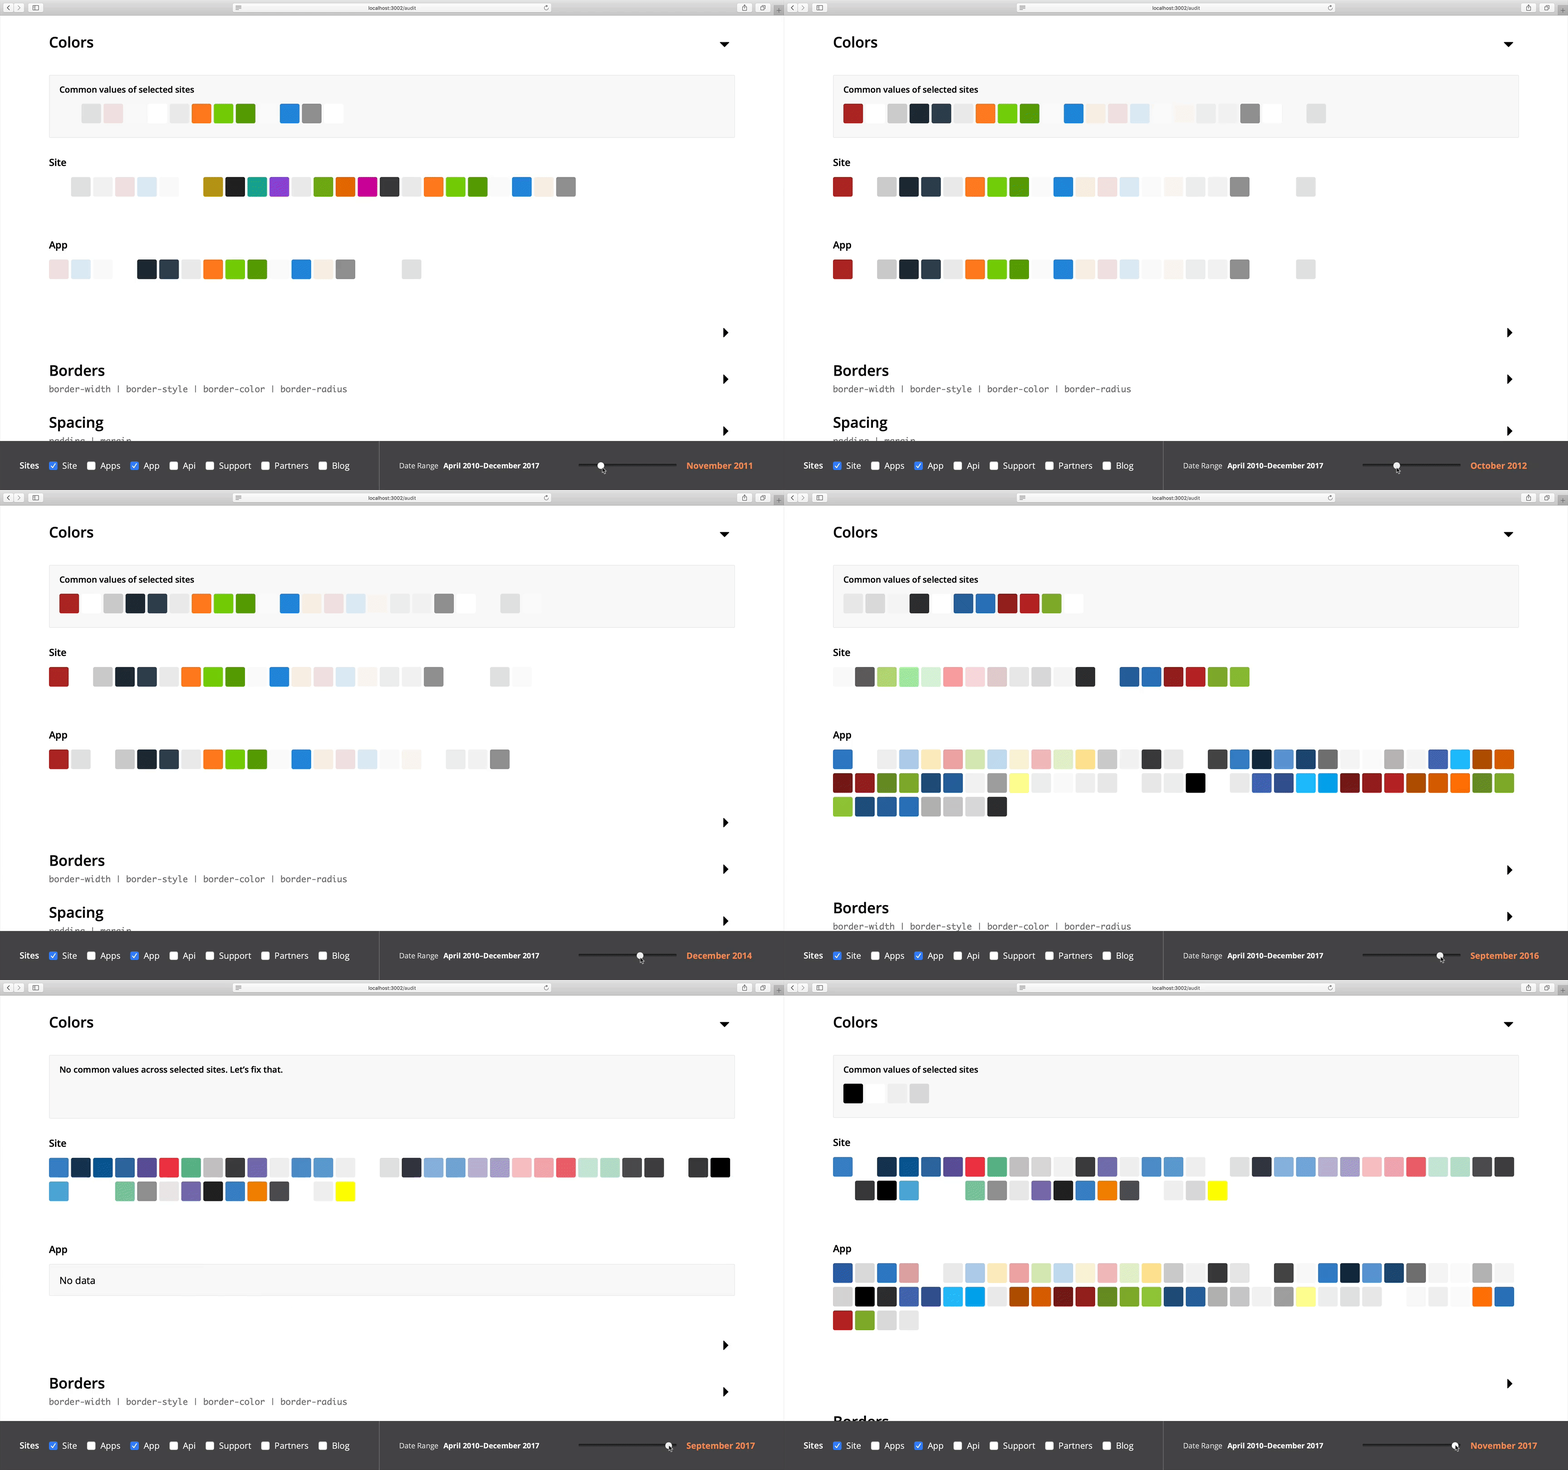
As a product team we had some catching up to do improve our usage of color and to align ourselves with the company brand. The good news was, there was no where to go but up.
This style of historical audit gives us a visual indication with real data. We can visualize for stakeholders how consistent and similar our usage of color is across products and if we are getting better or worse over time. Having this type of feedback loop was invaluable for us - as auditing this manually is incredibly time consuming so it often doesn’t get done. Hopefully in the future as it’s standard to track various performance metrics over time at a company it will be standard to be able to visualize your current levels of design entropy.
Picking colors
After our initial audit revealed there wasn’t a lot of consistency across sites, we went to work to try and construct a color palette that could potentially be used for sites the product team owned. It was time to get our hands dirty and start “picking colors.”
Hindsight of course is always 20/20. We didn’t start out on day one trying to generate scales based on our brand palette. No, our first bright idea, was to generate the entire palette from a single color.
Our logo is made up of two oranges. Both of these seemed like prime candidates to generate a palette from.

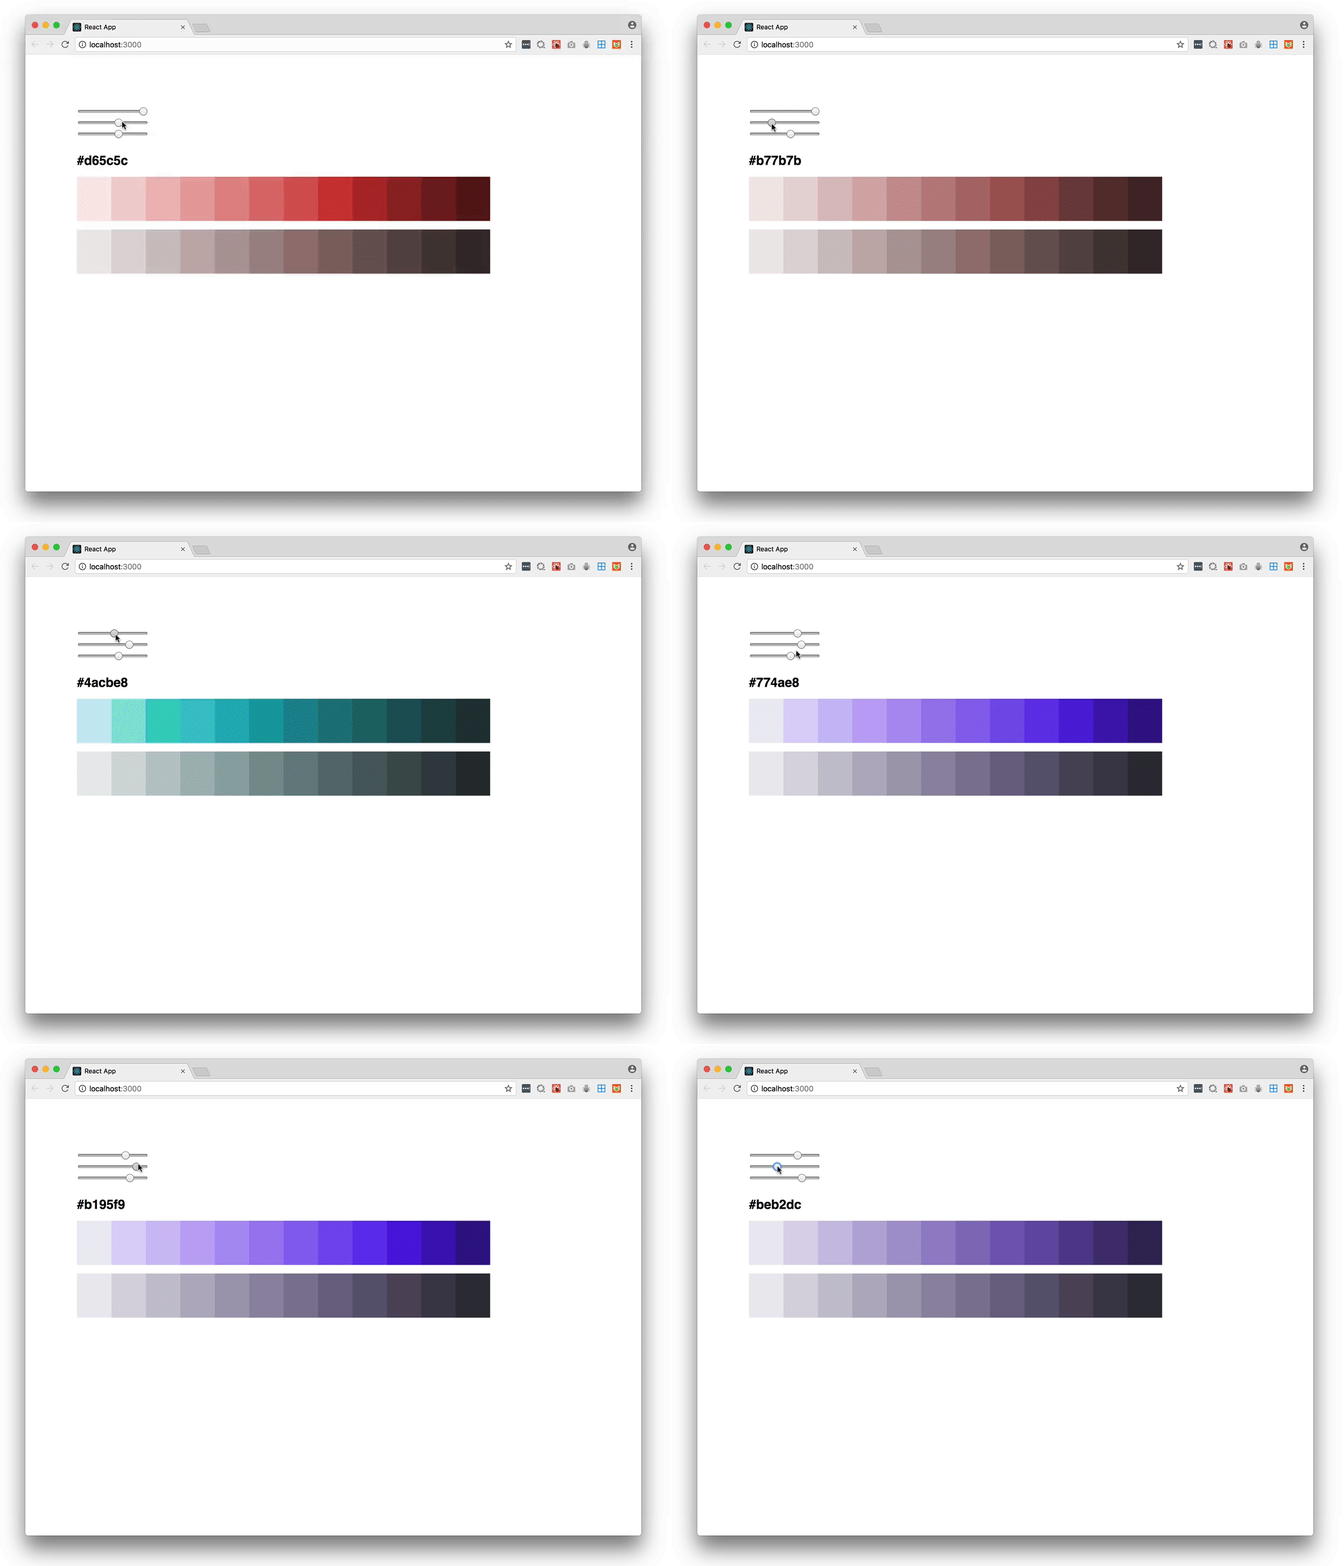
We played around with a number of algorithms that took a single color and created a palette. From the initial color we generated an array scales for each hue. Initial attempts found us applying the exact same curves for luminosity to each hue, but as visual perception of hues is so different, this resulted in wildly different contrasts at each step of the scale.
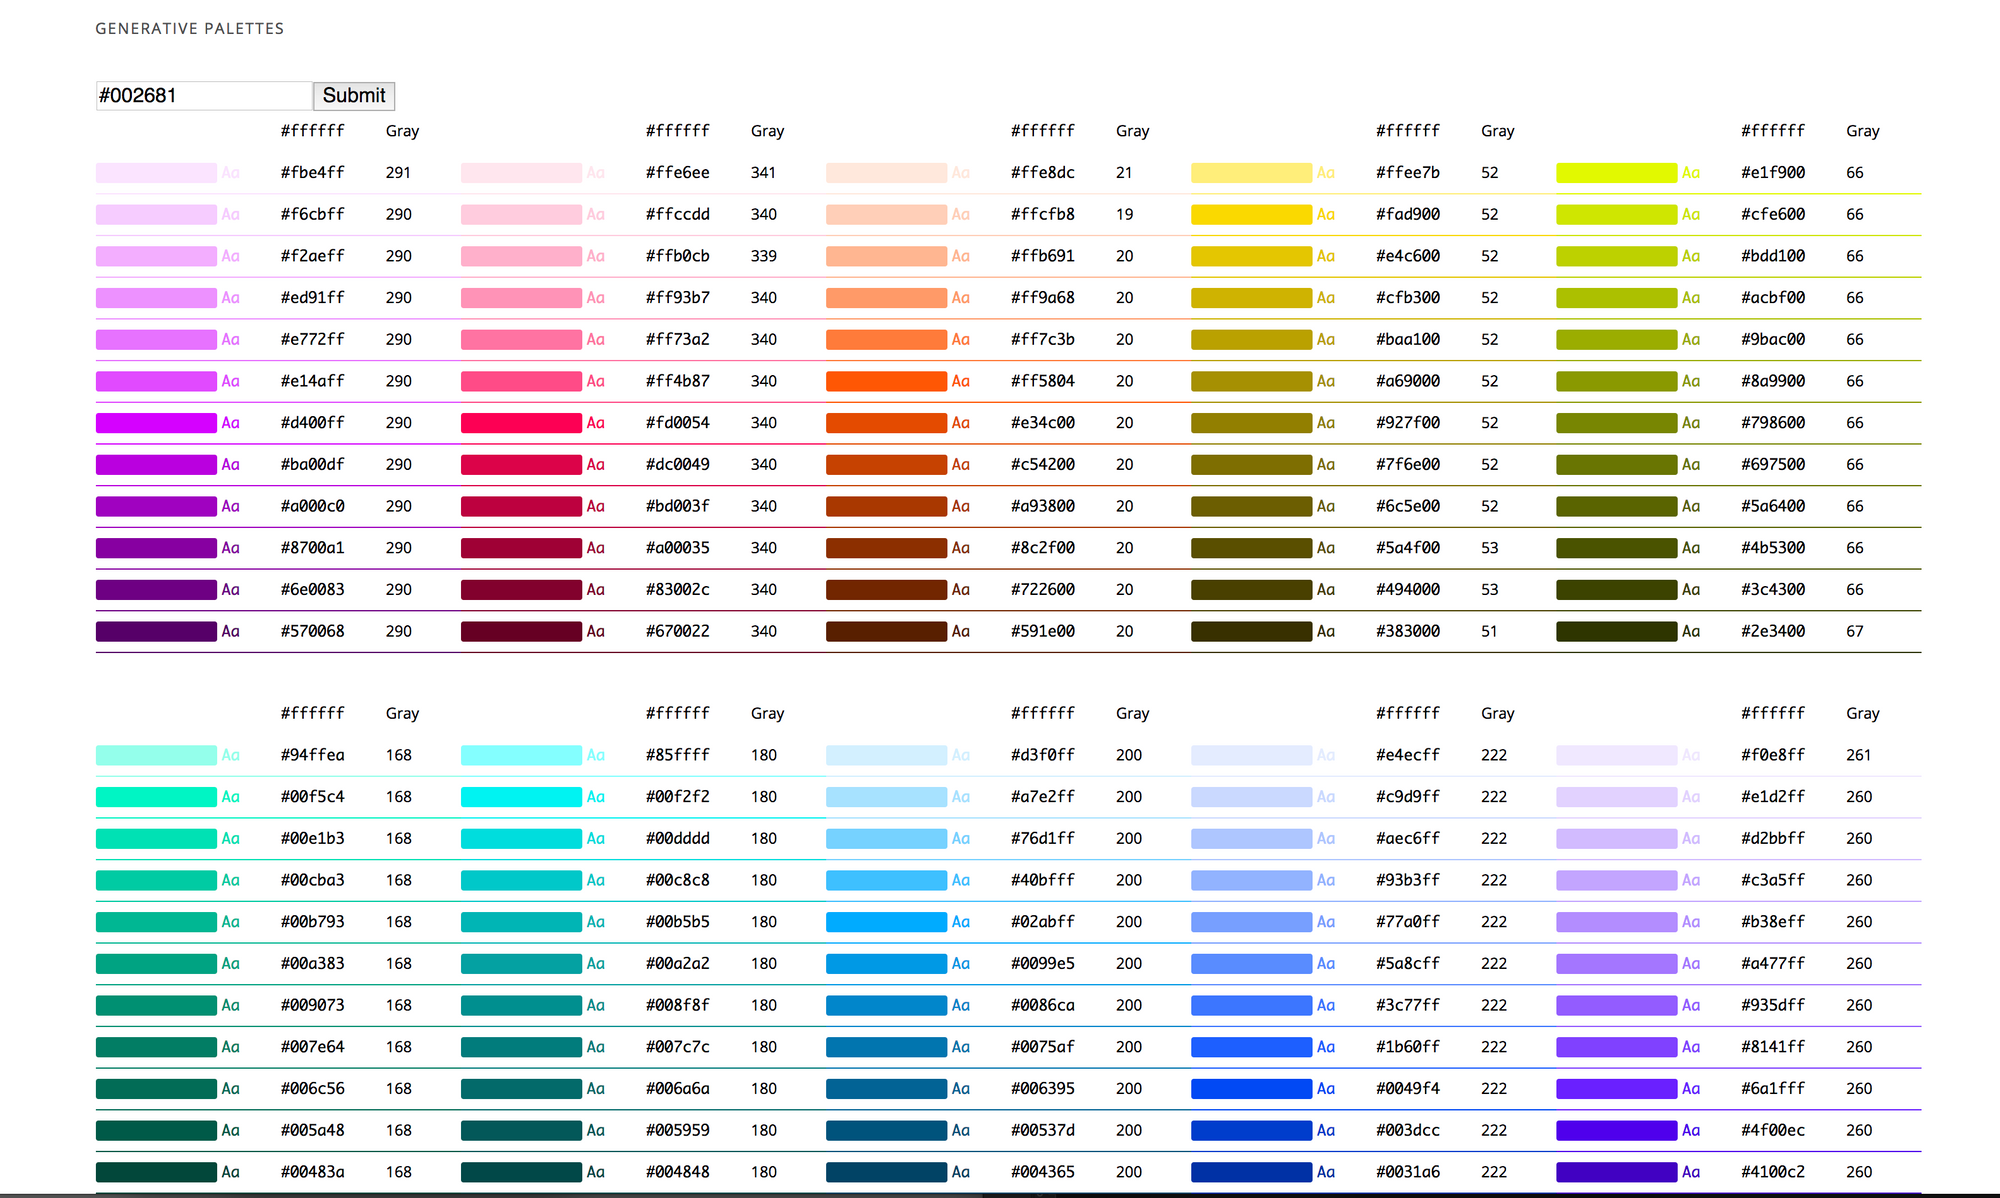
Below are a few of our initial attempts at palette generation. Jeeyoung Jung did a brilliant writeup around designing palettes last year.

We can see the intensity of the colors change across hue in peaks, with yellow and green being the most dominant. One of the downsides of this, is when you are rapidly iterating through theming options, the inconsistent relationships between steps across hues can make it time consuming or impossible to keep visual harmony in your interface.
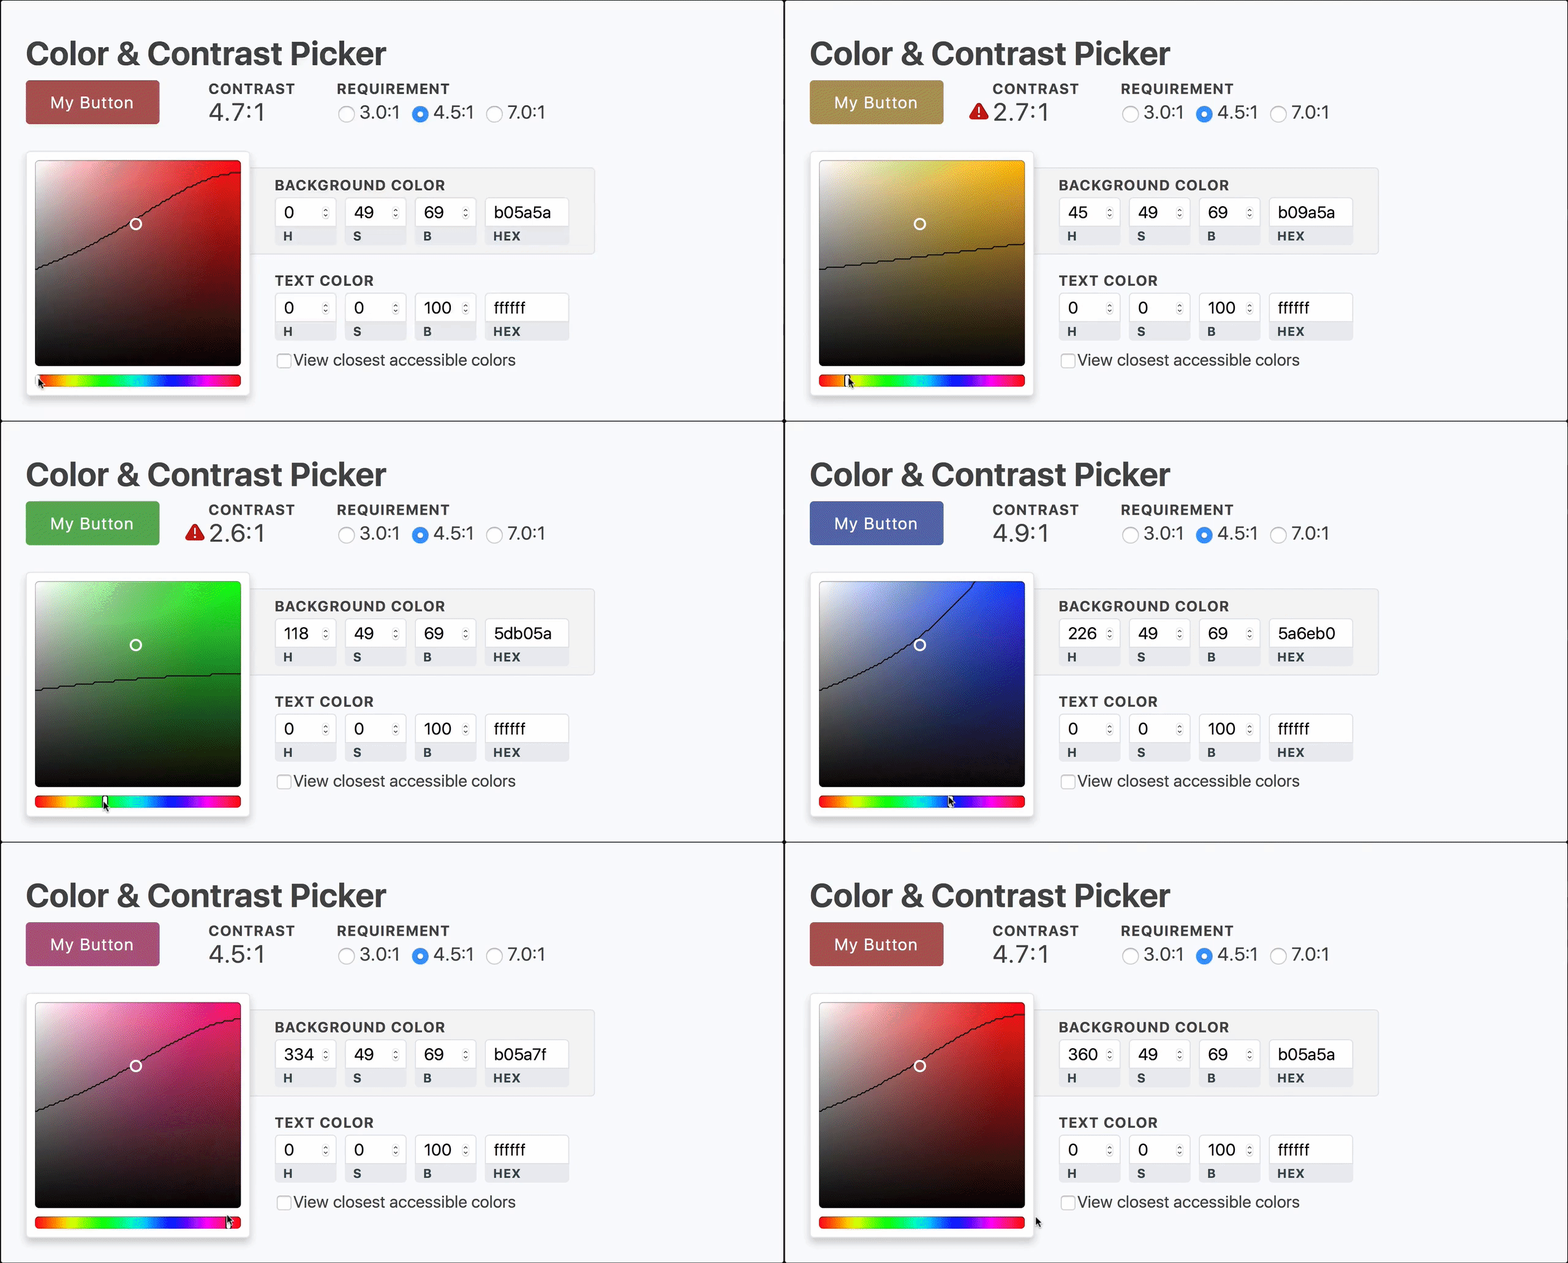
The video below is another way to visualize this phenomenon. The dividing line in the color picker indicates which part of the palette will be accessible with black and white. Notice how drastically the line changes around green and yellow. And then look back at the charts above.
After fiddling with a few different generative algorithms (we made a lot of ugly palettes…) we decided to try a more manual approach. We pursued creating custom curves for each hue in an effort to keep the contrast scales as optically balanced as possible.
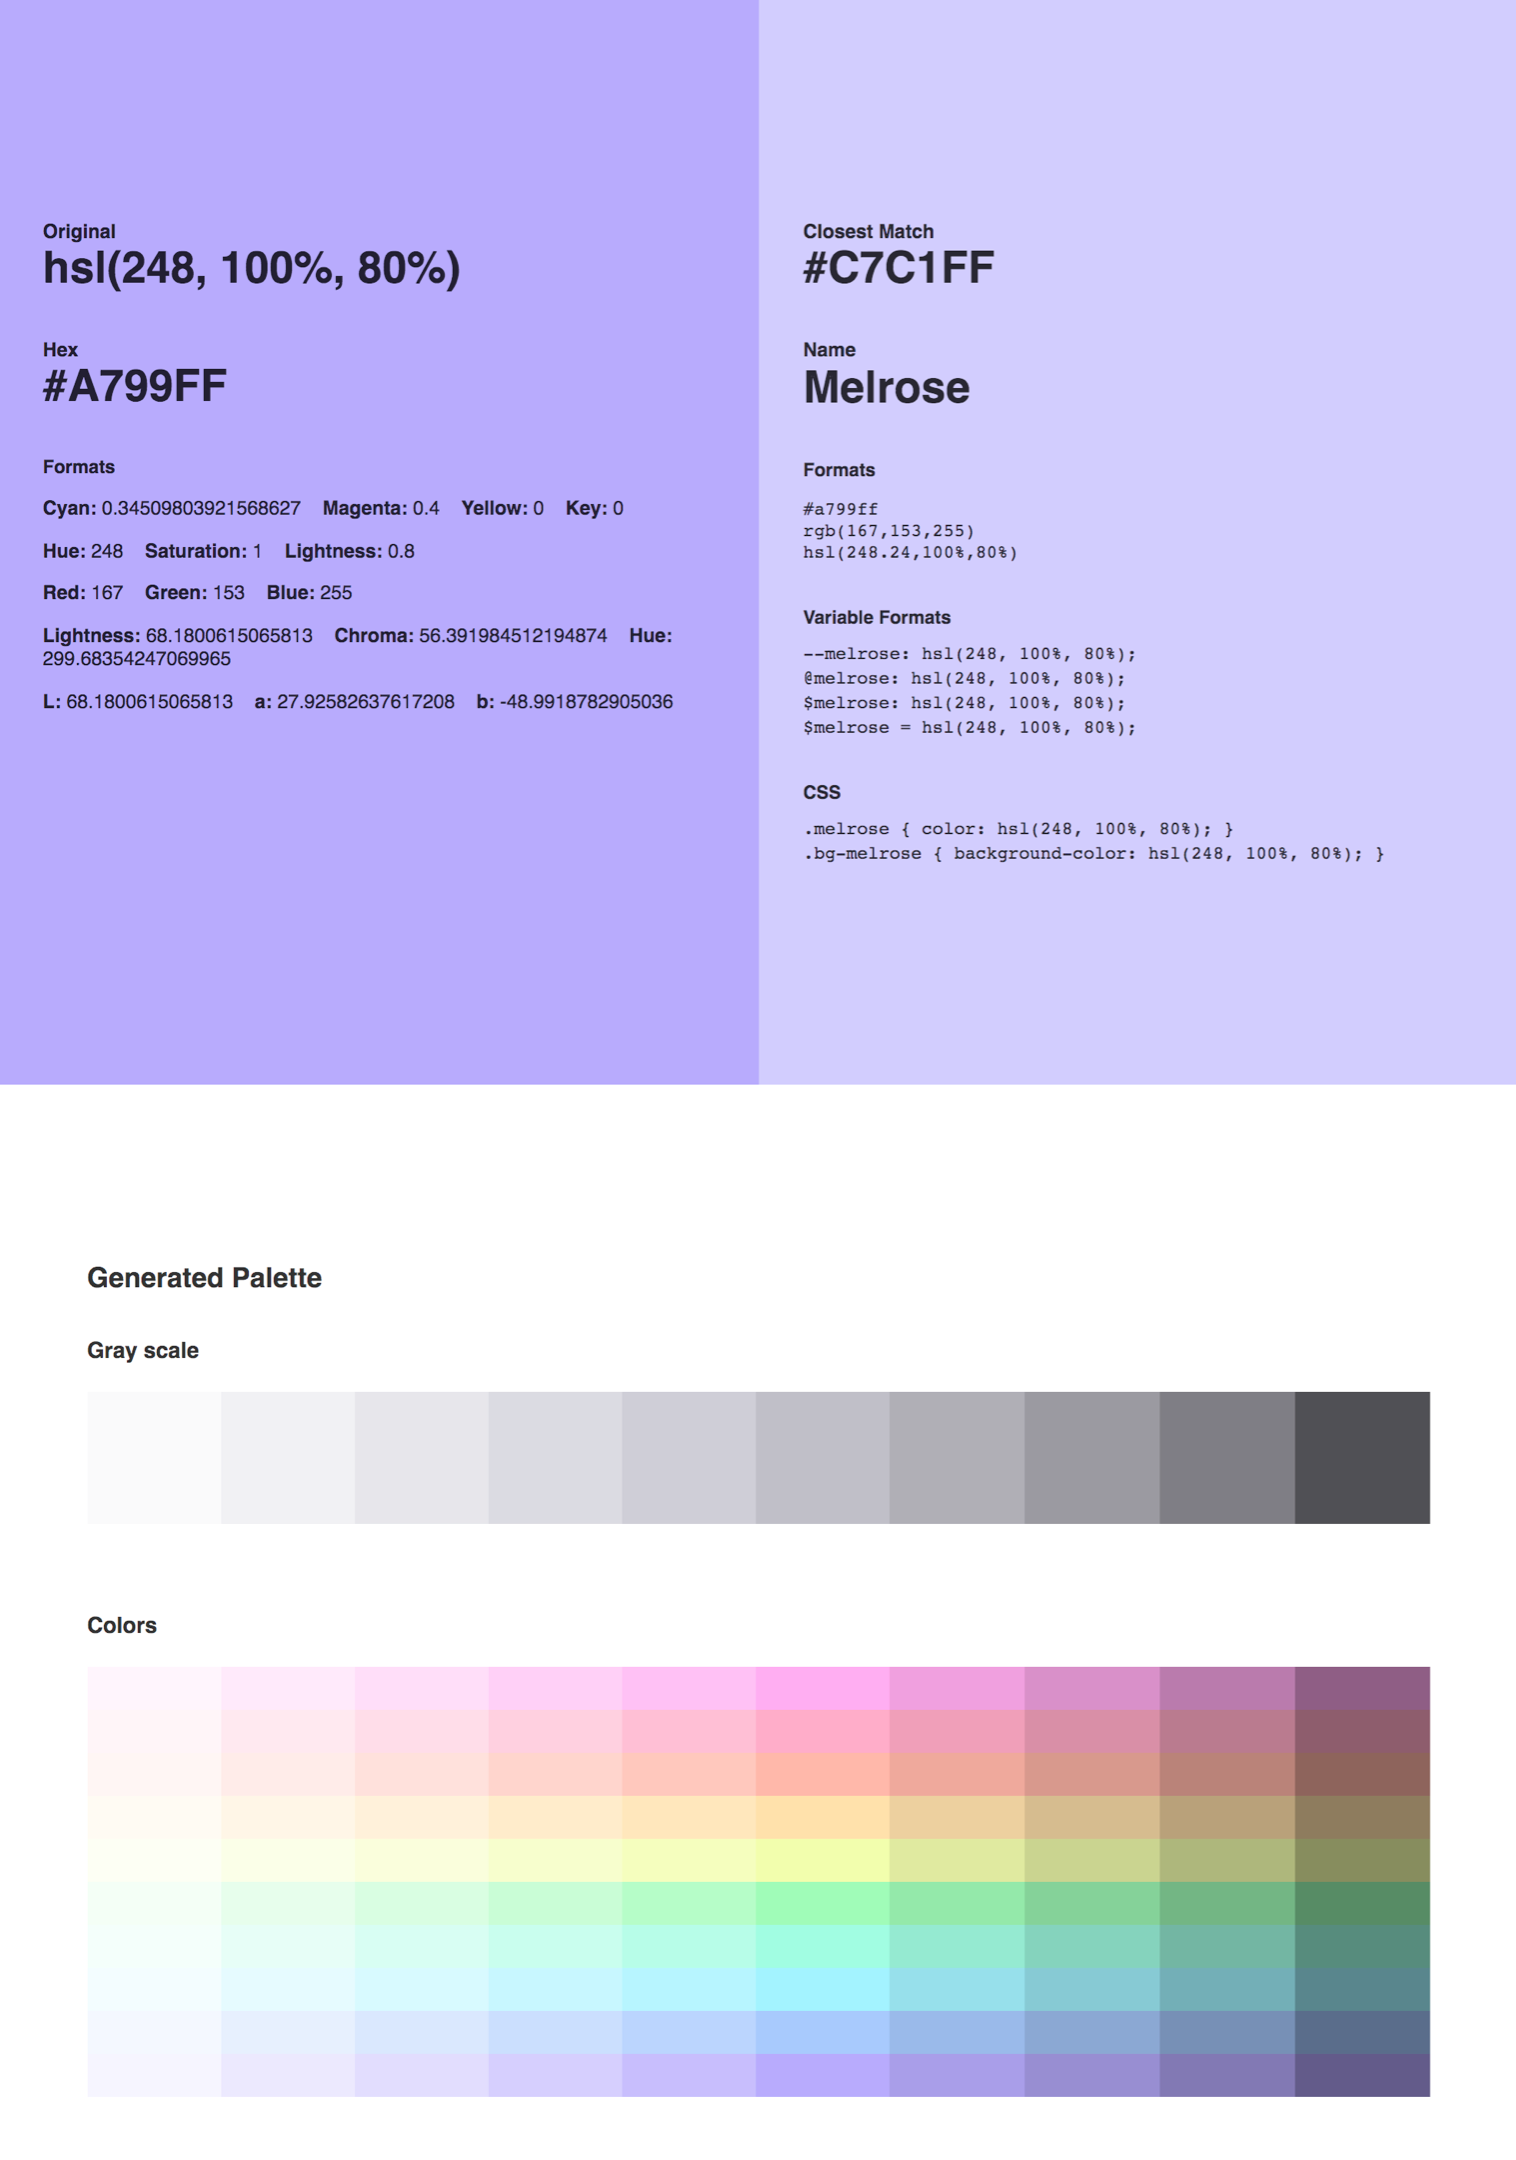
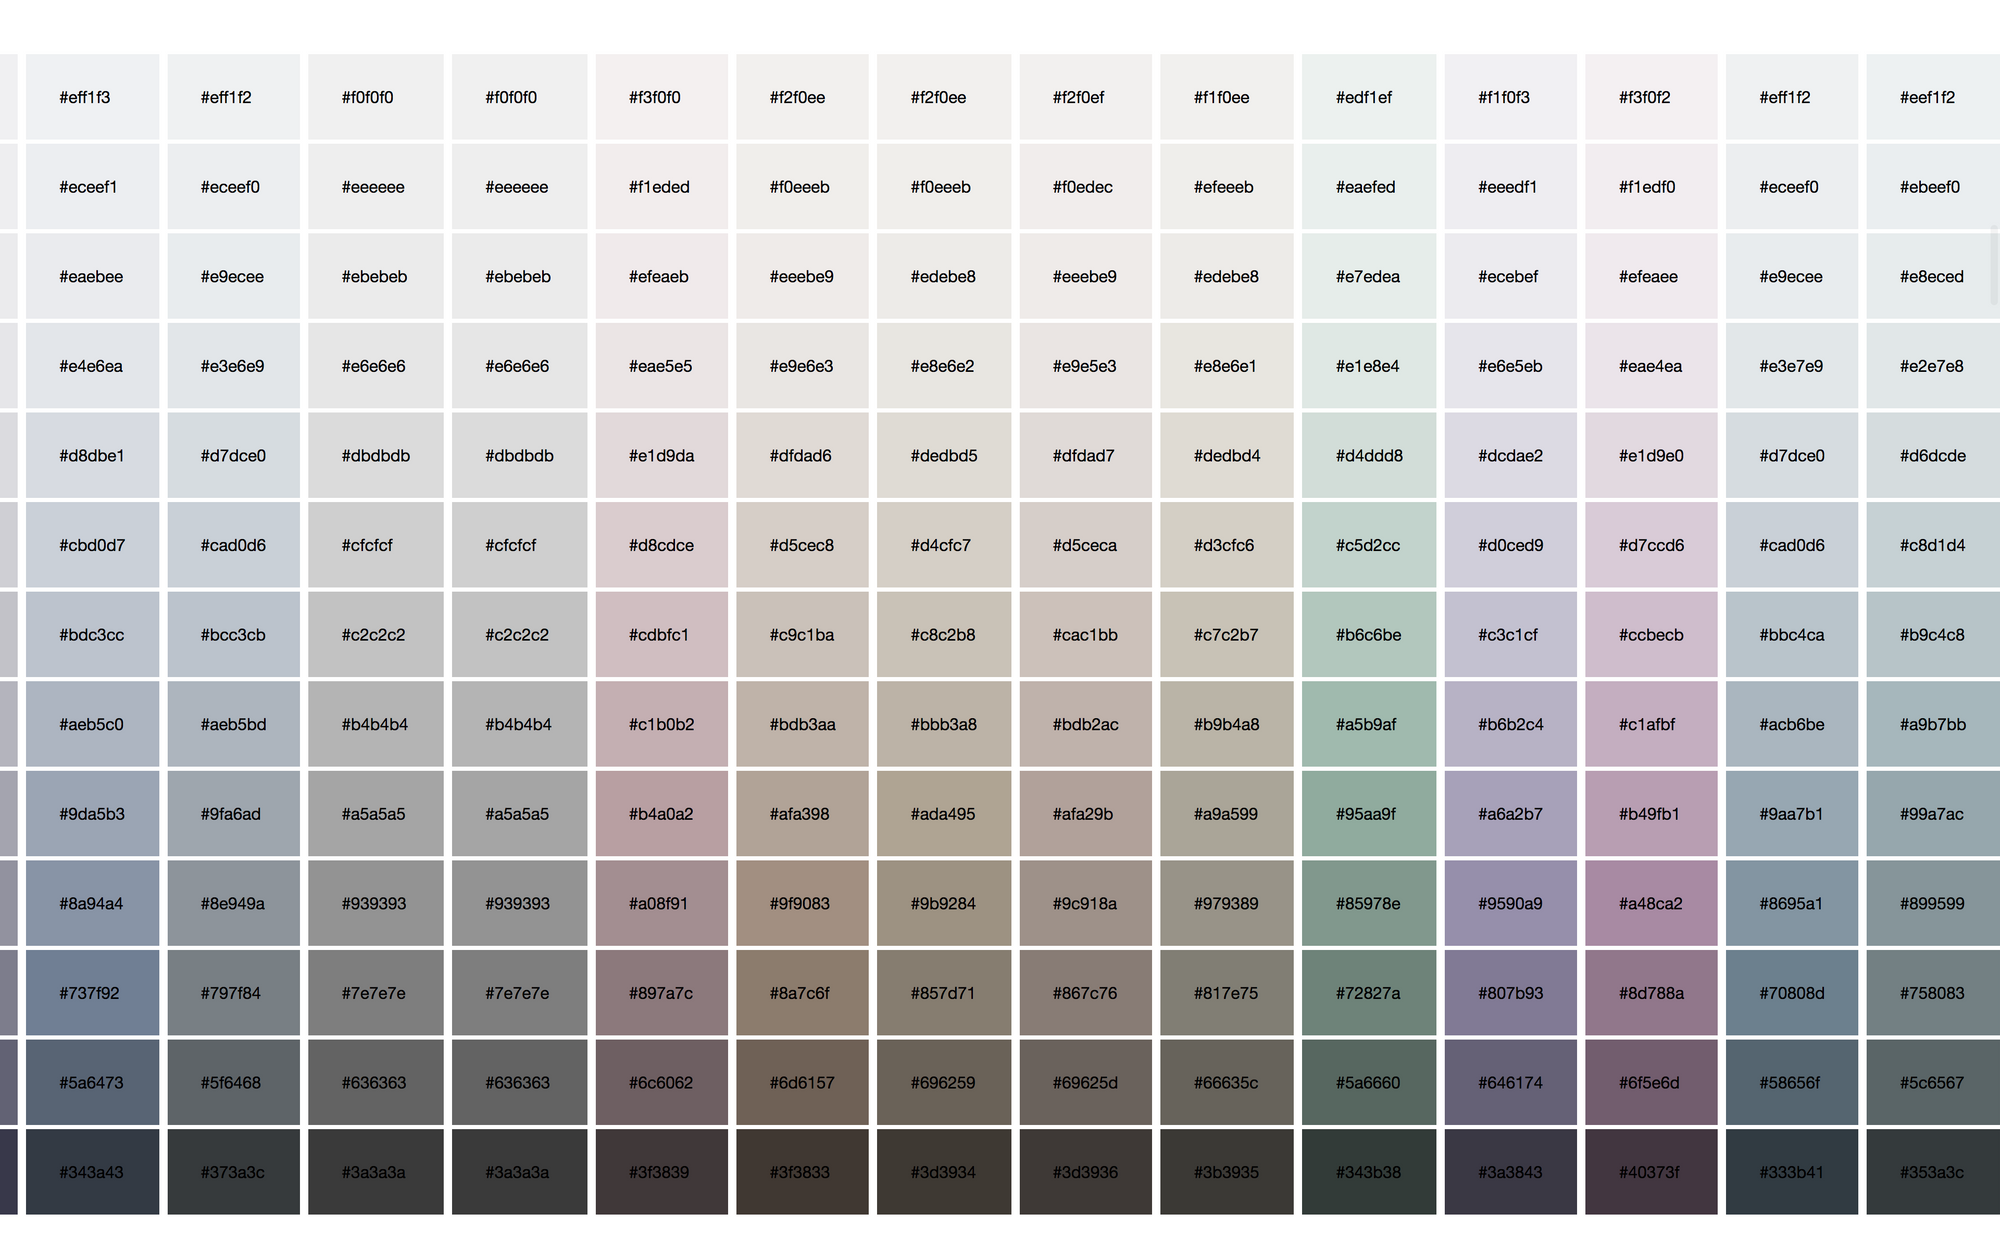
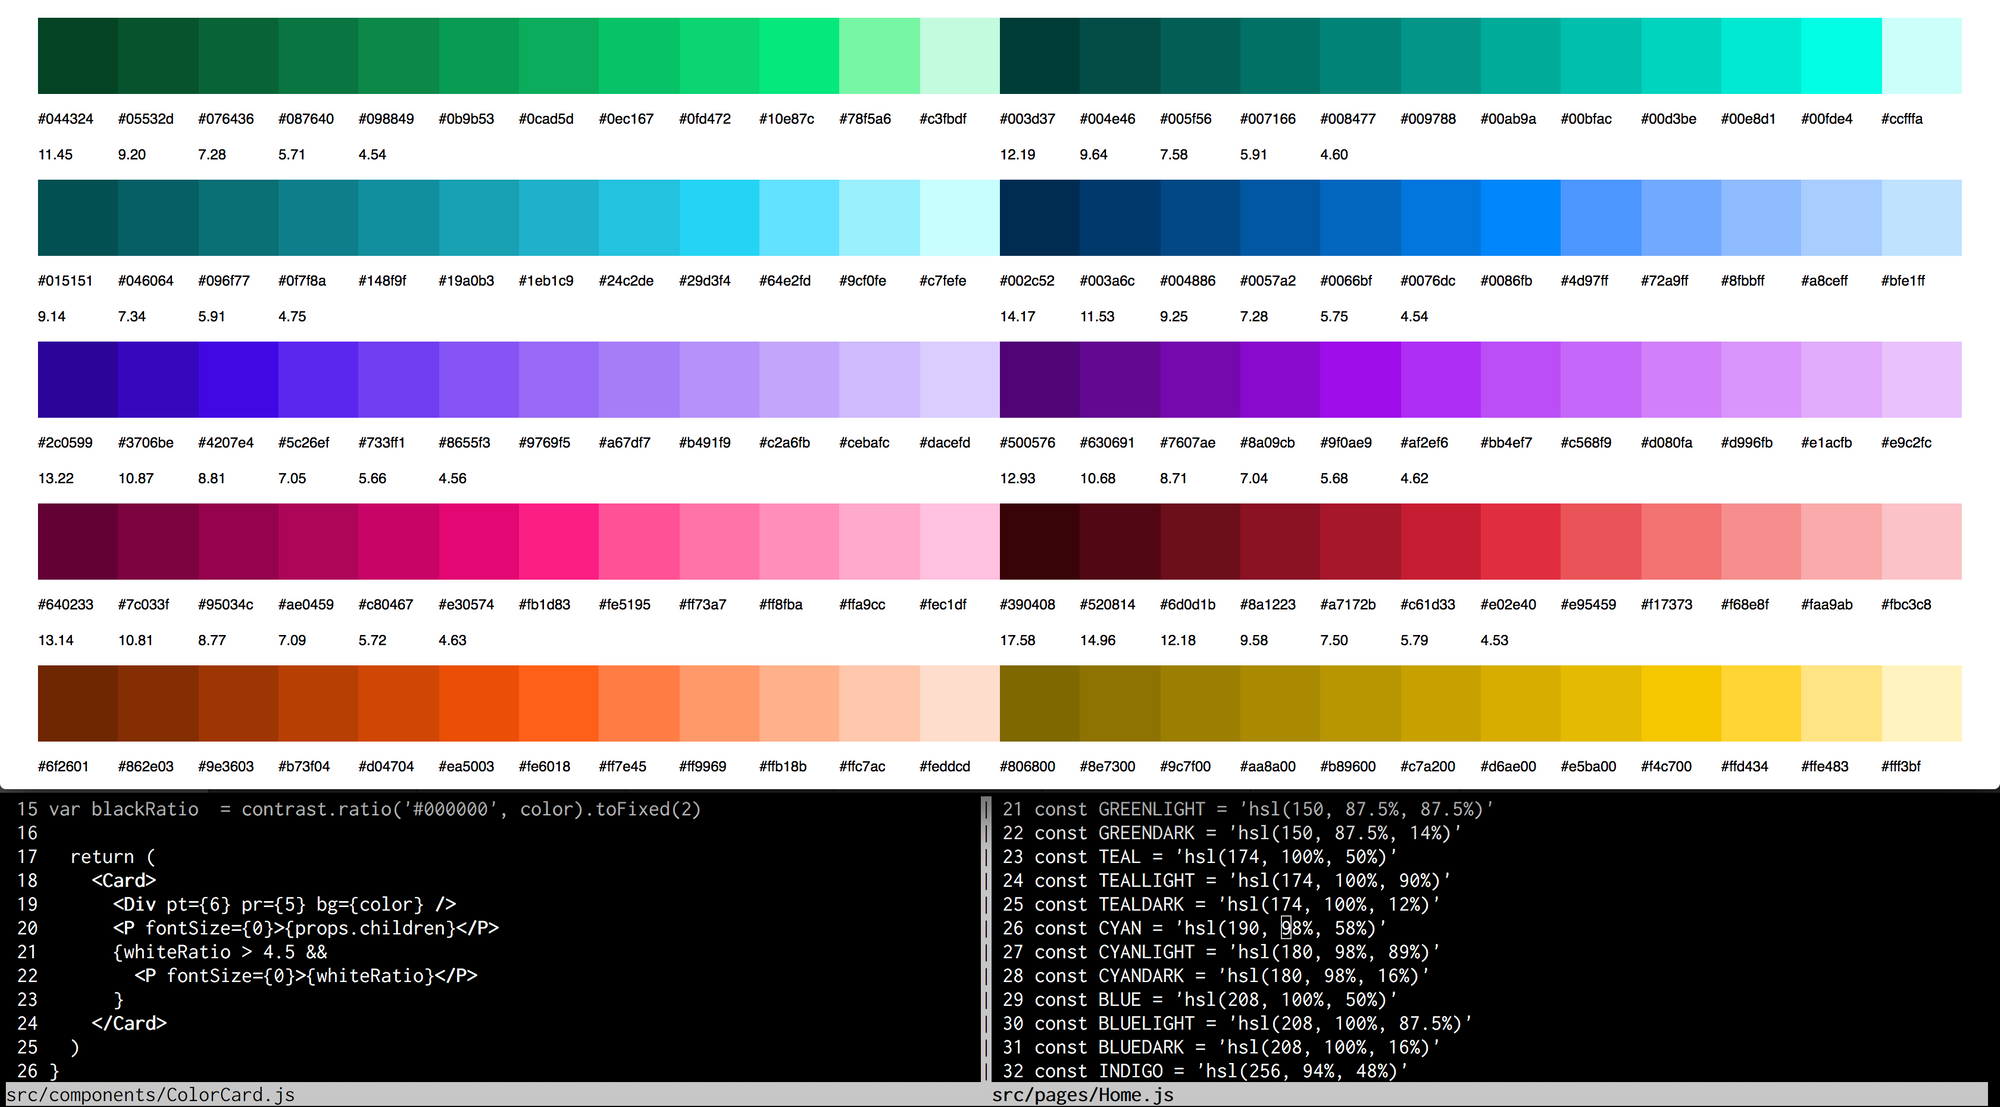
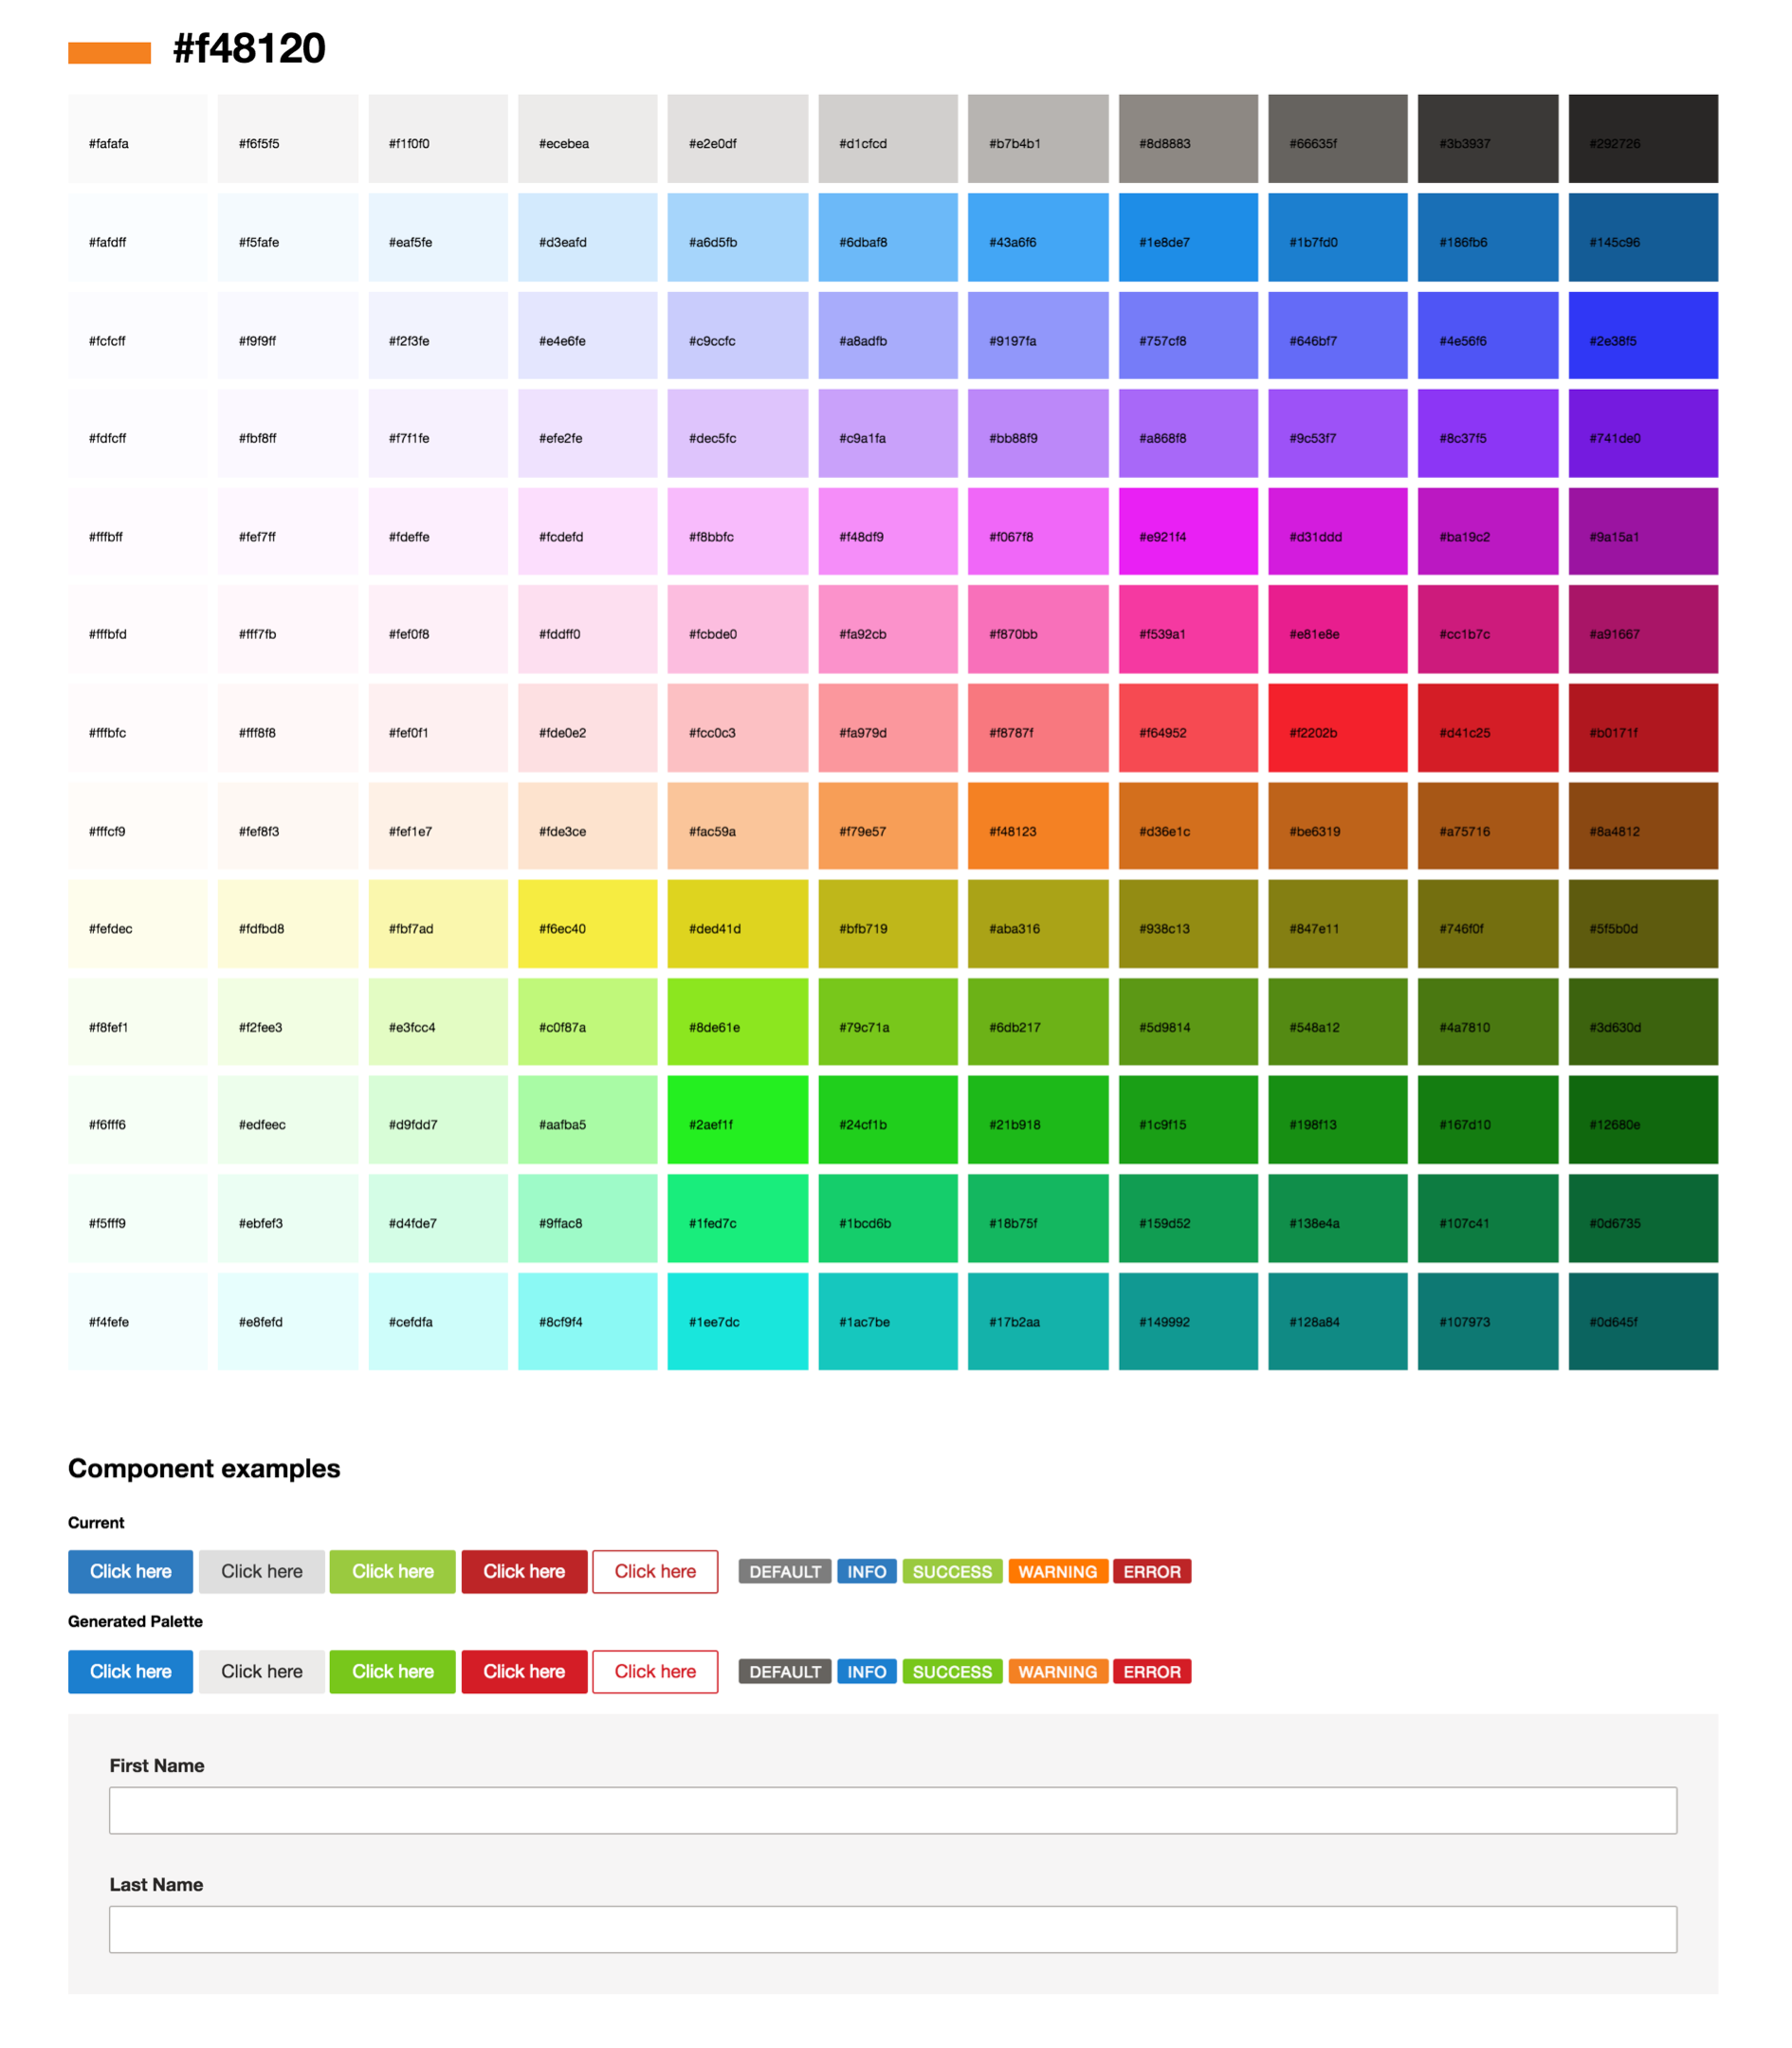
Generating different color palettes makes you confront a basic question. How do you tell if a palette is good? Are some palettes better than others? In an effort to answer this question we constructed various feedback loops to help us evaluate palettes as quickly as possible. We tried a few methods to stress test a palette. At first we attempted to grab the “nearest color” for a bunch of our common UI colors. This wasn't always helpful as sometimes you actually want the step above or below the closest existing color. But it was helpful to visualize for a few reasons.
Sometime during our exploration in this space, we stumbled across this tweet thread about building a palette for pixel art. There are a lot of places web and product designers can draw inspiration from game designers.
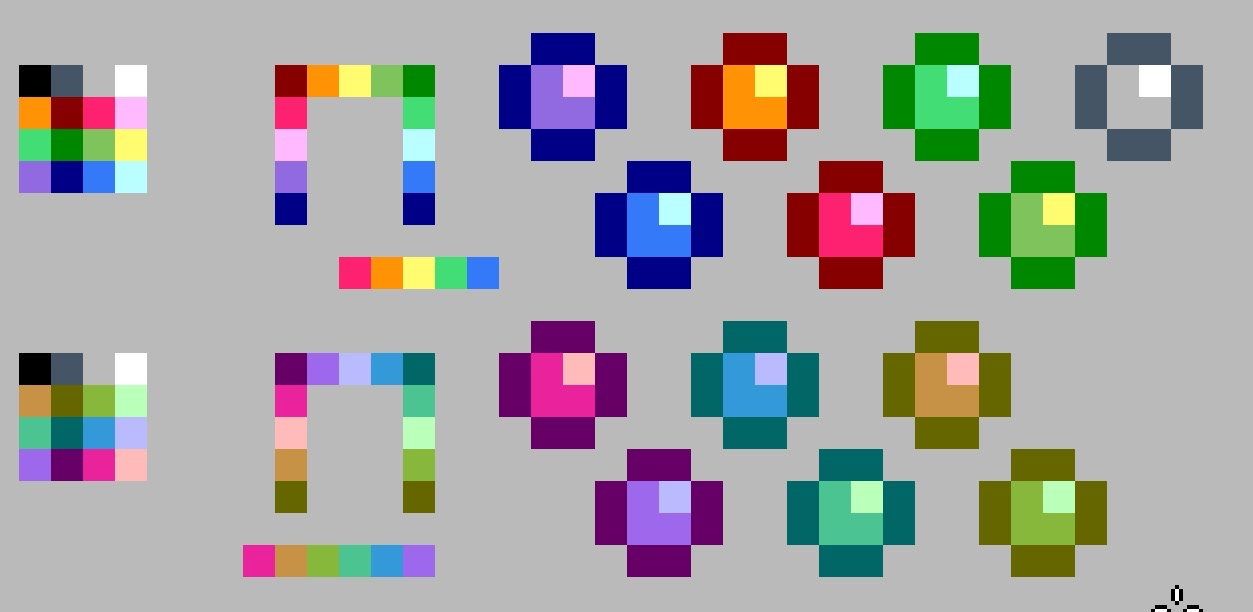
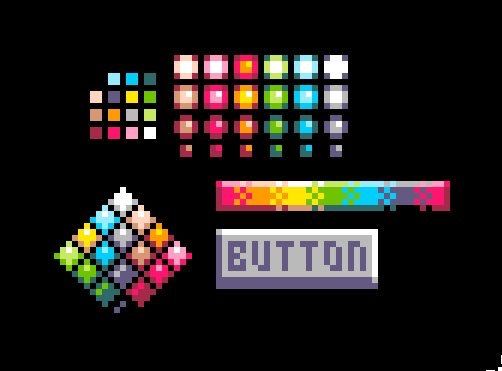
Here we see a similar concept where a number of different palettes are applied to the same component. This view shows us two things, the different ways a single palette can be applied to a sphere, and also the different aesthetics across color palettes.
It’s almost surprising that the default way to construct a color palette for apps and sites isn’t to build it while previewing its application against the most common UI patterns. As designers, there are a lot of consistent uses of color we could have baselines for. Many enterprise apps are centered around white background with blue as the primary color with mixtures of grays to add depth around cards and page sections. Red is often used for destructive actions like deleting some type of record. Gray for secondary actions. Maybe it’s an outline button with the primary color for secondary actions. Either way - the margins between the patterns aren’t that large in the grand scheme of things.
Consider the use case of designing UI while the palette or usage of color hasn't been established. Given a single palette, you might want to experiment with applying that palette in a variety of ways that will output a wide variety of aesthetics. Alternatively you may need to test out several different palettes. These are two different modes of exploration that can be extremely time consuming to work through . It can be non-trivial to keep an in progress design synced with several different options for color application, even with the best use of layer comps or symbols.
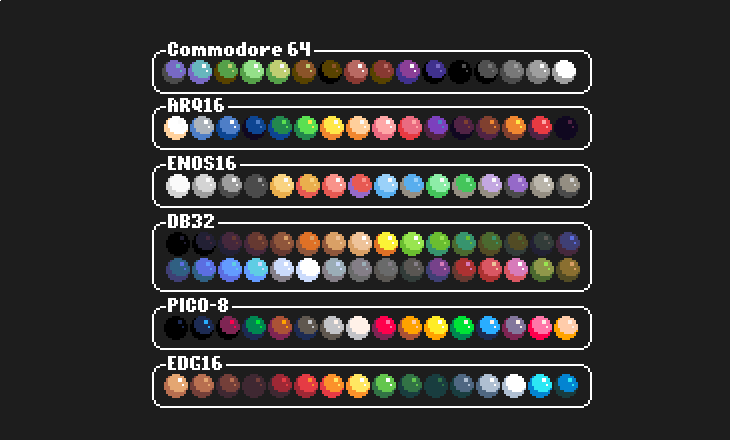
How do we visualize the various ways a palette will look when applied to an interface? Here are examples of how palettes are shown on a palette list for pixel artists.
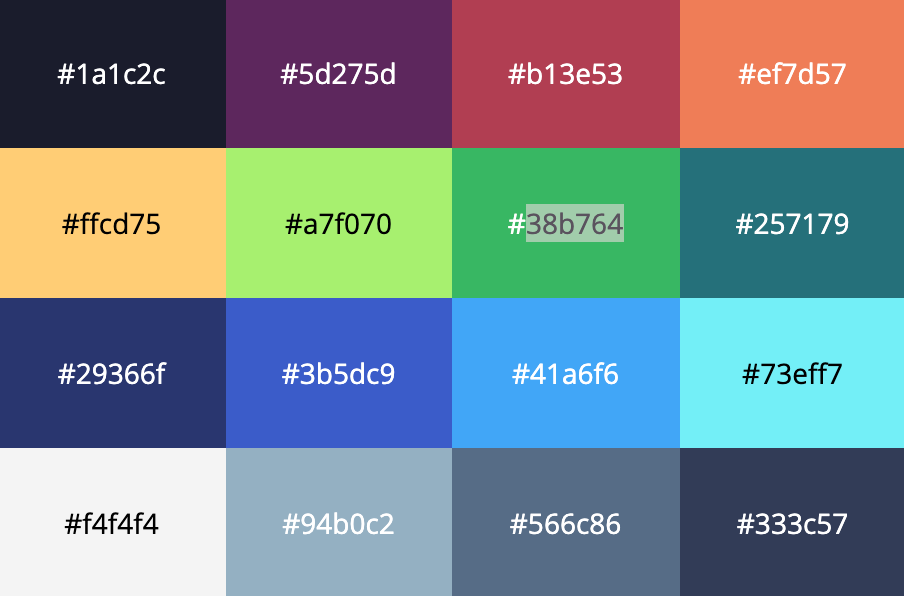


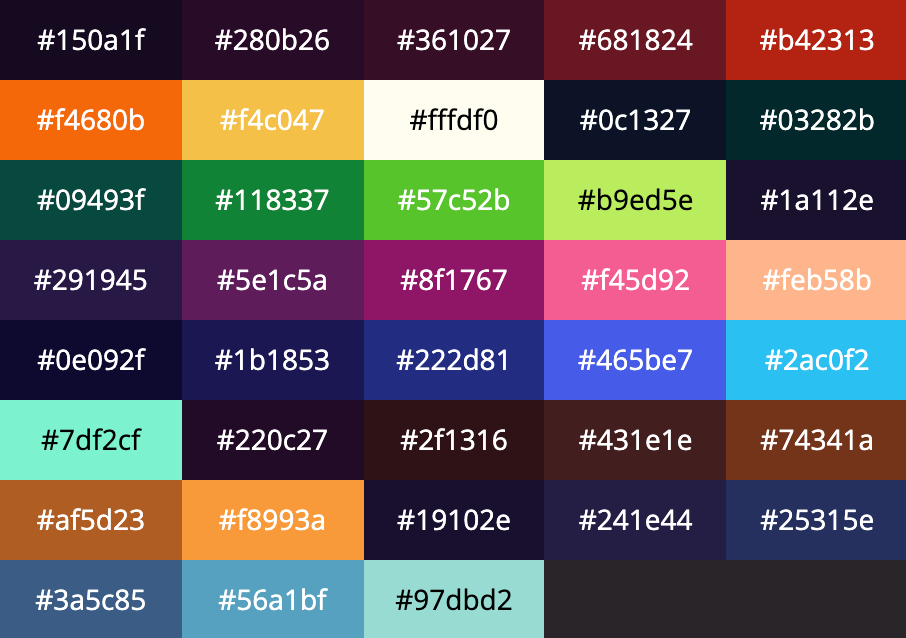
One method of visualization is to define a common set of primitive ui elements and show each one of them with a single set of colors applied. In isolation this can be helpful. This mode would make it easy to vet a single combination of colors and which ui elements it might be best applied to.
Alternatively we might want to see a composed interface with the closest colors from the palette applied. Consider a set of buttons that includes red, green, blue, and gray button styles. Seeing all of these together can help us visualize the relative nature of these buttons side by side. Given a baseline palette for common UI, we could swap to a new palette and replace each color with the "closest" color. This isn't always a full-proof solution as there are many edge cases to cover. e.g. what happens when replacing a palette of 134 colors with a palette of 24 colors? Even still, this could allow us to quickly take a stab at automating how existing interfaces would change their appearance given a change to the underlying system. Whether locally or against a live site, this mode of working would allow for designers to view a color in multiple contets to truly asses its quality.
After moving on from the idea of generating a palette from a single color, we attempted to use our logo colors as well as our primary brand colors to drive the construction of modular scales. Our goal was to create a palette that would improve contrast for accessibility, stay true to our visual brand, work predictably for developers, work for data visualizations, and provide the ability to design visually balanced and attractive interfaces. No sweat.

While we knew going in we might not use every step in every hue, we wanted full coverage across the spectrum so that each hue had a consistent optical difference between each step. We also had no idea which steps across which hues we were going to need just yet. As they would just be variables in a theme file it didn’t add any significant code footprint to expose the full generated palette either.
One of the more difficult parts, was deciding on a number of steps for the scales. This would allow us to edit the palette in the future to a variety of aesthetics and swap the palette out at the theme level without needing to update anything else.
In the future if when we did need to augment the available colors, we could edit the entire palette instead of adding a one-off addition as we had found this was a difficult way to work over time. In addition to our primary brand colors we also explored adding scales for yellow / gold, violet, teal as well as a gray scale.
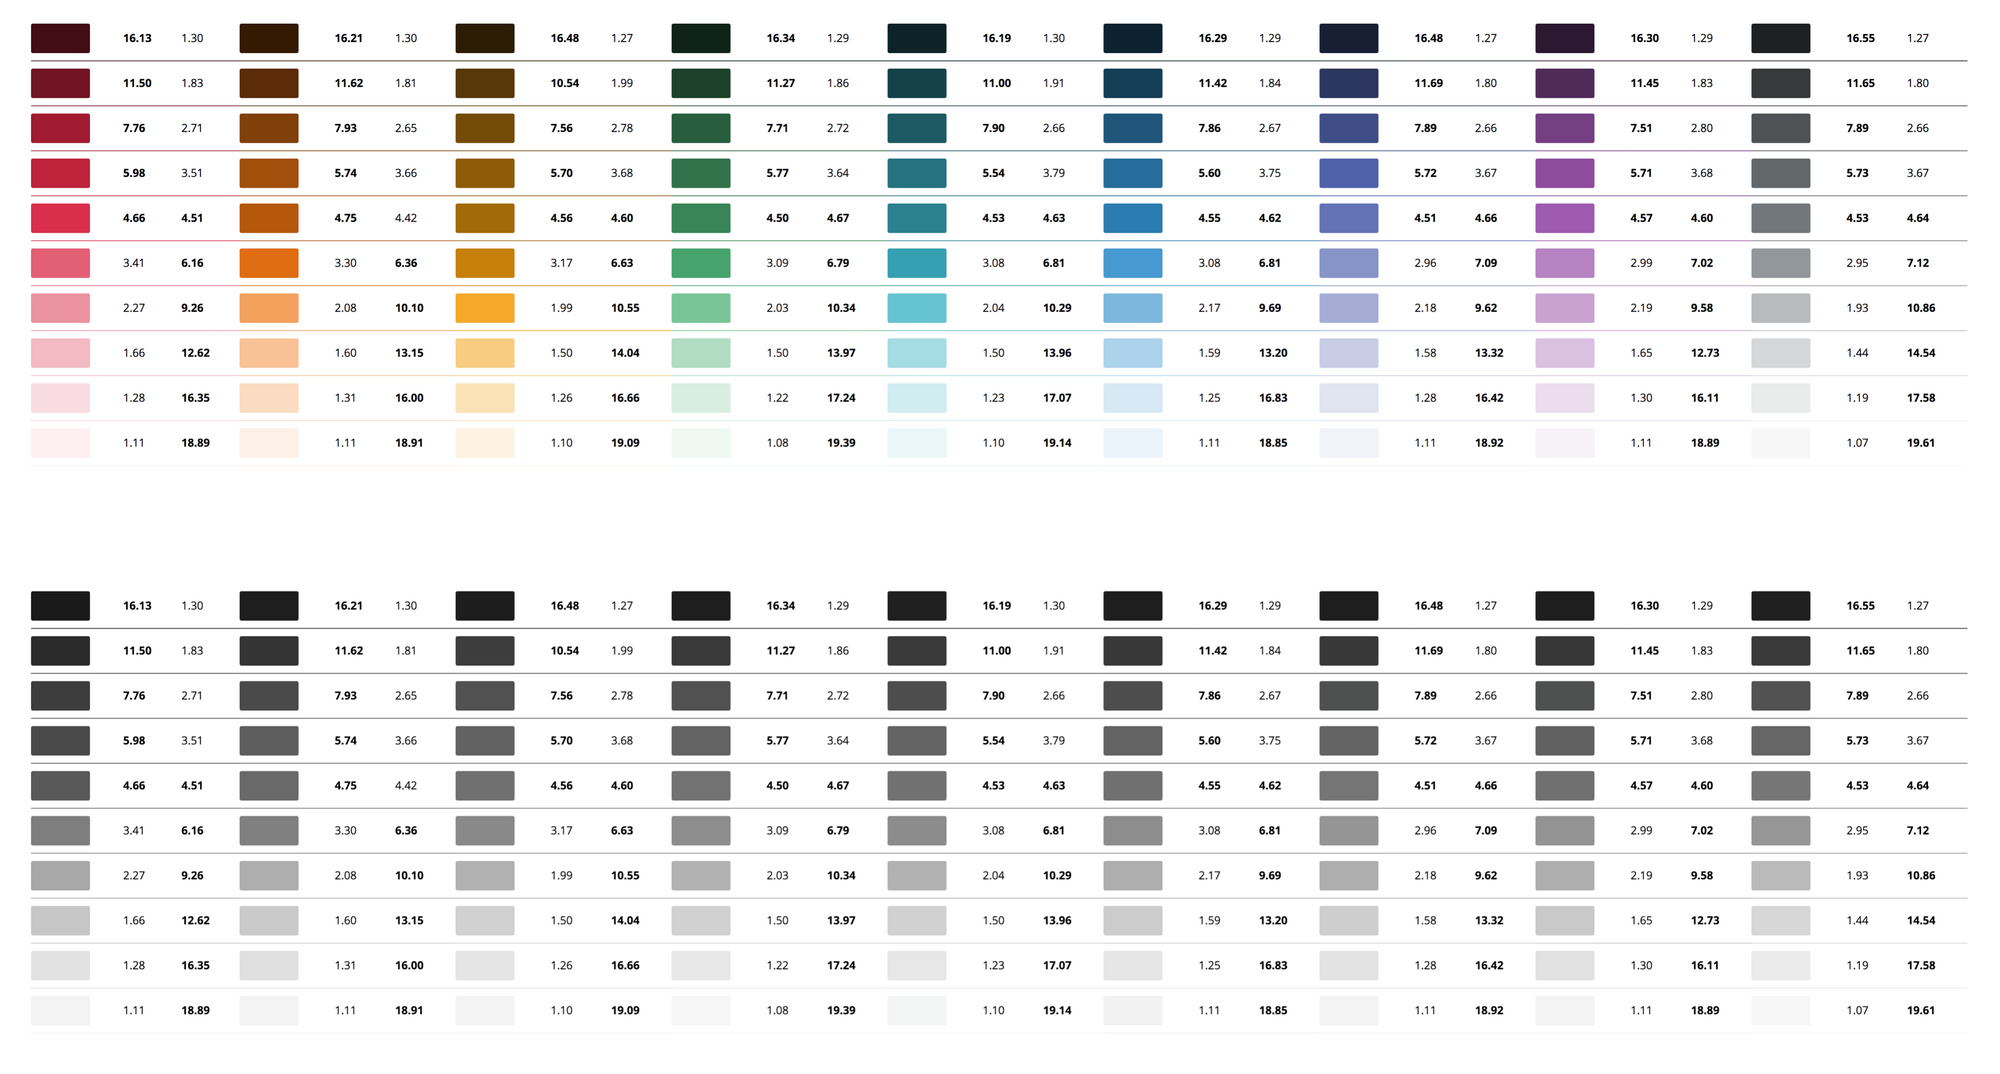
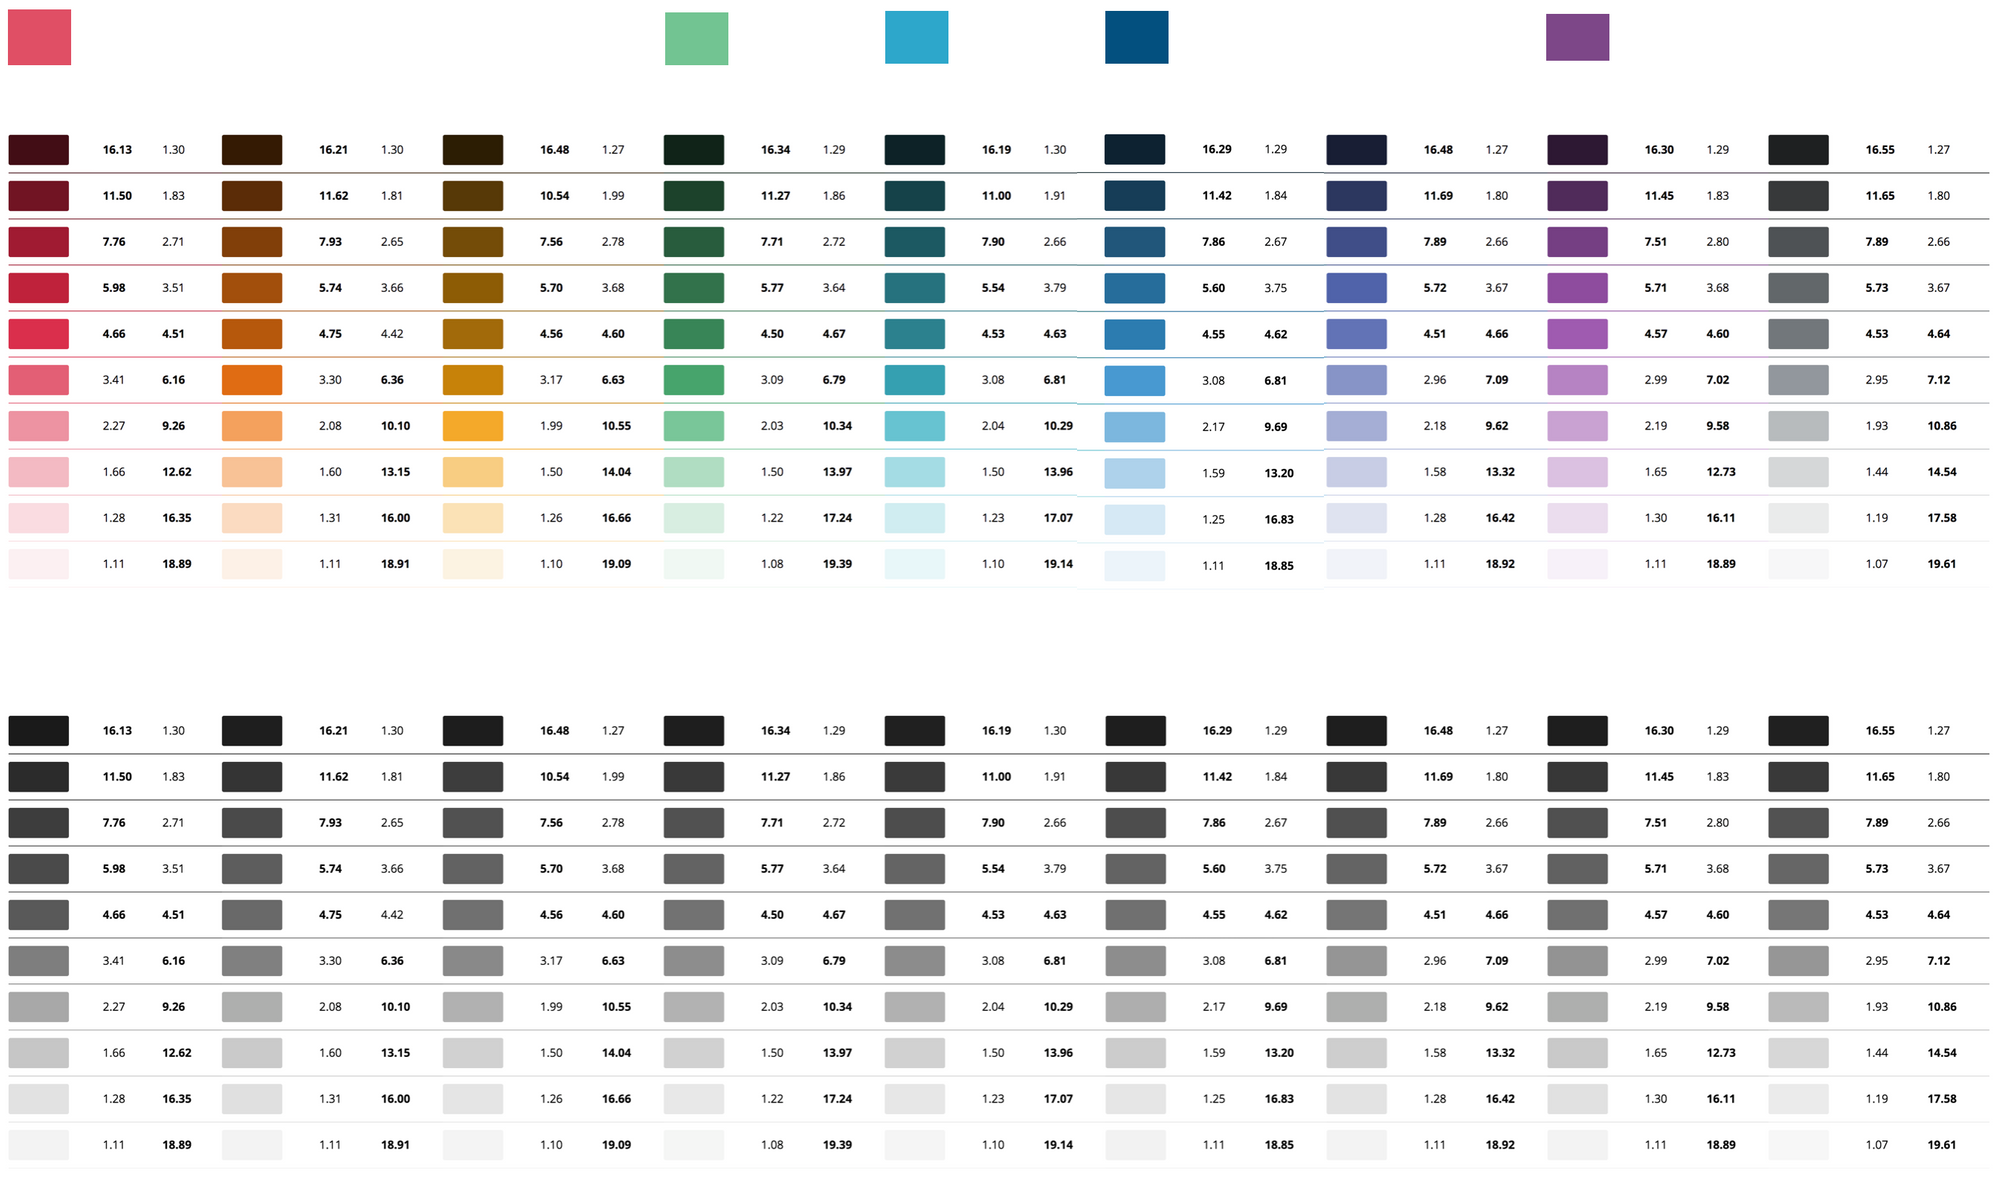
The first interface we built for this work was to output all of the scales vertically, with their contrast scores with both white and black on the right hand side. To aid scannability we bolded the values that were above the 4.5 threshold. As we edited the curves, we could see how the contrast ratios were affected at each step. Below you can see an early starting point before the scales were balanced. Red has 6 accessible combos with white, while yellow only has 1. We initially explored having the gray scale be larger than the others.
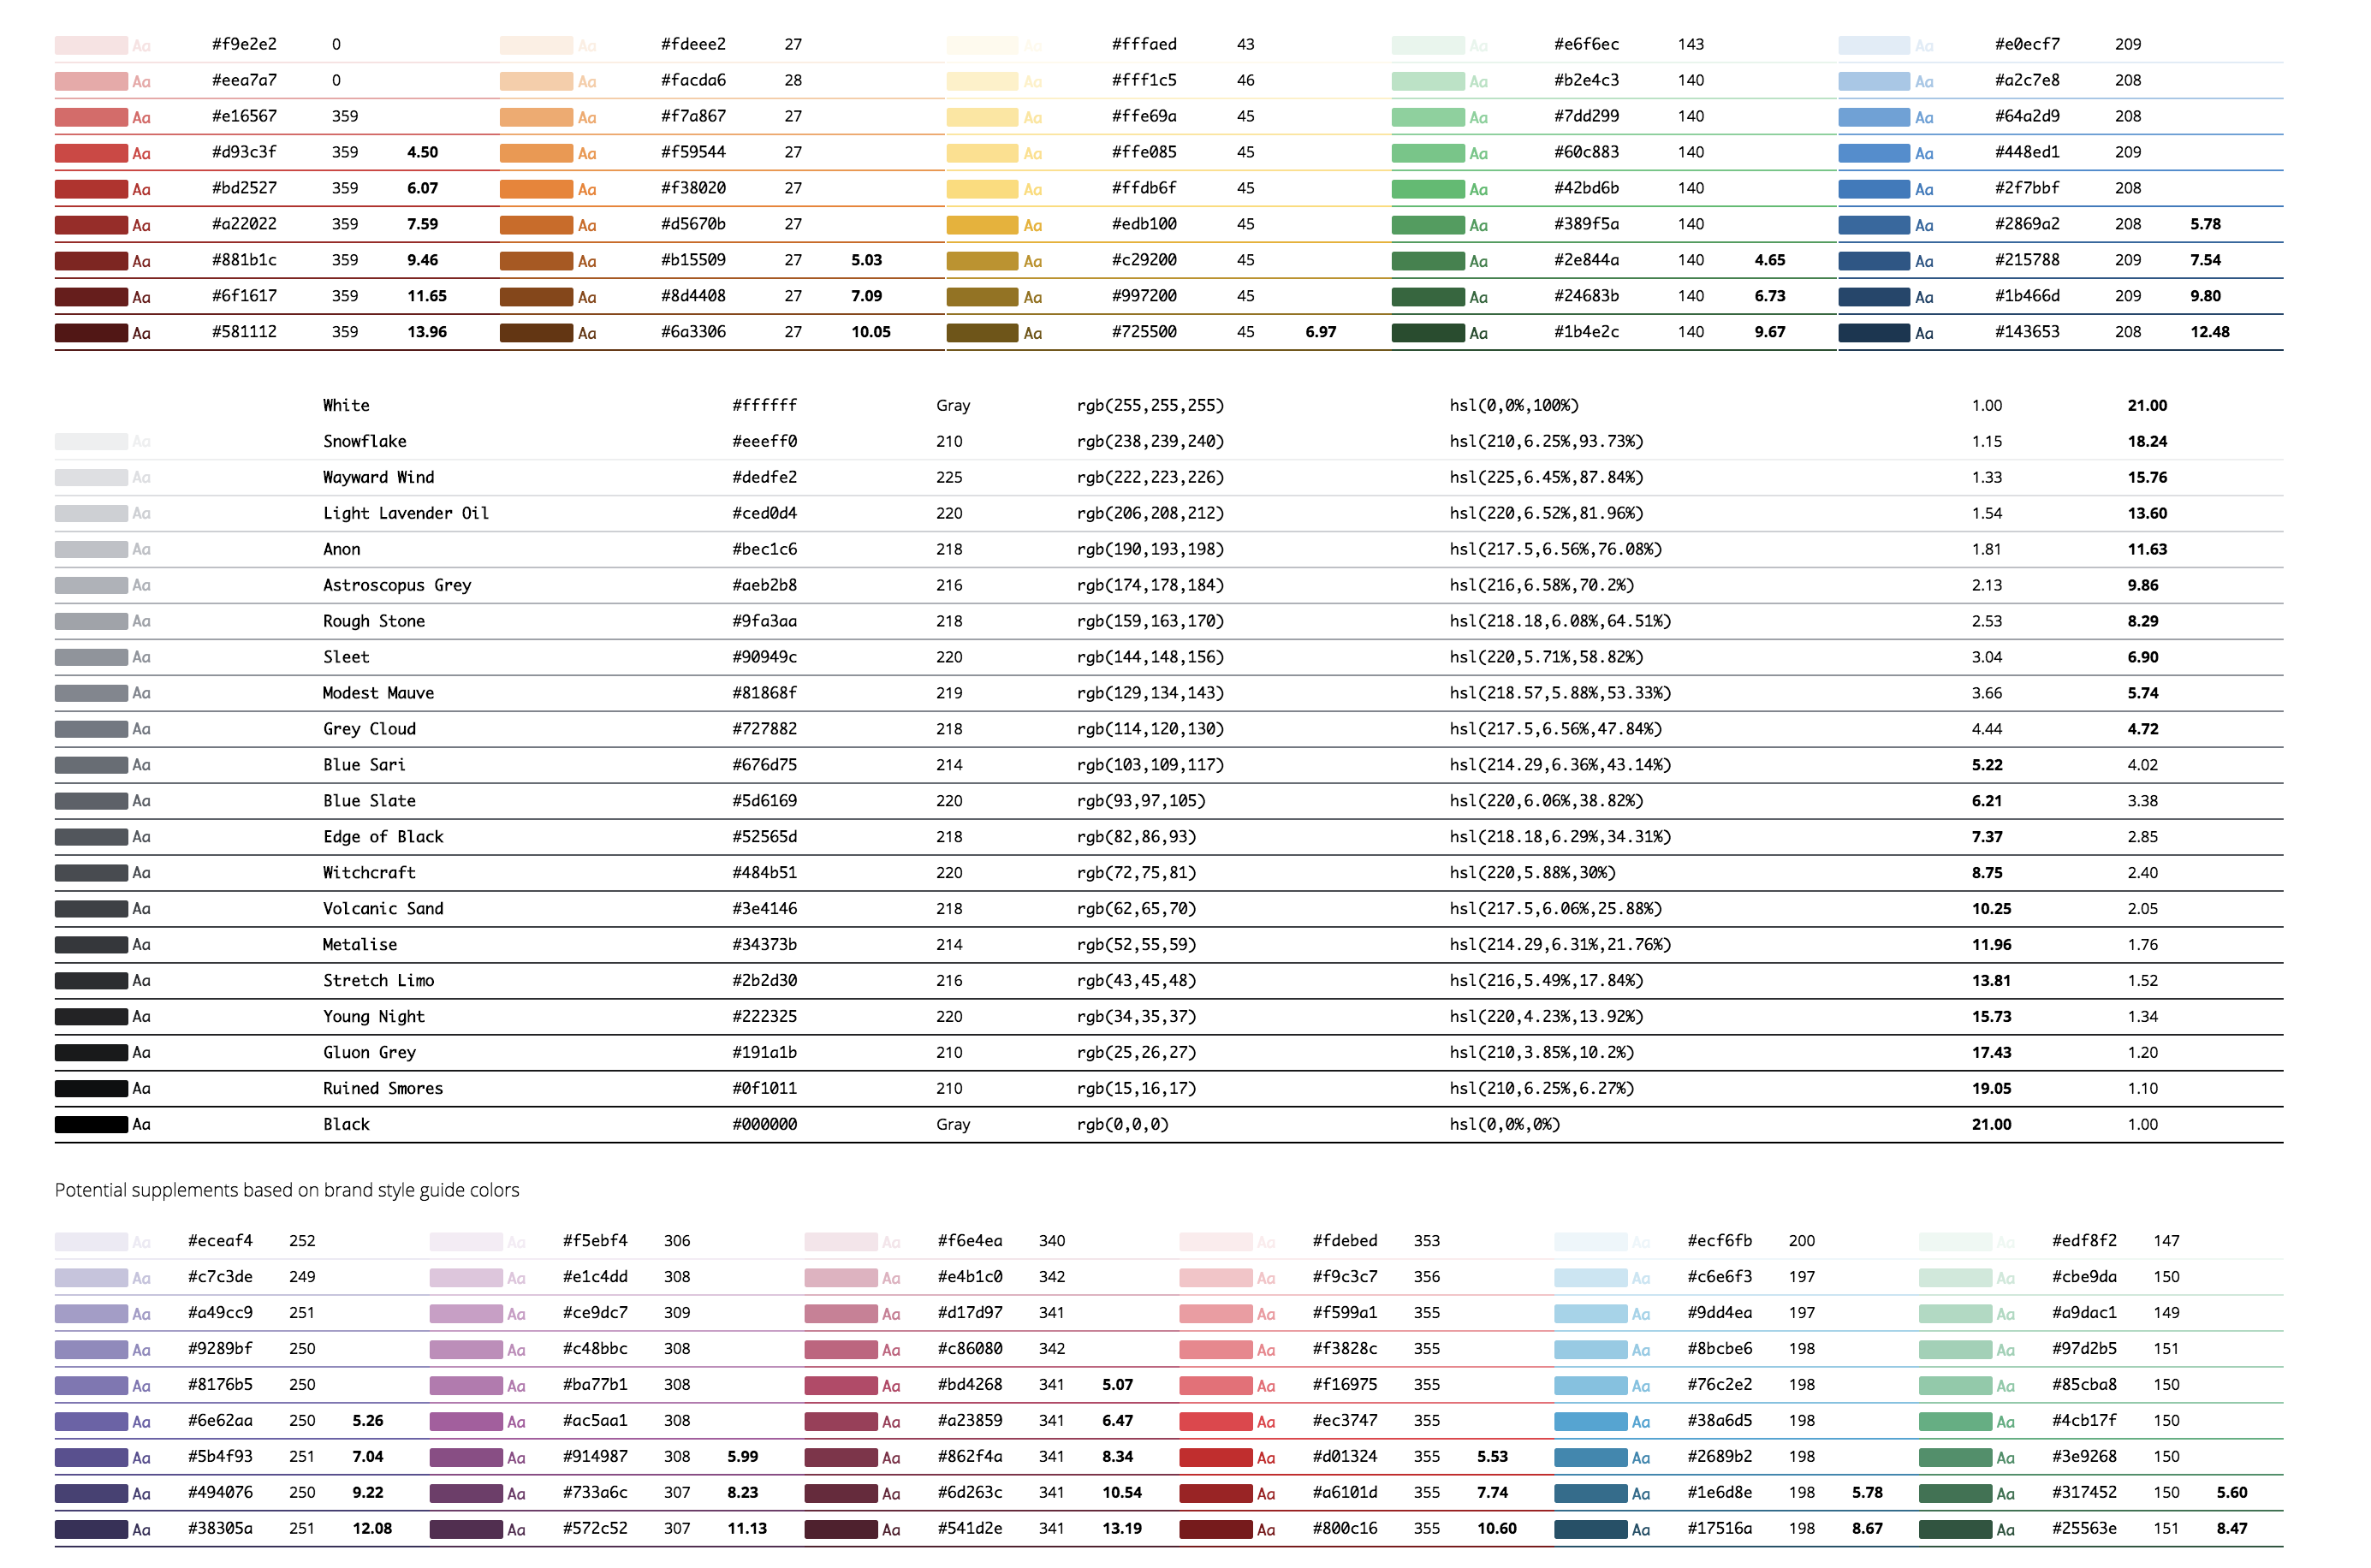
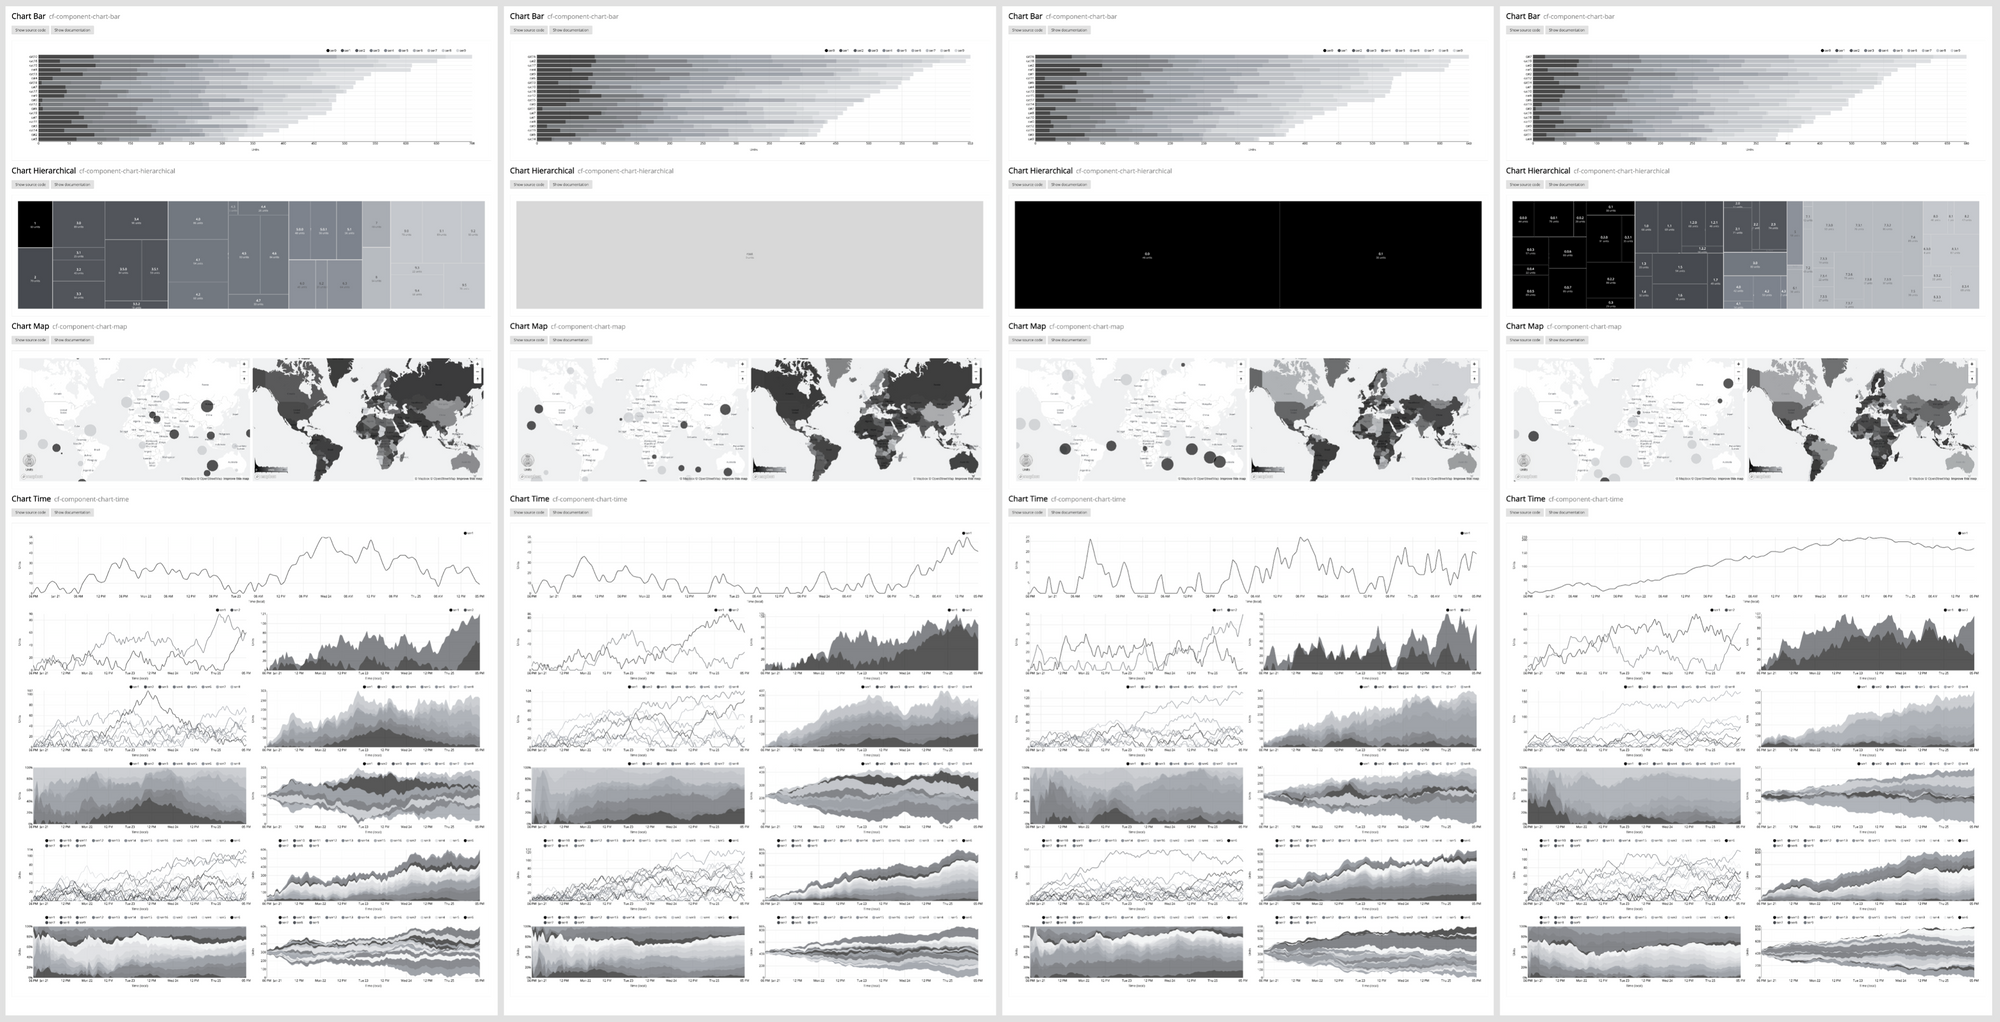
As both screen luminosity and ambient light can affect perception of color we developed on two monitors, one set to maximum and one set to minimum brightness levels. We also replicated the color scales with a grayscale filter immediately below to help illustrate visual contrast between steps AND across hues. Bouncing back and forth between the grayscale and saturated version of the scale serves as a great baseline reference. We found that going beyond 10 steps made it difficult to keep enough contrast between each step to keep them distinguishable from one another.

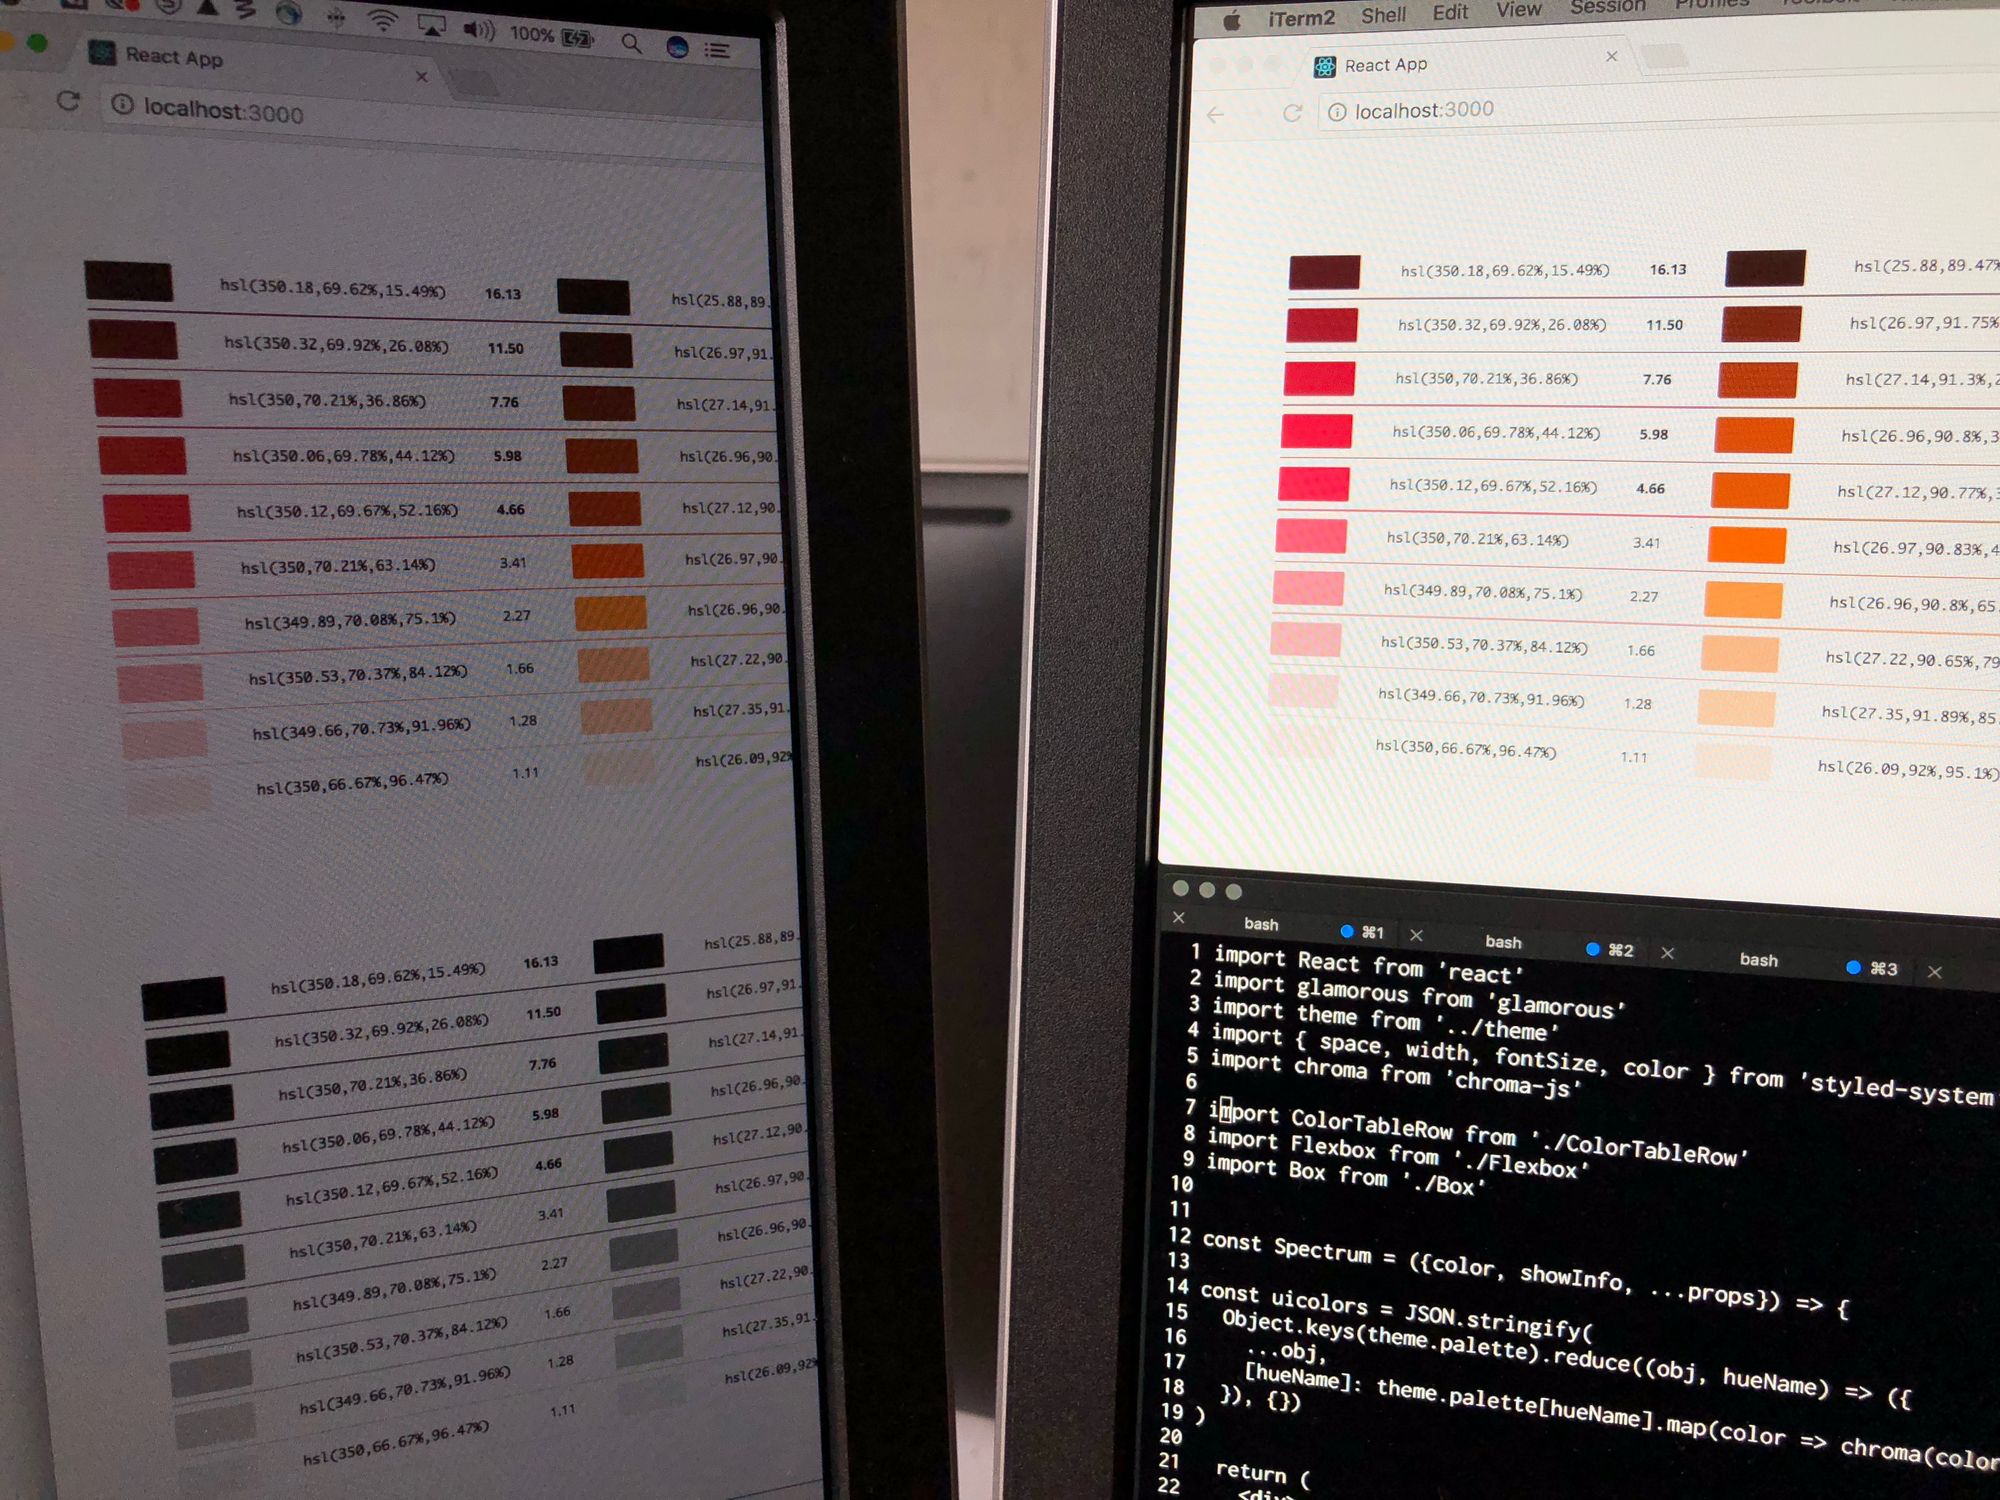
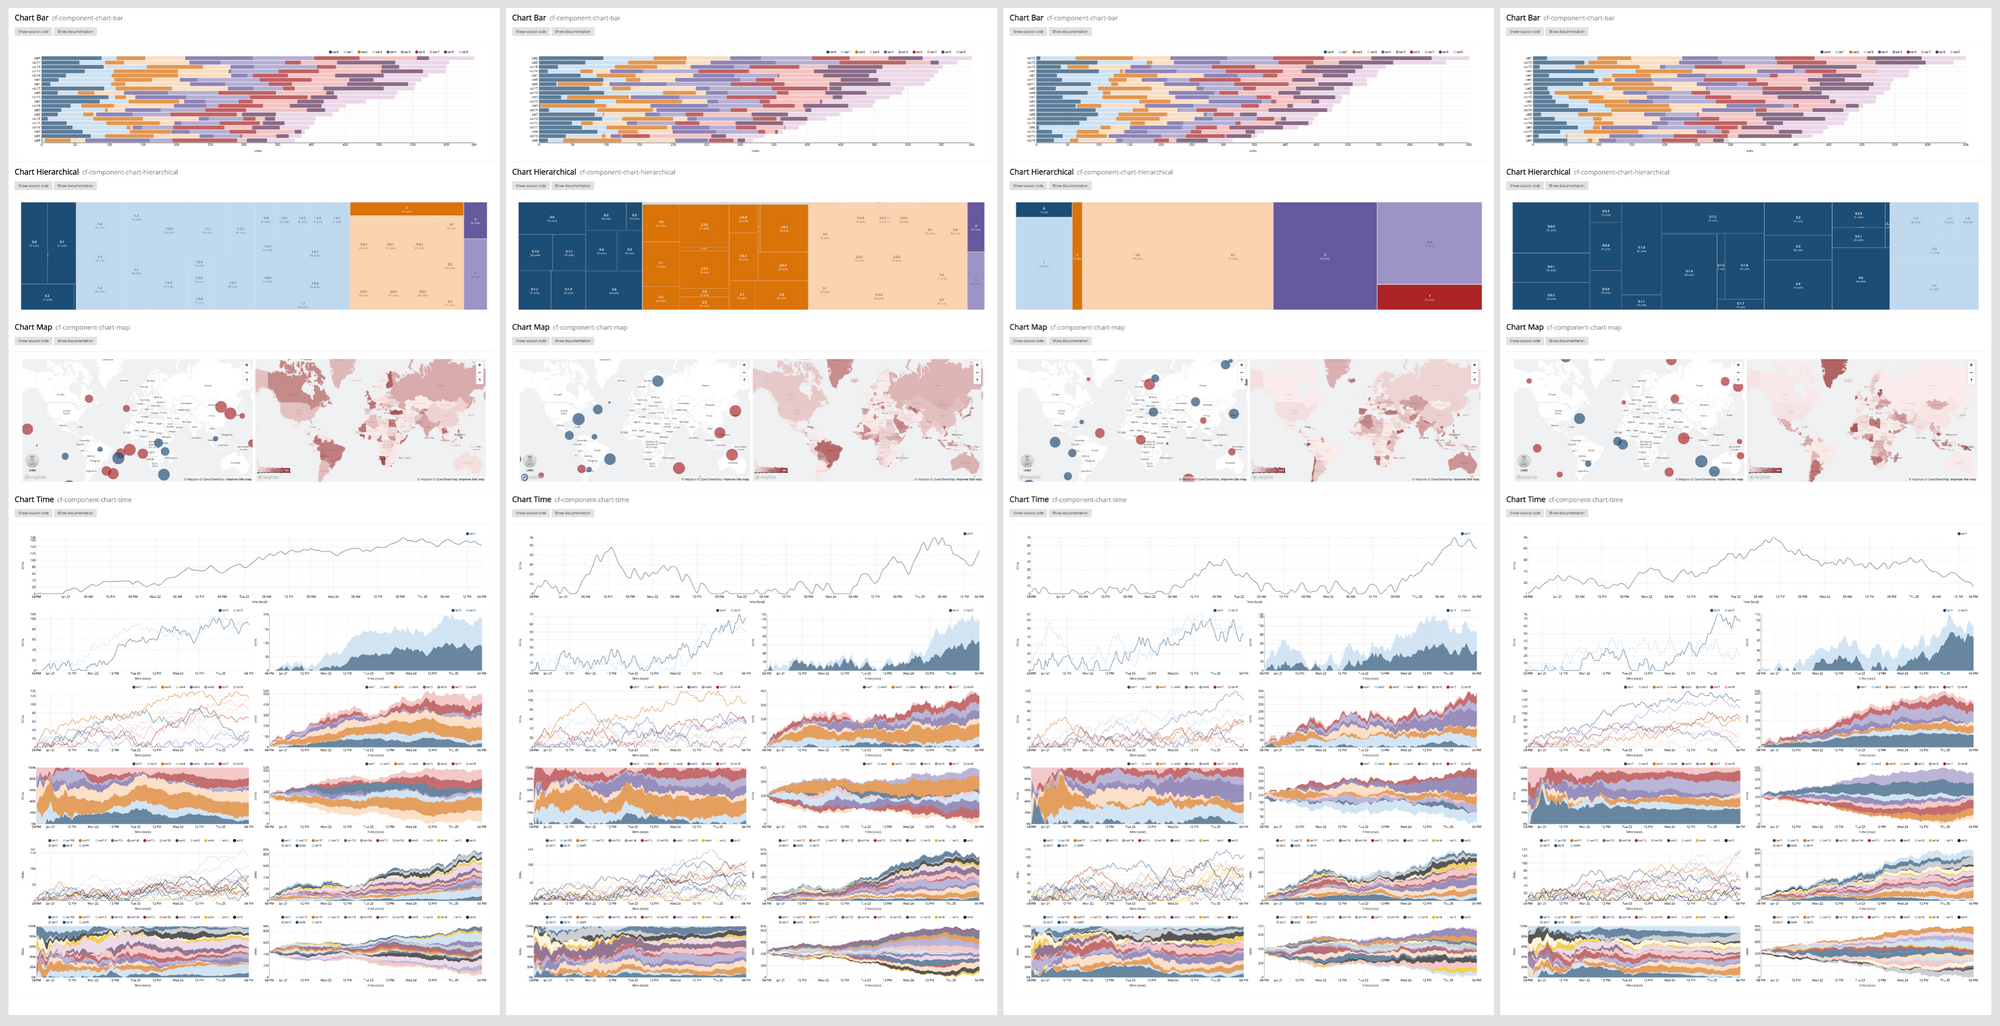
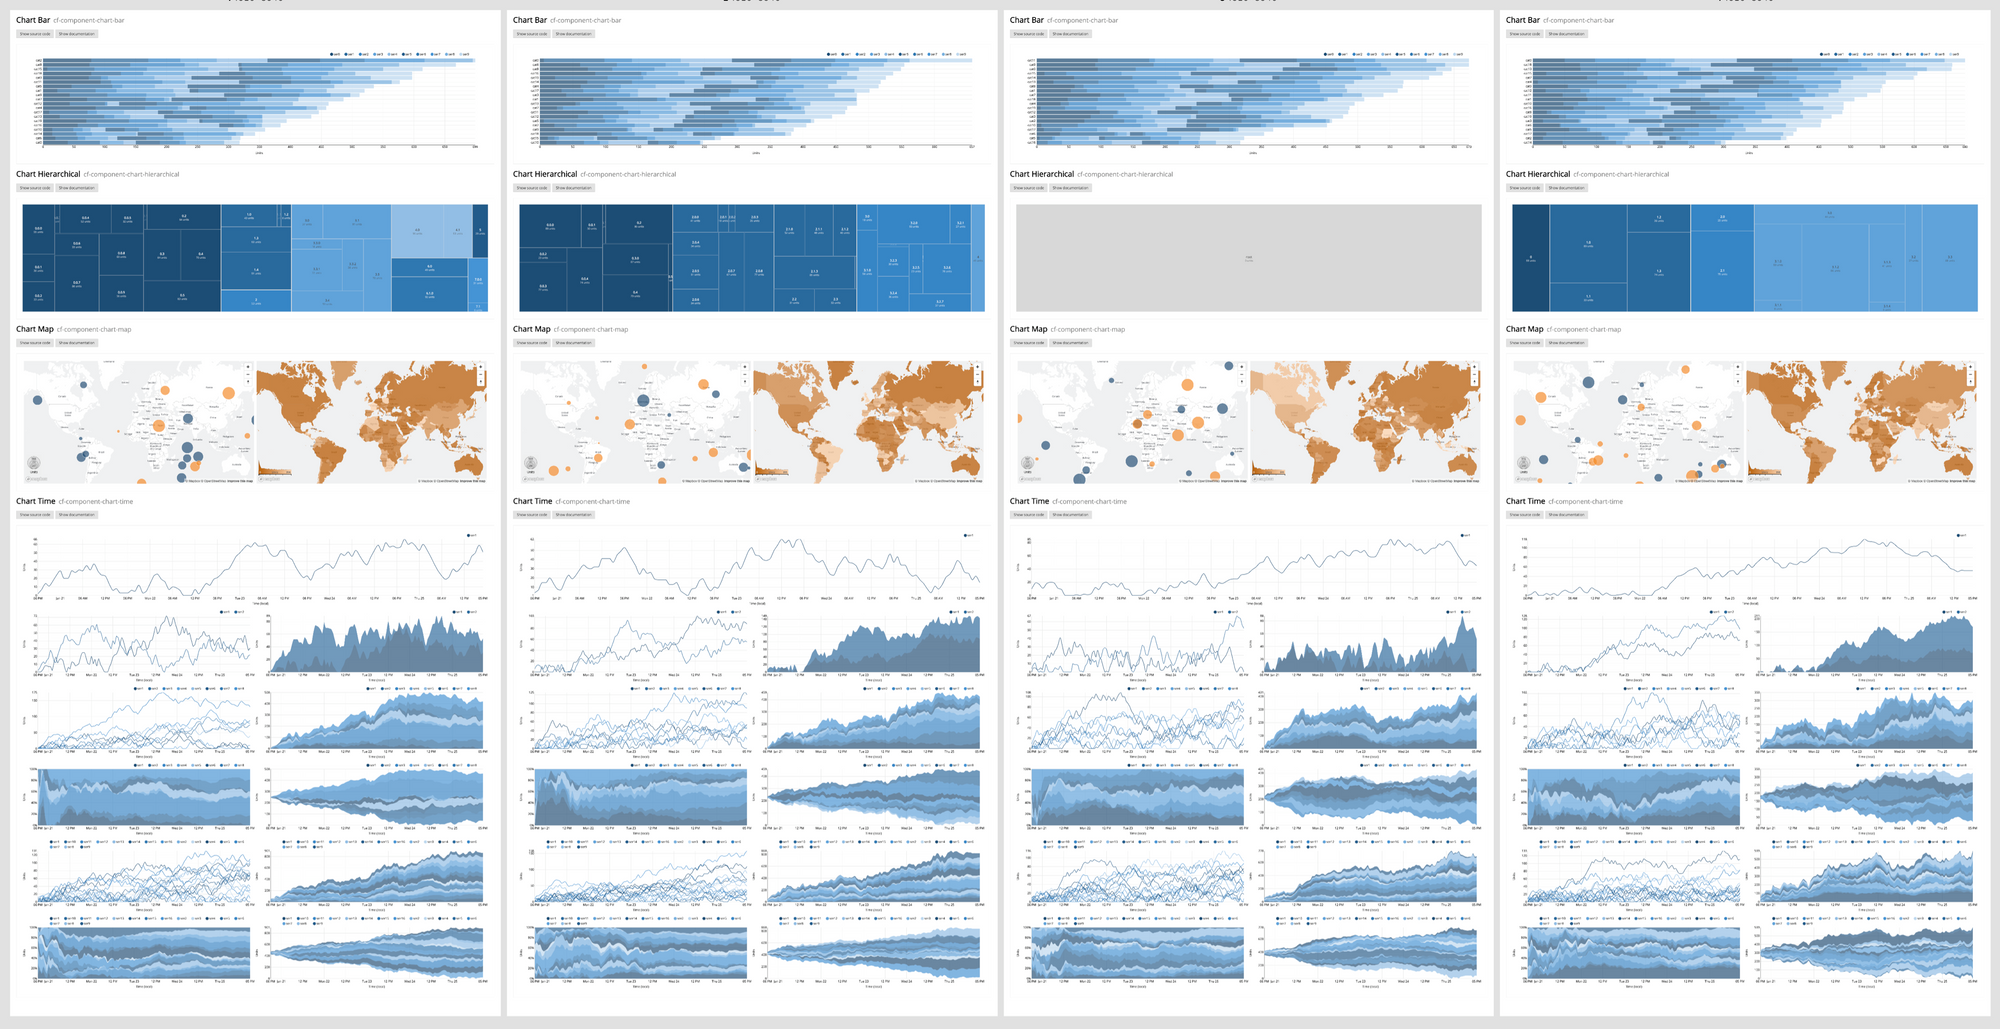
Taking a page from our game design friends - as we were balancing the scales and exploring how many steps we wanted in the scales, we were also stress testing the generated colors against various analytics components from our component library.
Our slightly random collection of grays had been a particular pain point as they appeared muddy in a number of places within our interface. For our new palette we used the slightest hint of blue to keep our grays consistent and just a bit off from being purely neutral.
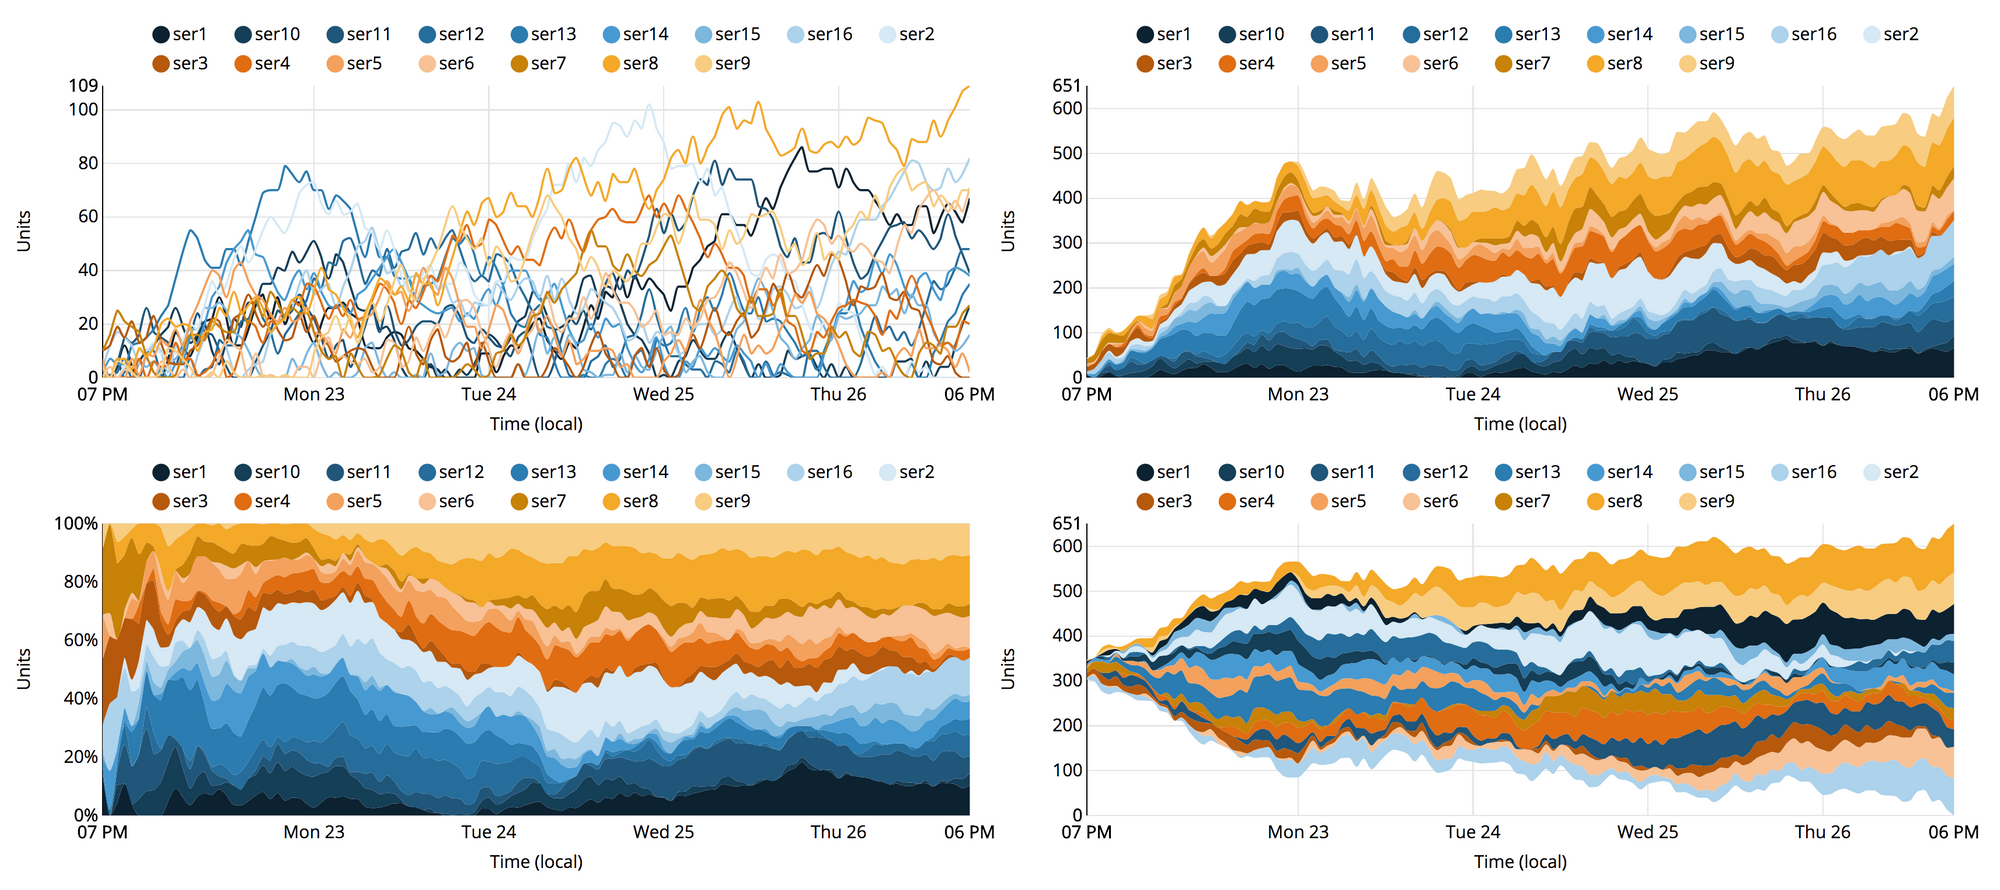
With a palette consisting of 90 colors, the amount of combinations and permutations that can be applied to data visualizations is vast and can result in a wide variety of aesthetic directions. The same palette applied to both line and bar charts with different data sets can look substantially different, enough that they might not be distinguishable as being the exact same palette. Working with some of our engineering counterparts, we built a pipeline that would put up the same components rendered against different data sets, to simulate the various shapes and sizes the graph elements would appear in. This allowed us to rapidly test the appearance of different palettes. This workflow gave us amazing insights into how a palette would look in our interface. No matter how many hours we spent staring at a palette, we couldn't get an accurate sense of how the colors would look when composed within an interface.
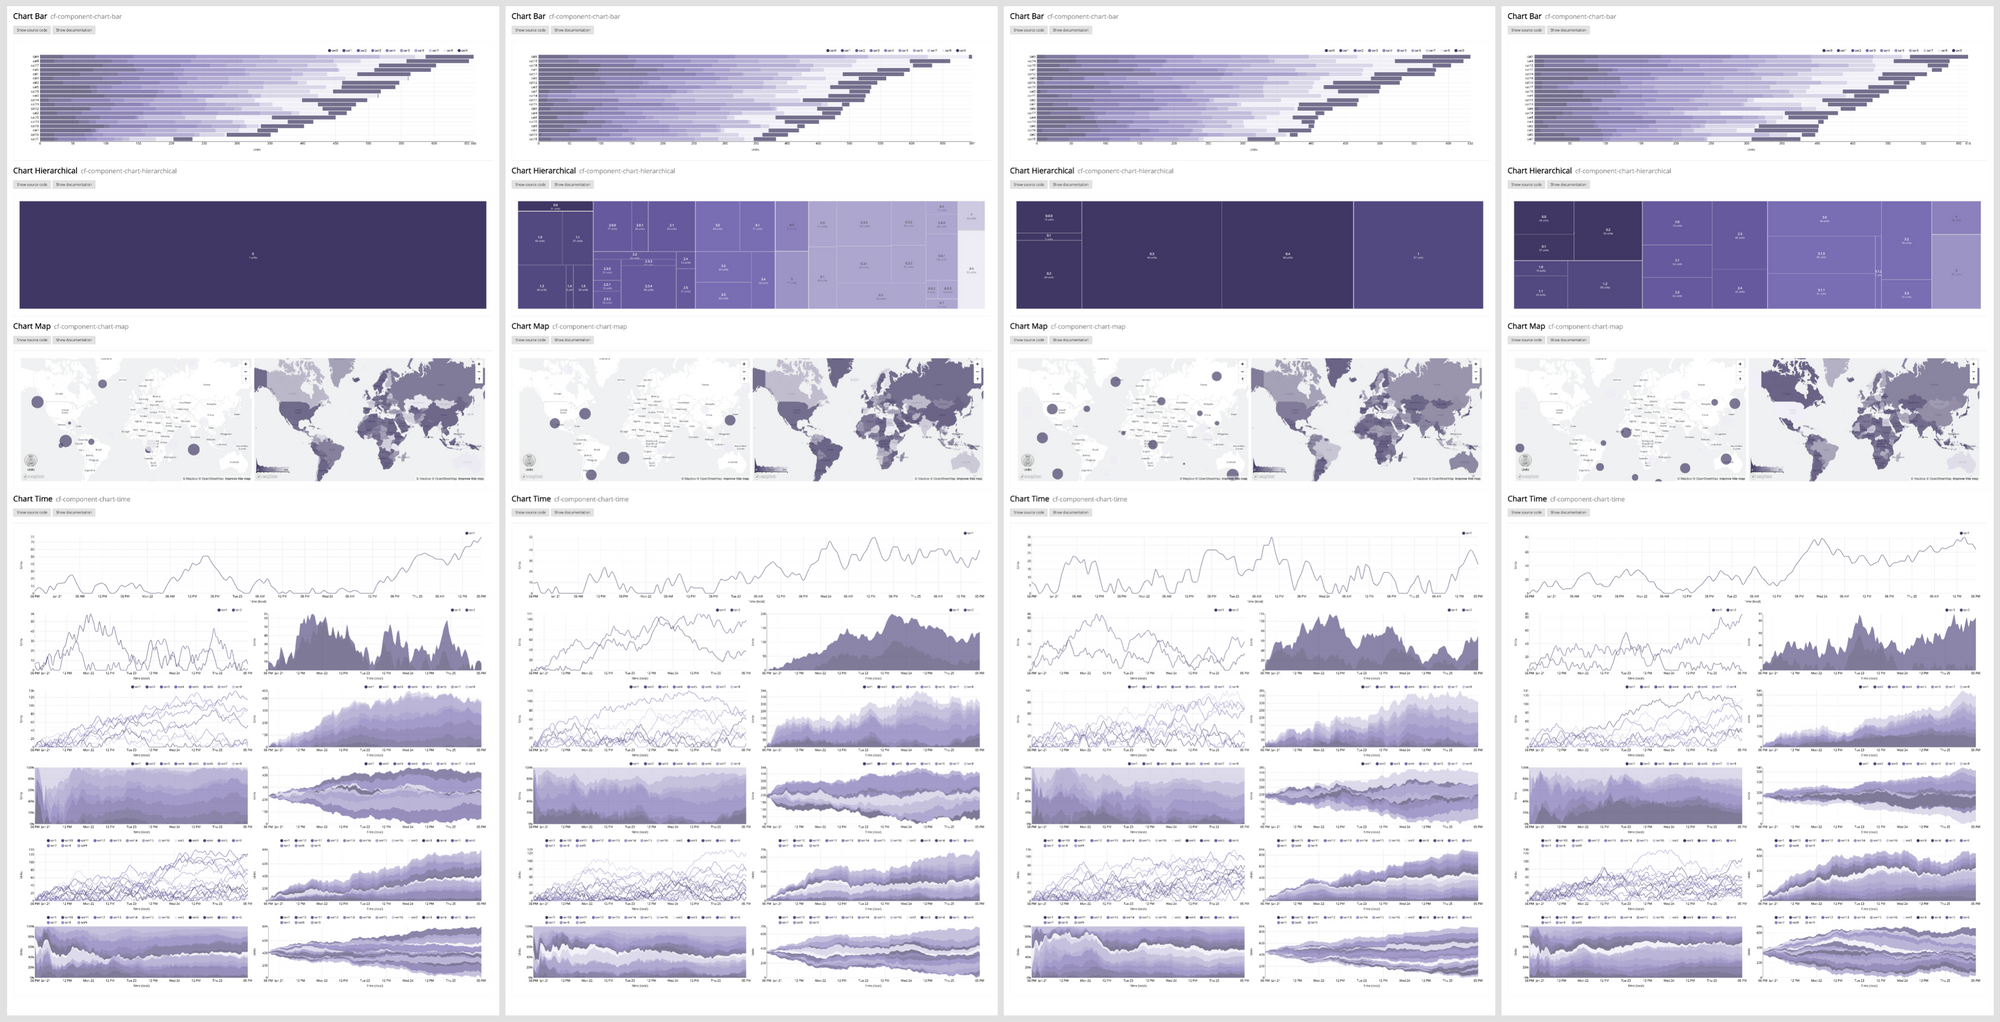

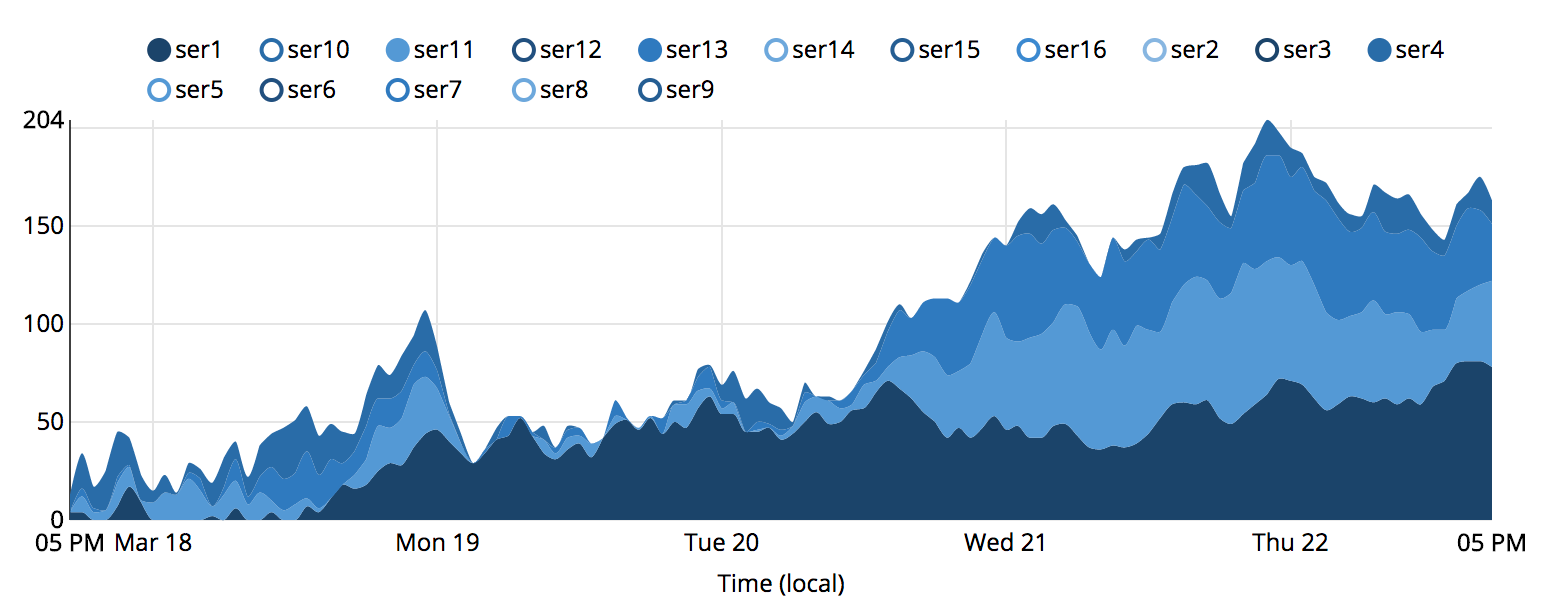
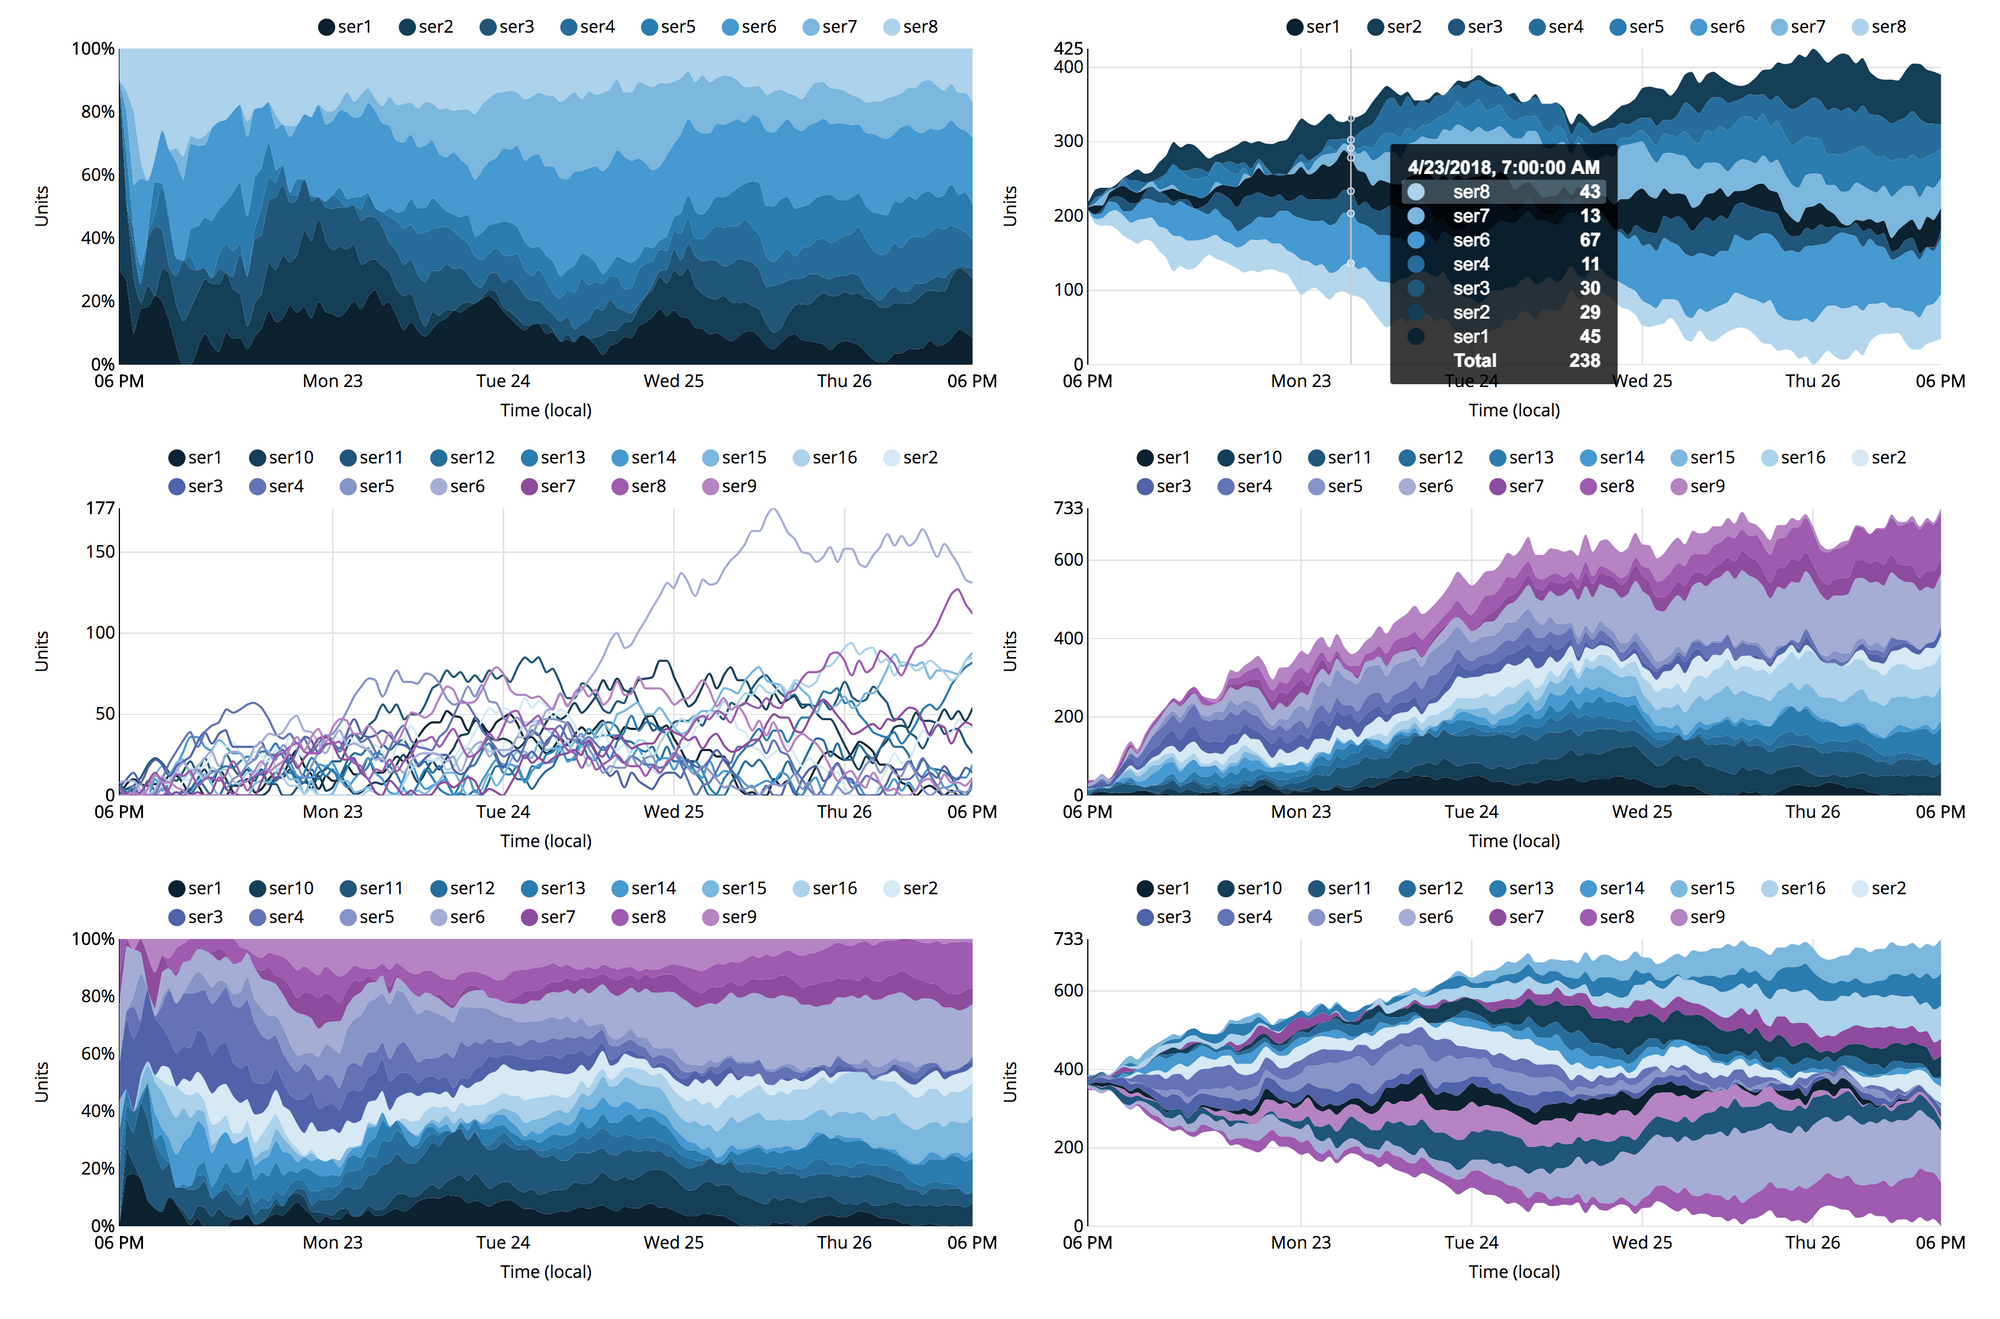
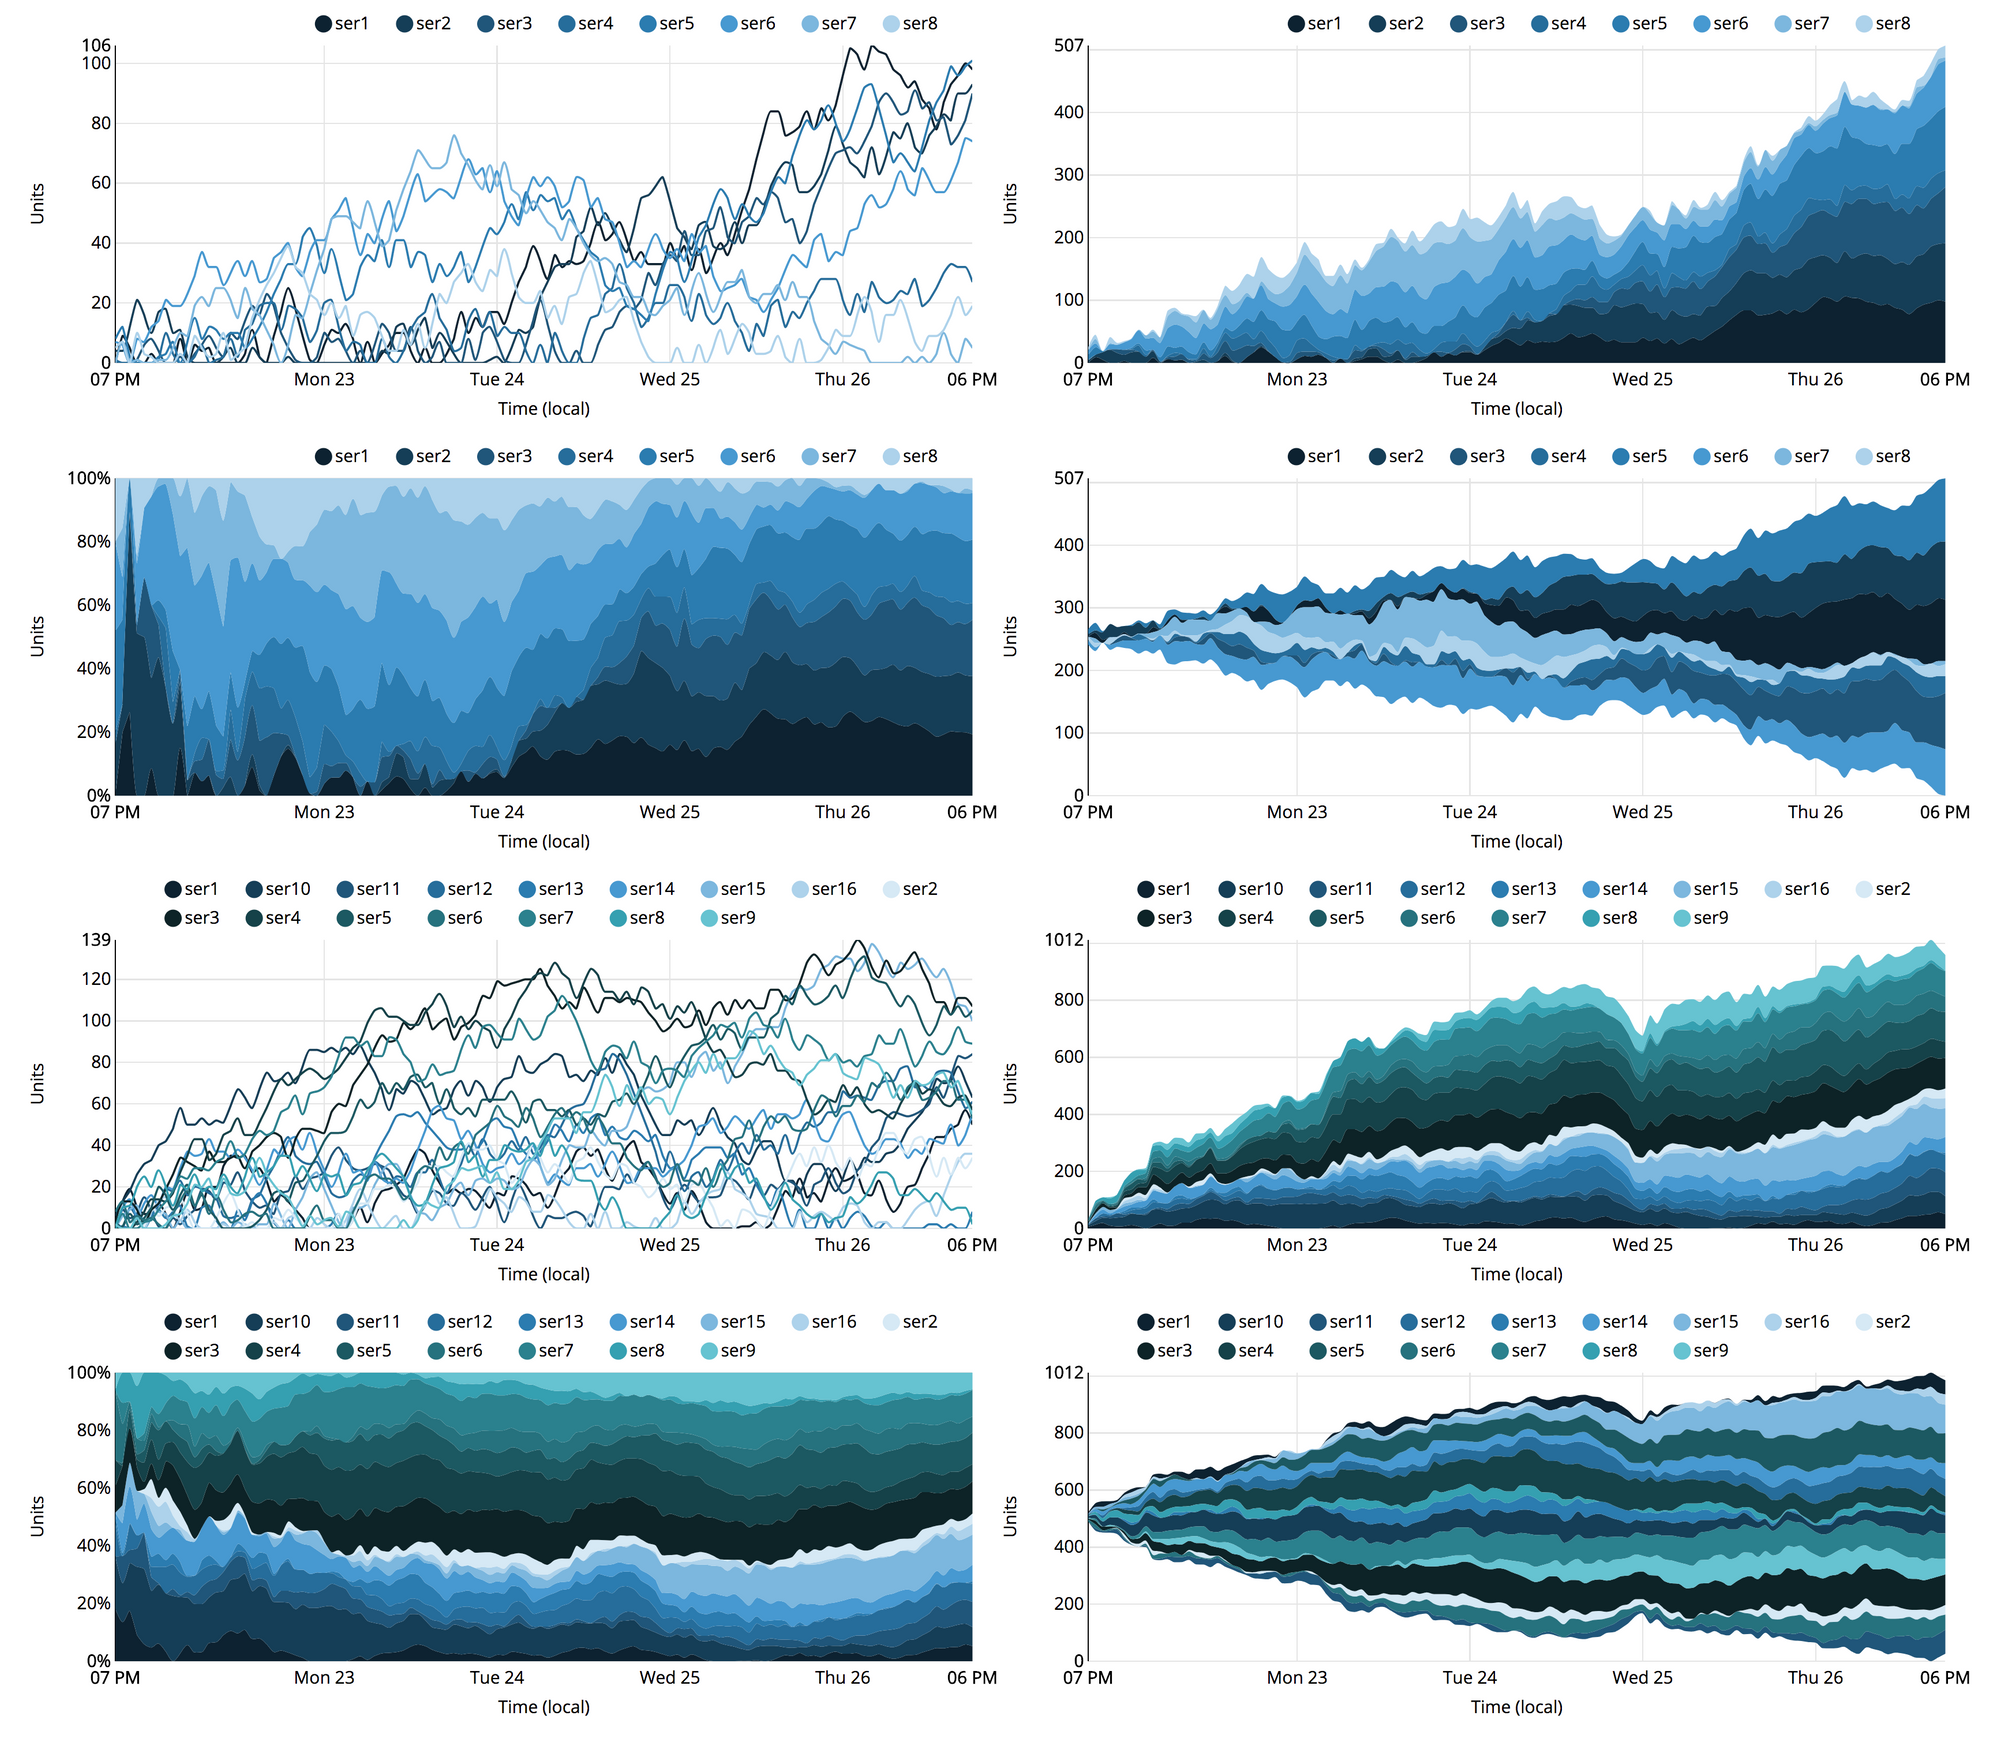
We experimented with a number of ideas on visualizing different sizes and shapes of colors and how they affected our perception of how much a color was changing element to element. In the first frame it is most difficult to tell the values at 2% and 6% apart given the size and shape of the elements.
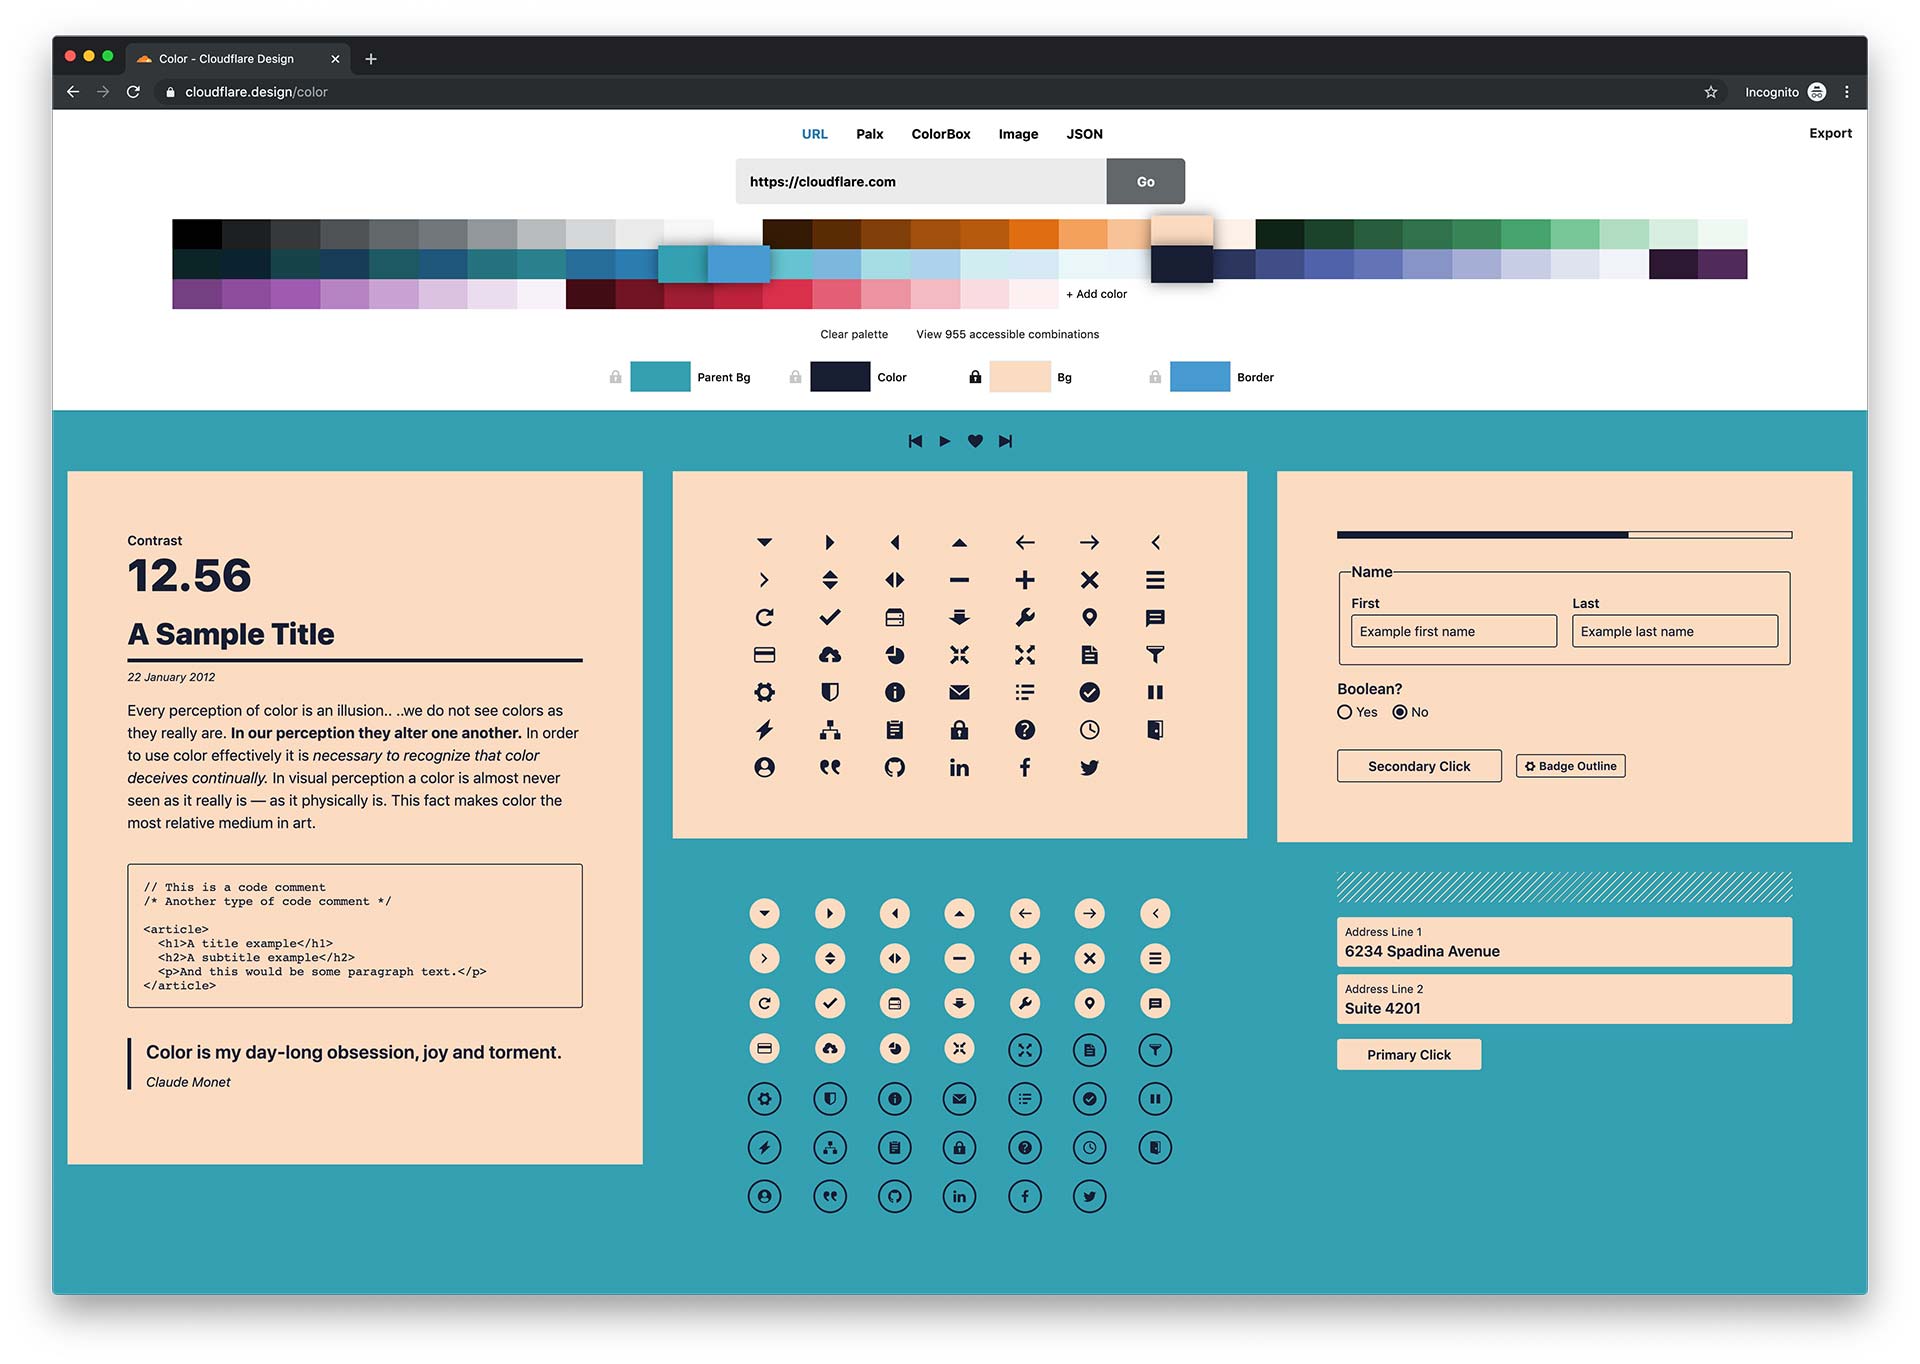
We’ve begun to package up some of this work into a web app others can use to create or import a palette and preview multiple depths of accessible combinations against a set of UI elements.
The goal is to make it easier for anyone to work seamlessly with color and build beautiful interfaces with accessible color contrasts.
In an effort to make sure everything we are building will be visually accessible - we built a react component that will preview how a design would look if you were colorblind. The component overlays SVG filters to simulate alternate ways someone can perceive color.
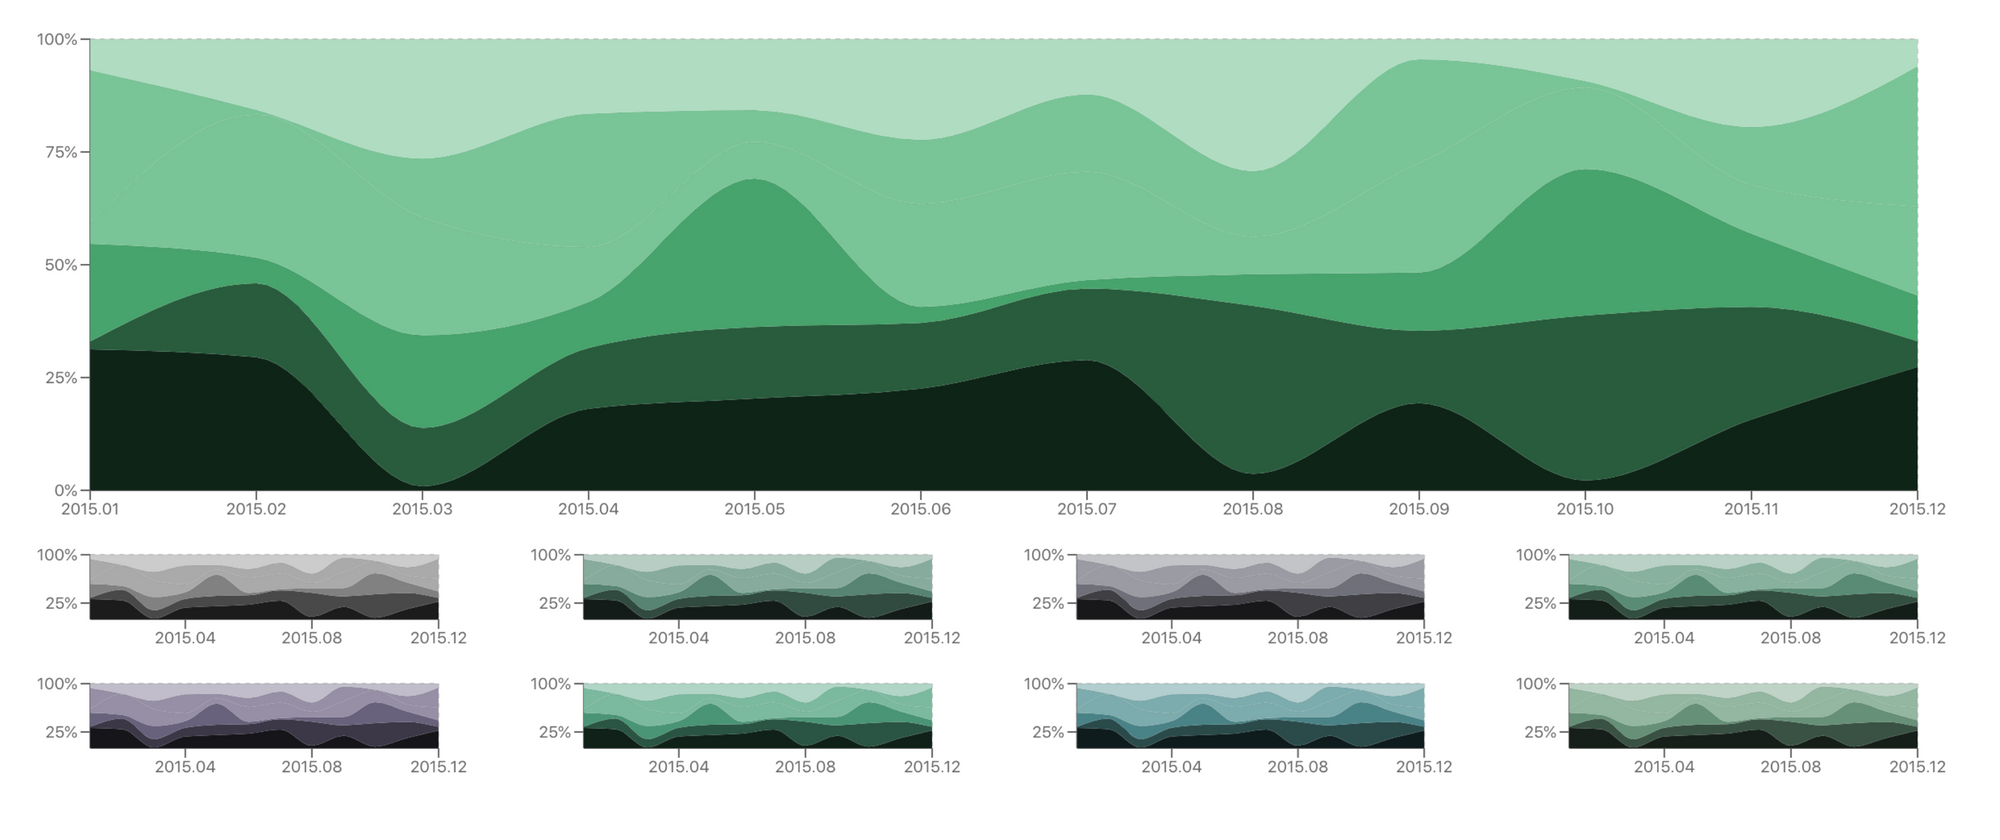
While this is previewing an analytics component, really any component or page can be previewed with this method.
import React from "react"

const filters = [
  'achromatopsia',
  'protanomaly',
  'protanopia',
  'deuteranomaly',
  'deuteranopia',
  'tritanomaly',
  'tritanopia',
  'achromatomaly',
]

const ColorBlindFilter = ({itemPadding, itemWidth, ...props }) => {
  return (
      <div  {...props}>
        {filters.map((filter, i) => (
          <div
            style={{filter: 'url(/filters.svg#'+filter+')'}}
            width={itemWidth}
            px={itemPadding}
            key={i+filter}
          >
            {props.children}
          </div>
        ))}
      </div>
  )
}

ColorBlindFilter.defaultProps = {
  display: 'flex',
  justifyContent: 'space-around',
  flexWrap: 'wrap',
  width: 1,
  itemWidth: 1/4
}

export default ColorBlindFilter
We’ve also released a Figma plugin that simulates this visualization for a component.
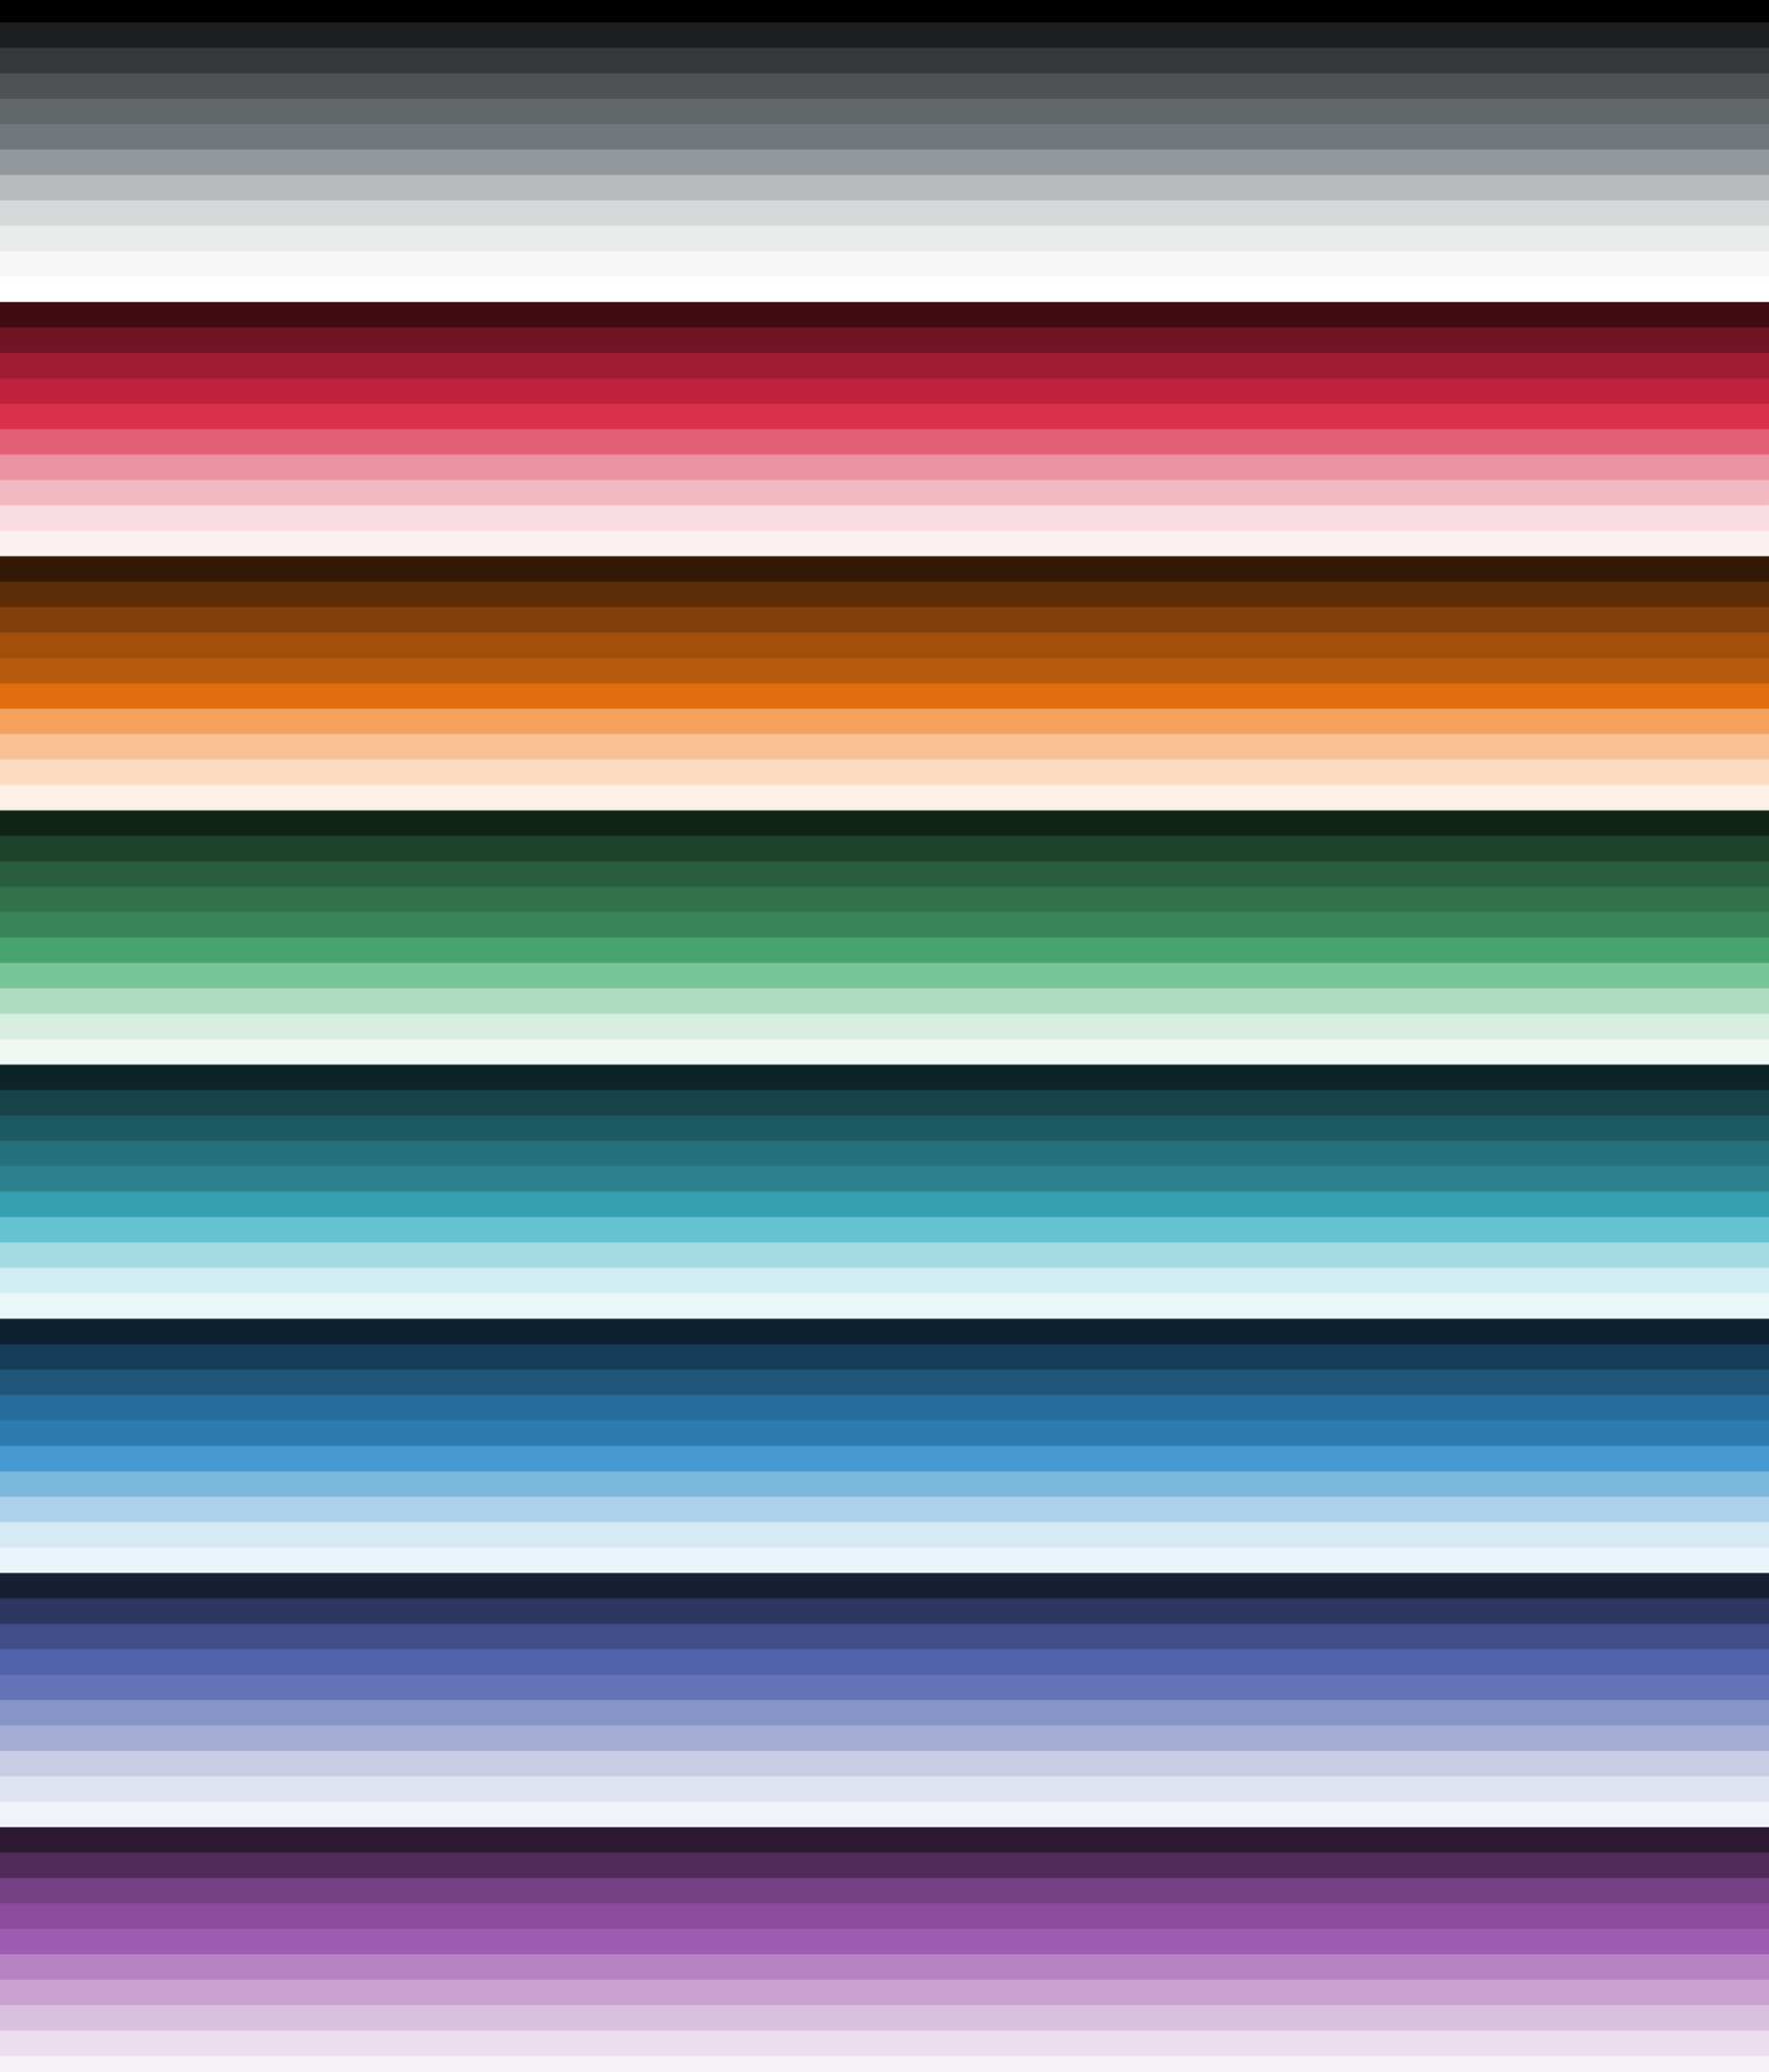
After quite a few iterations, we had finally come up with a color palette. Each scale was optically aligned with our brand colors. The 5th step in each scale is the closest to the original brand color, but adjusted slightly so it’s accessible with both black and white.
Lyft’s writeup “Re-approaching color” and Jeeyoung Jung’s “Designing Systematic Colors” are some of the best write-ups on how to work with color at scale you can find.
Color migrations

Getting a team of people to agree on a new color palette is a journey in and of itself. By the time you get everyone to consensus it’s tempting to just collapse into a heap and never think about colors ever again. Unfortunately the work doesn’t stop at this point. Now that we’ve picked our palette, it’s time to get it implemented so this bike shed is painted once and for all.
If you are porting an old legacy part of your app to be updated to the new style guide like we were, even the best color documentation can fall short in helping someone make the necessary changes.
We found it was more common than expected that engineers and designers wanted to know what the new version of a color they were familiar with was. During the transition between palettes we had an interface people could input any color and get the closest color within our palette.
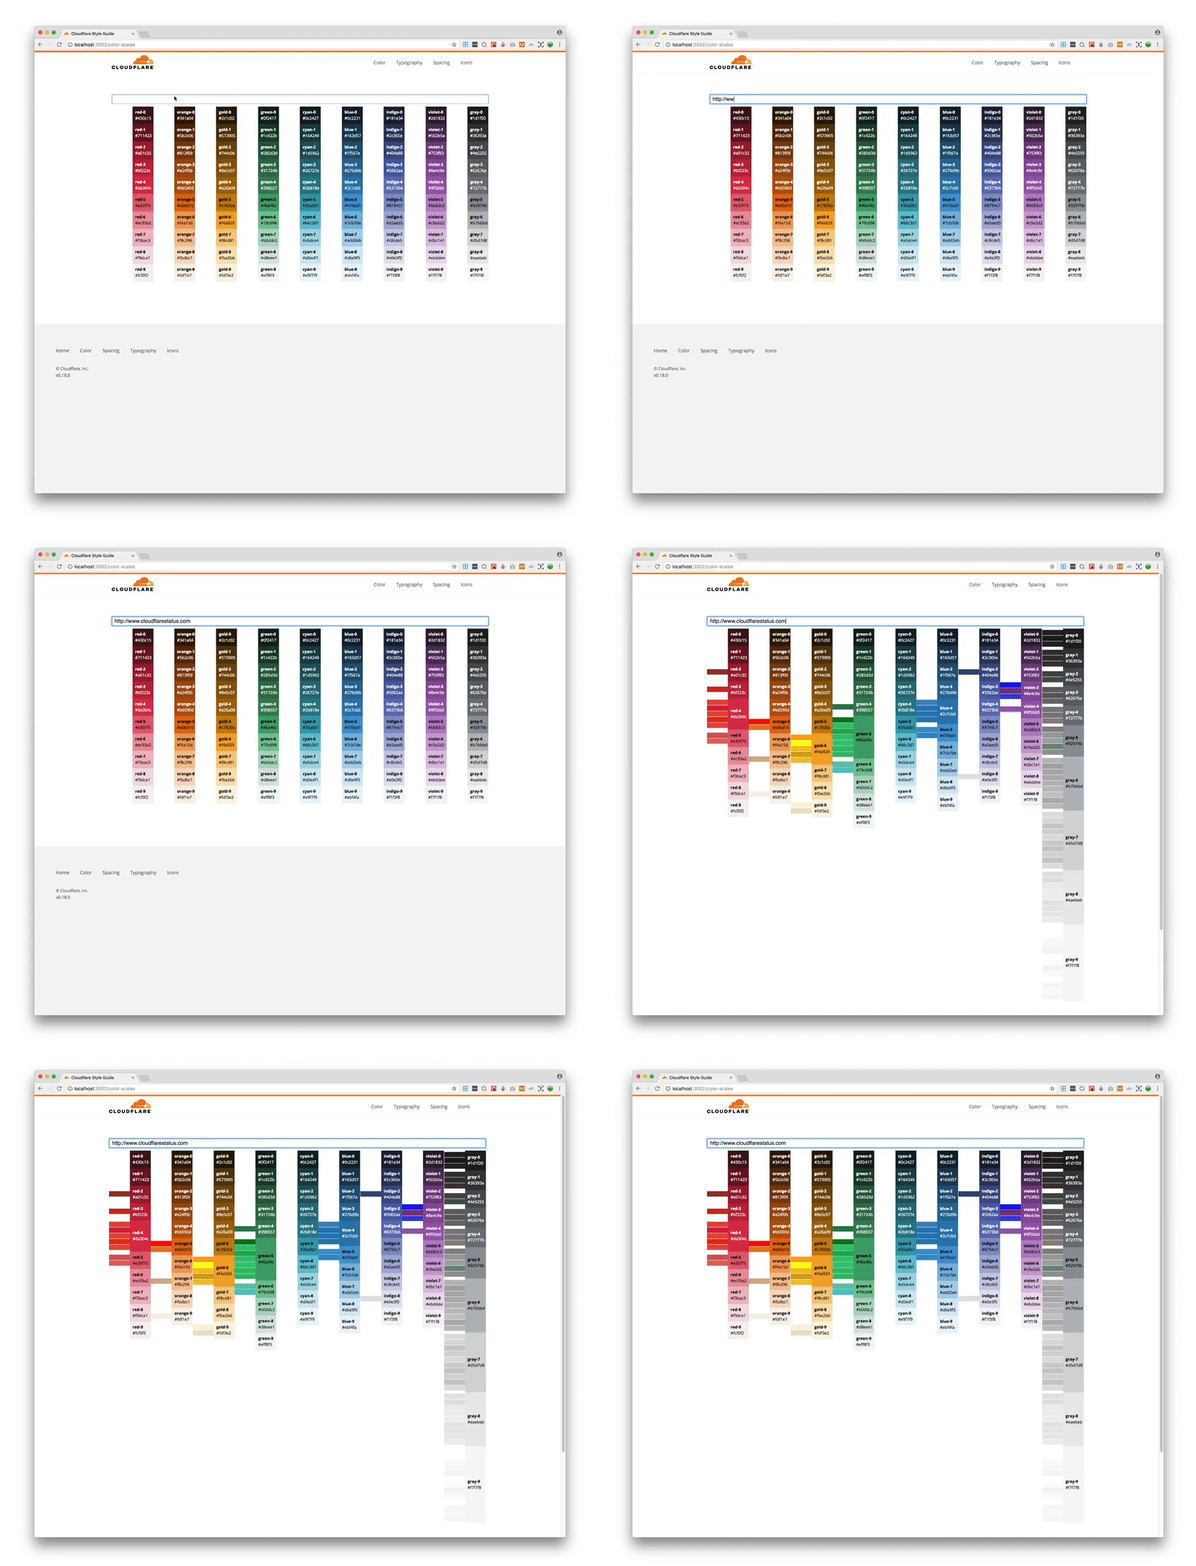
There are times when migrating colors, the closest color isn't actually what you want. Given the scenario where your brand color has changed from blue to purple, you might want to be porting all blues to the closest purple within the palette, not the closest blues which might still exist in your palette. To help visualize migrations as well as get suggestions on how to consolidate values within the old scale, we of course built a little tool. Here we can define those translations and import a color palette from a URL import. As we still have. a number of web properties to update to our palette, this simple tool has continued to prove useful.
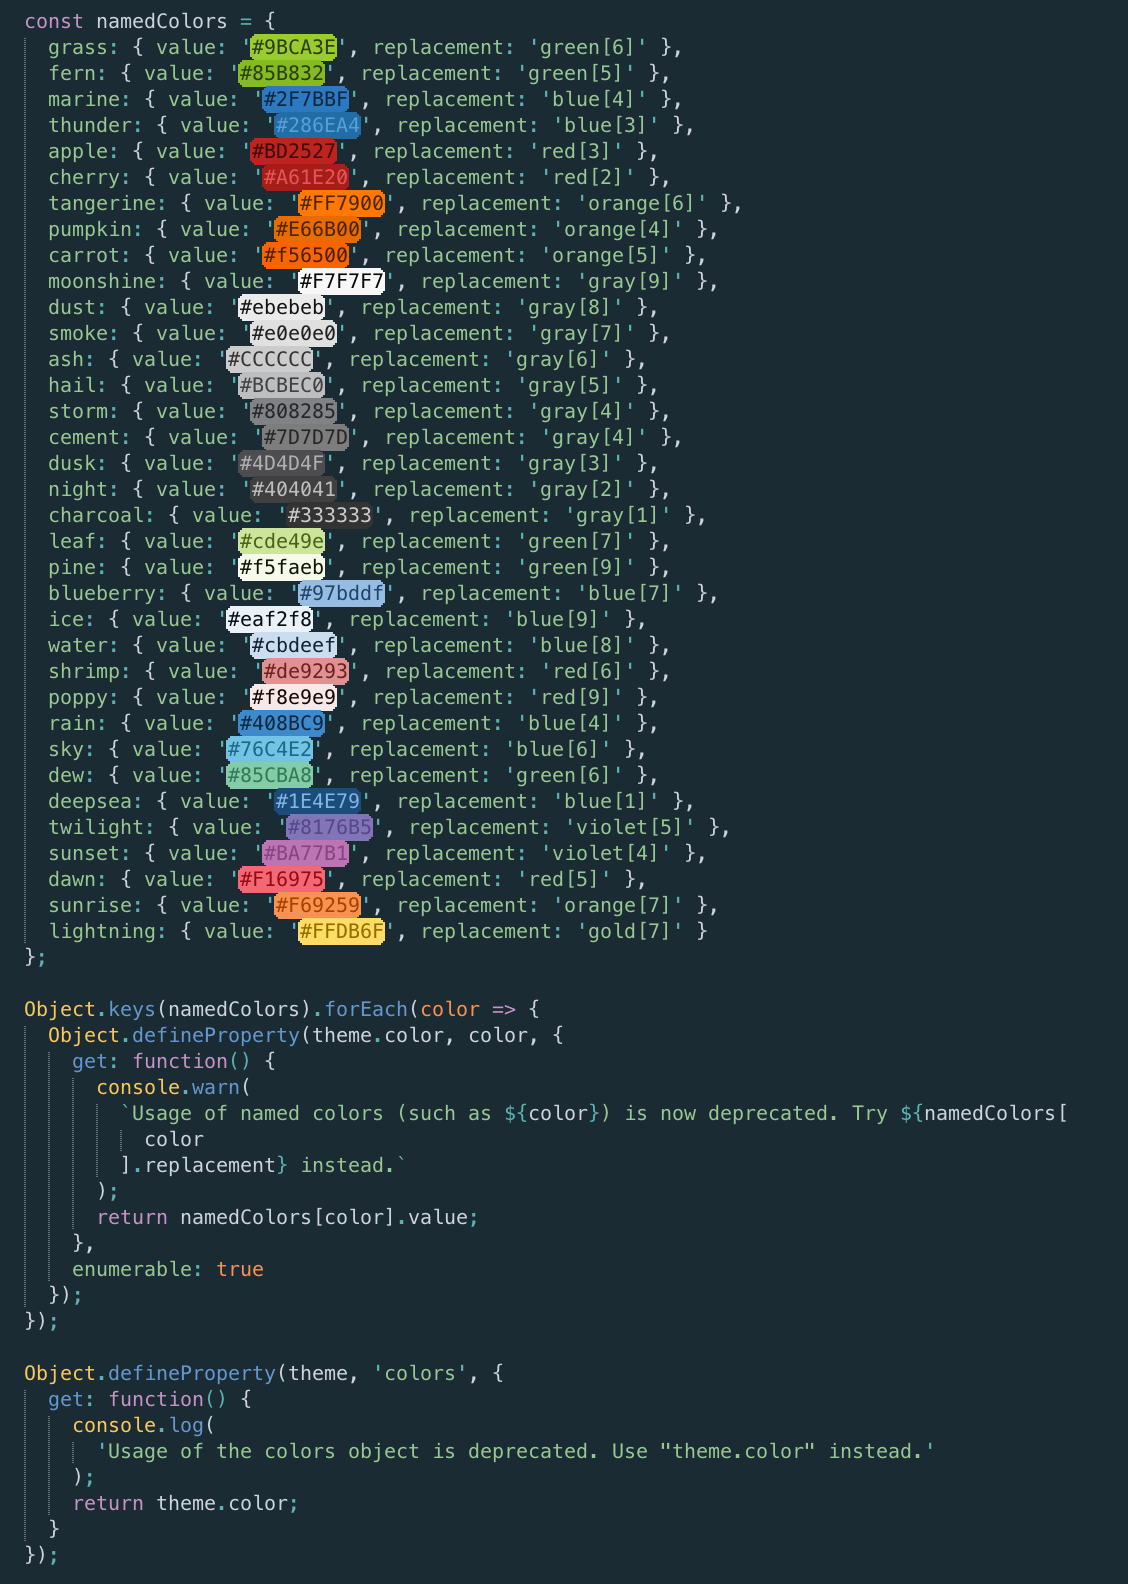
We wanted to be as gentle as possible in transitioning to the new palette in usage. While the developers found string names for colors brittle and unpredictable, it was still a more familiar system for some than this new one. We first just added in our new palette to the existing theme for usage moving forward. Then we started to port colors for existing components and pages.
For our colleagues, we wrote out desired translations and offered warnings in the console that a color was deprecated, with a reference to the new theme value to use.

While we had a few bugs along the way, the team was supportive and helped us fix bugs almost as quickly as we could find them.
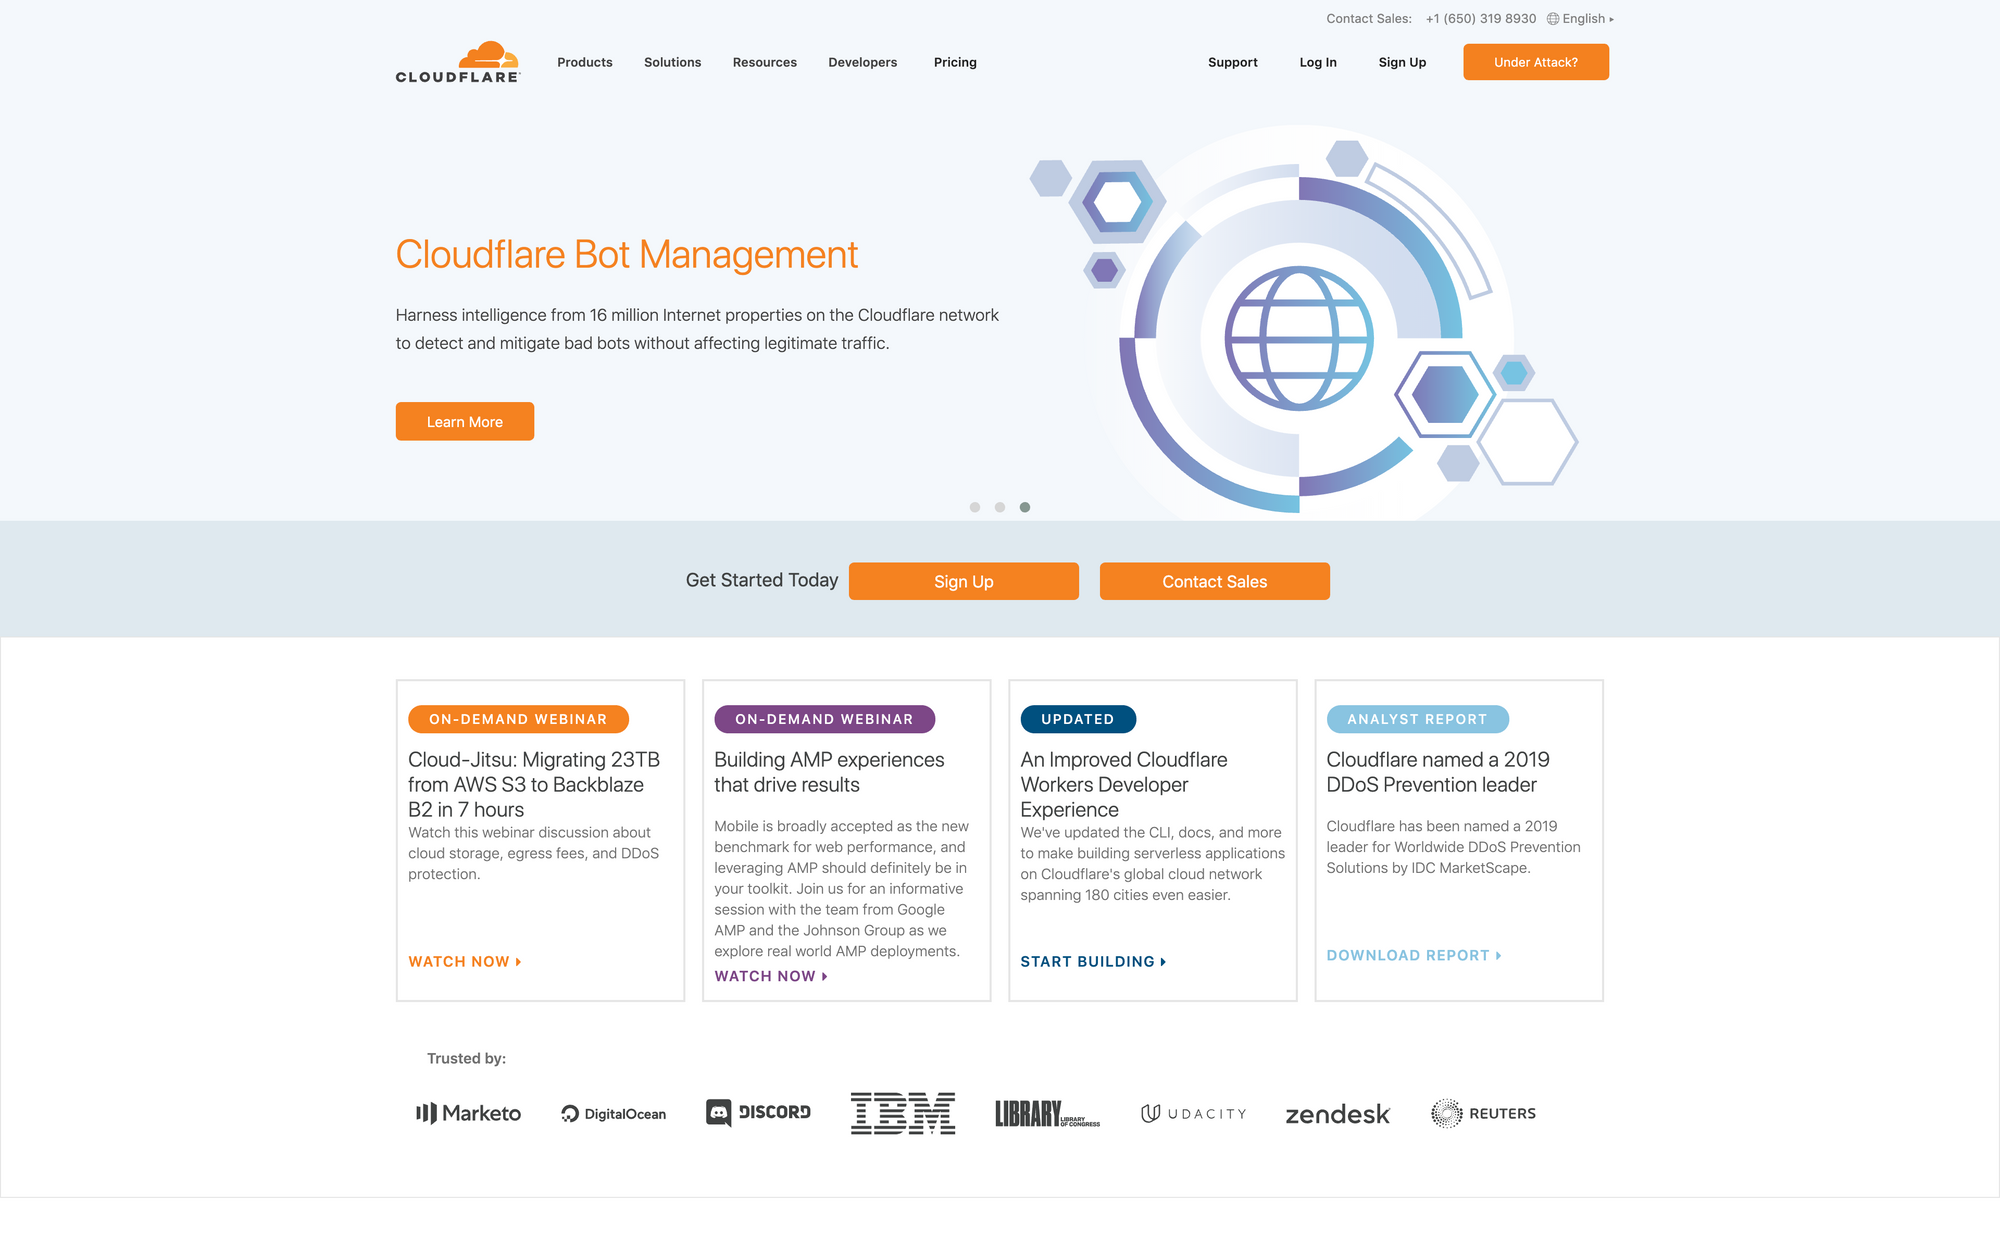
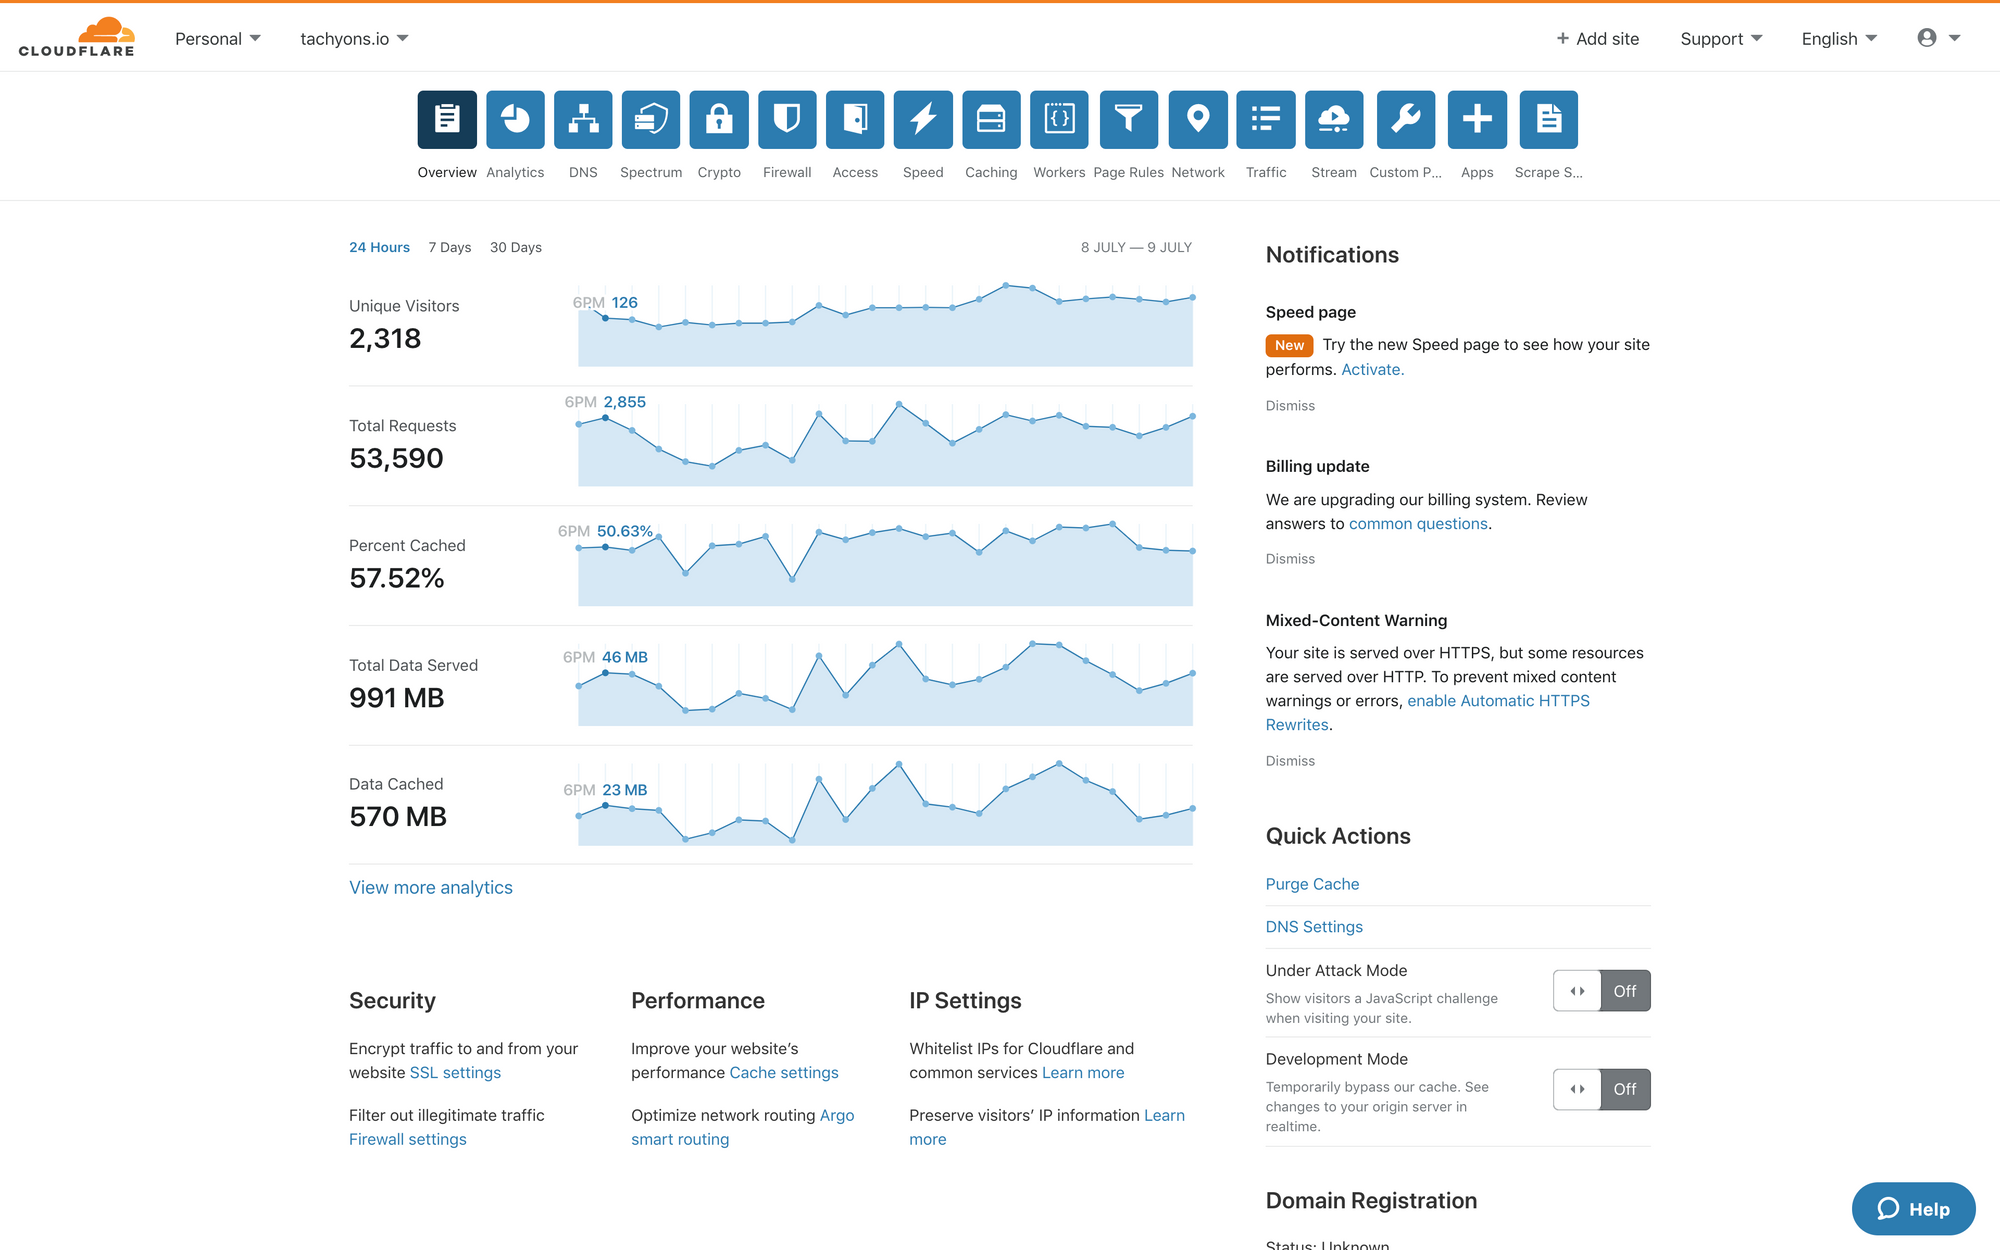
We’re still in the process of updating our web properties with our new palette, largely prioritizing accessibility first while trying to create a more consistent visual brand as a nice by-product of the work. A small example of this is our system status page. In the first image, the blue links in the header, the green status bar, and the about copy, were all inaccessible against their backgrounds.
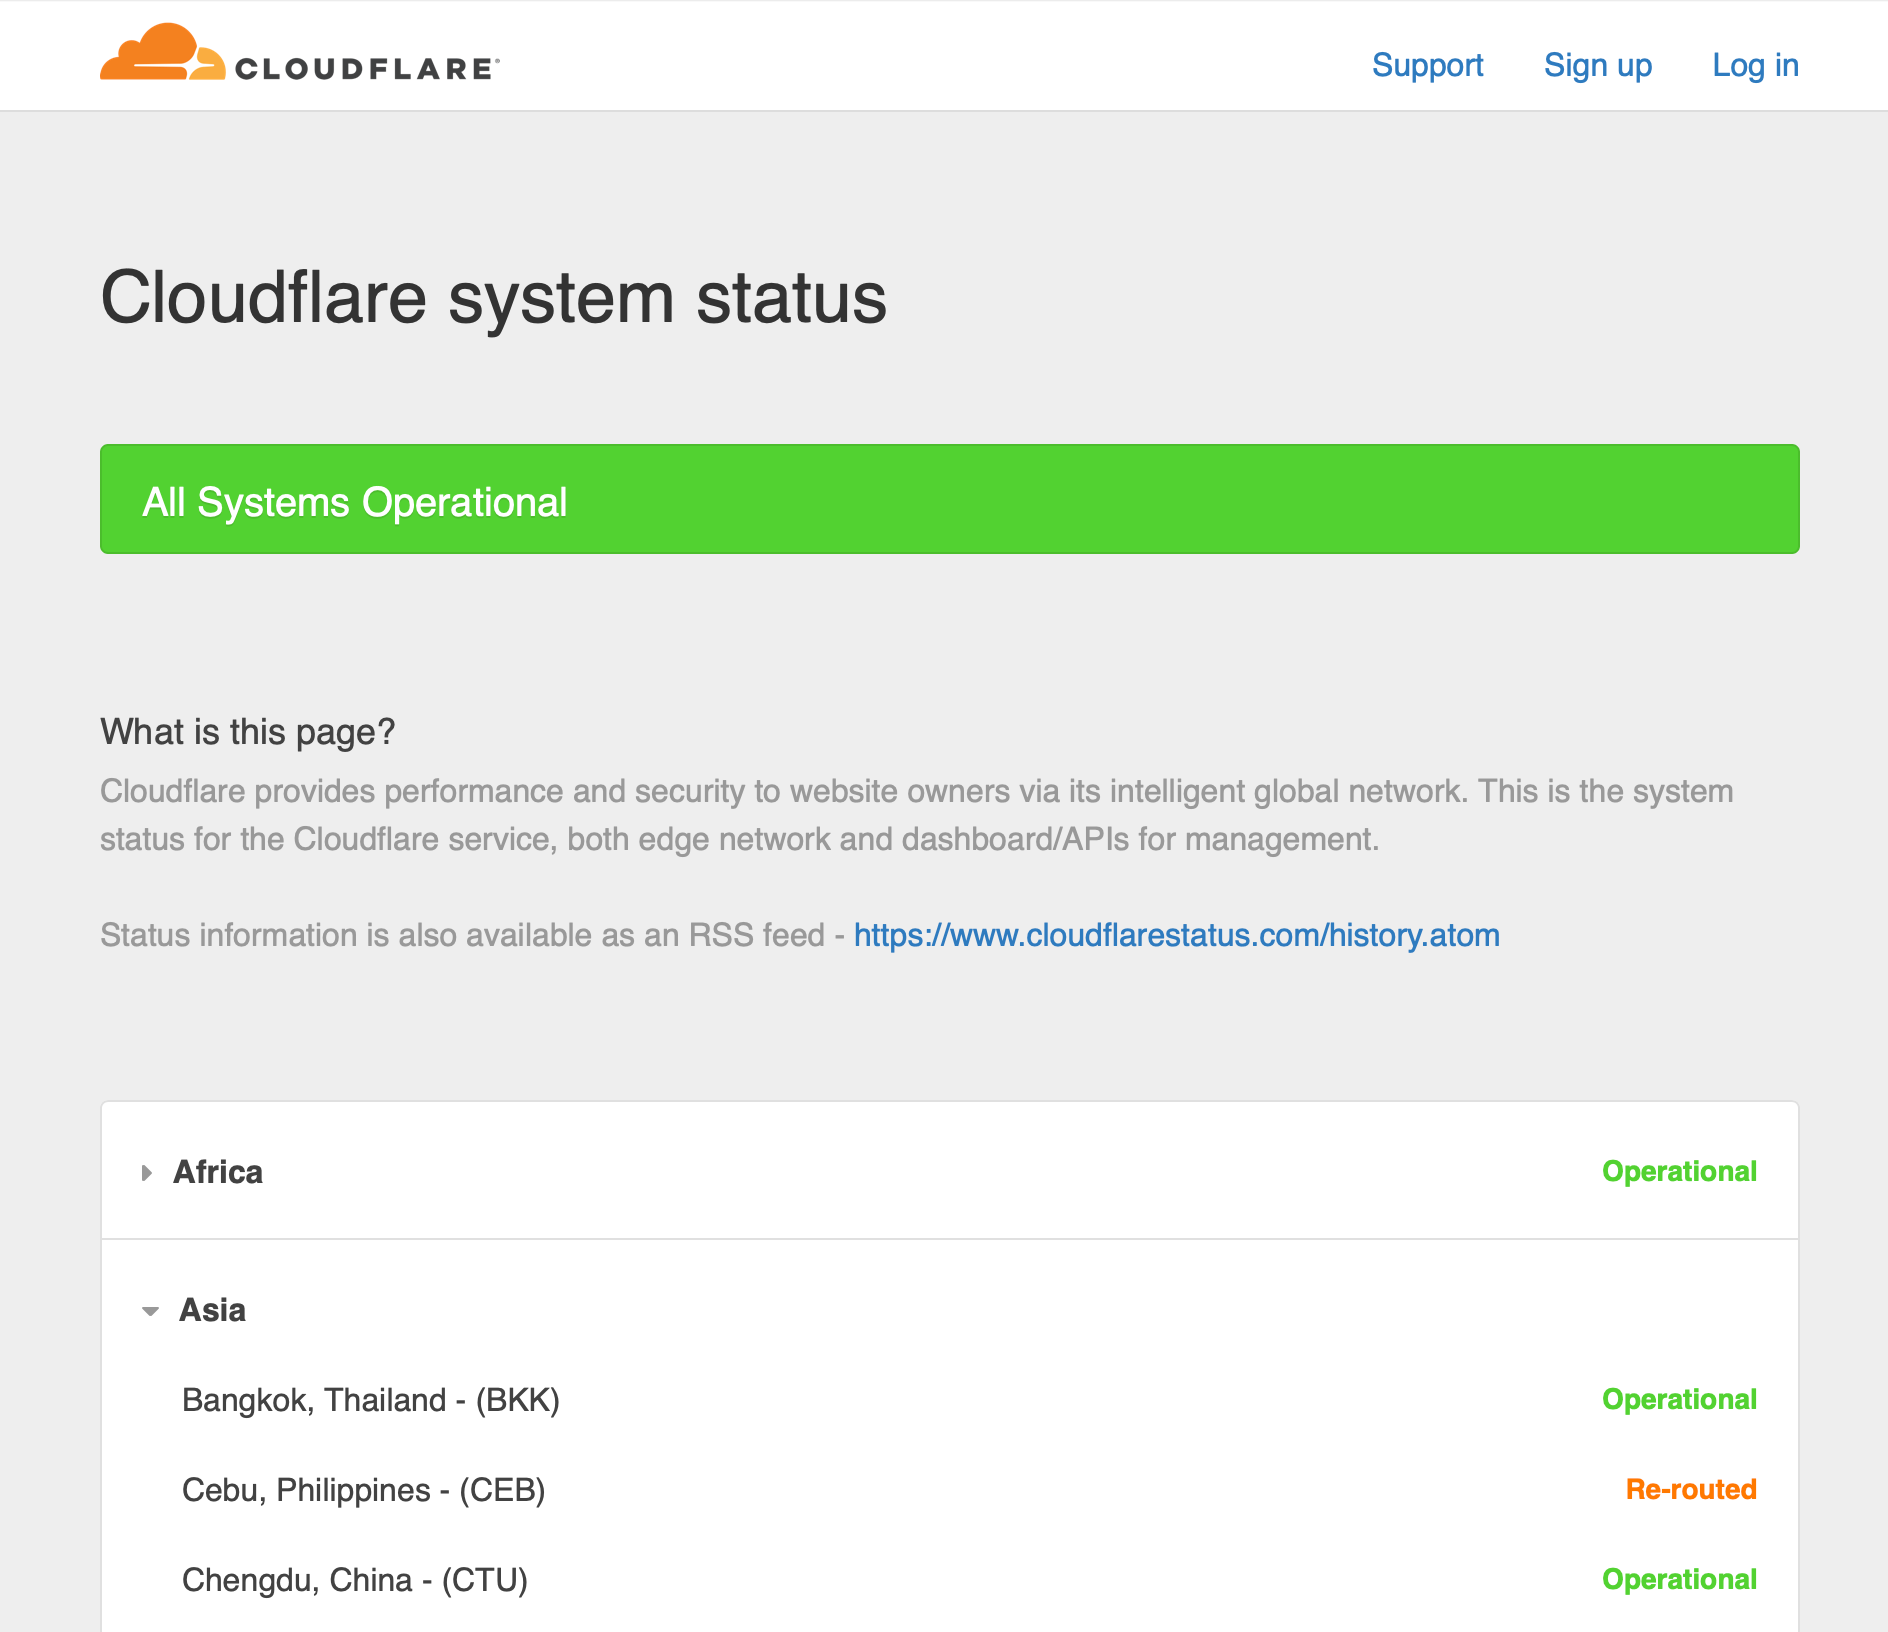
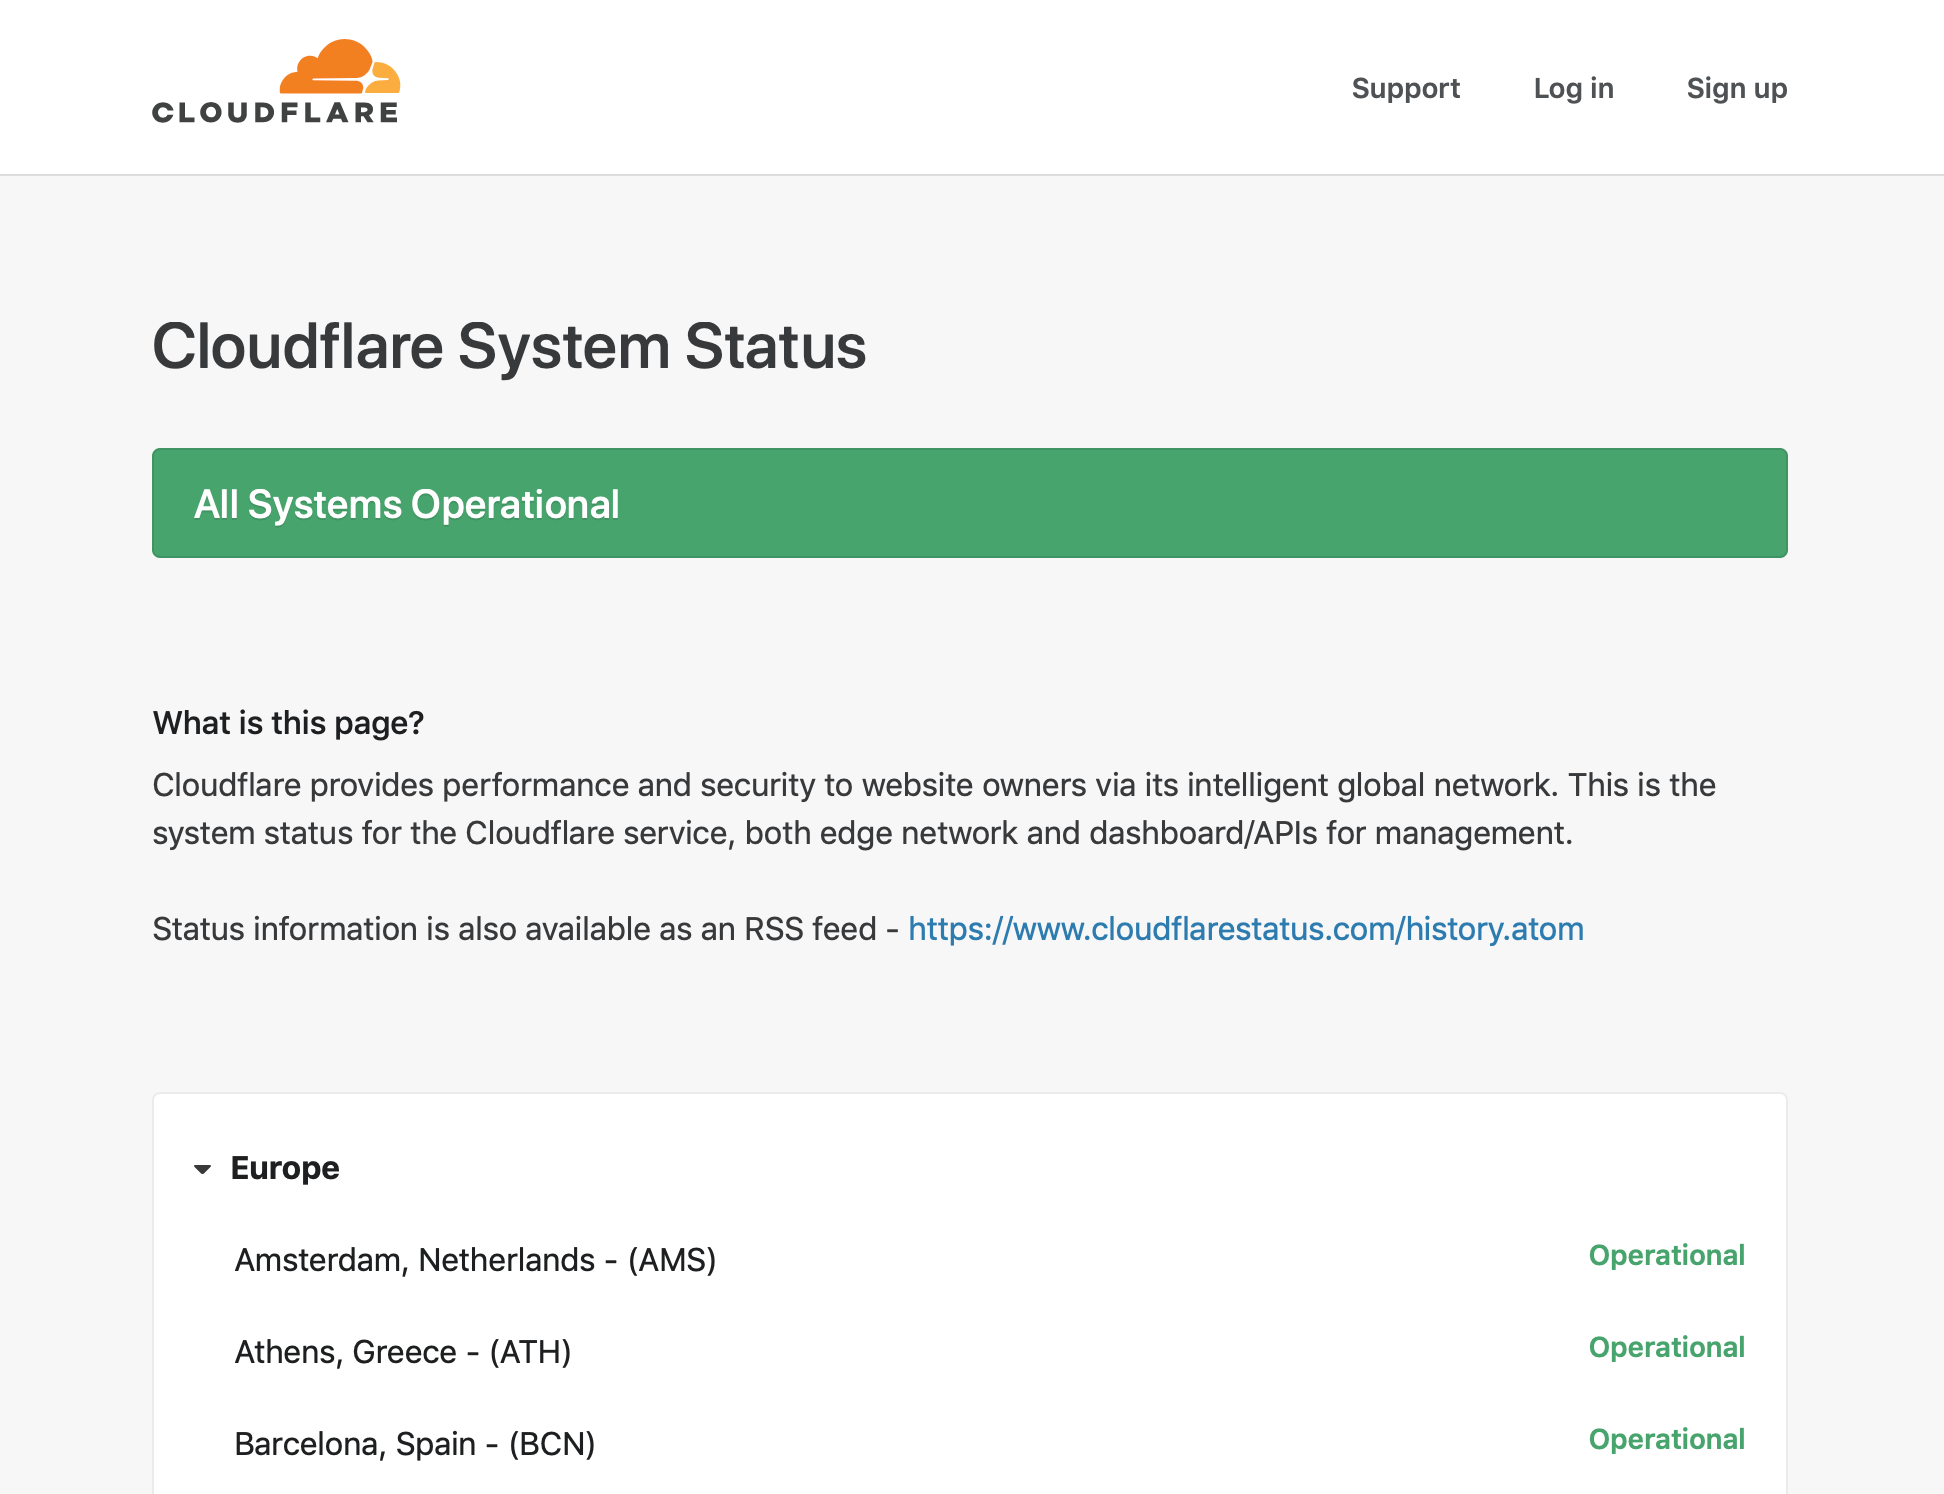
A lot of the changes have been subtle. Most notably the green we use in the dashboard is a lot more inline with our brand colors than before. In addition we’ve also been able to add visual balance by not just using straight black text on background colors. Here we added one of the darker steps from the corresponding scale, to give it a bit more visual balance.


While we aren’t perfect yet, we’re making progress towards more visual cohesion across our marketing materials and products.
2017
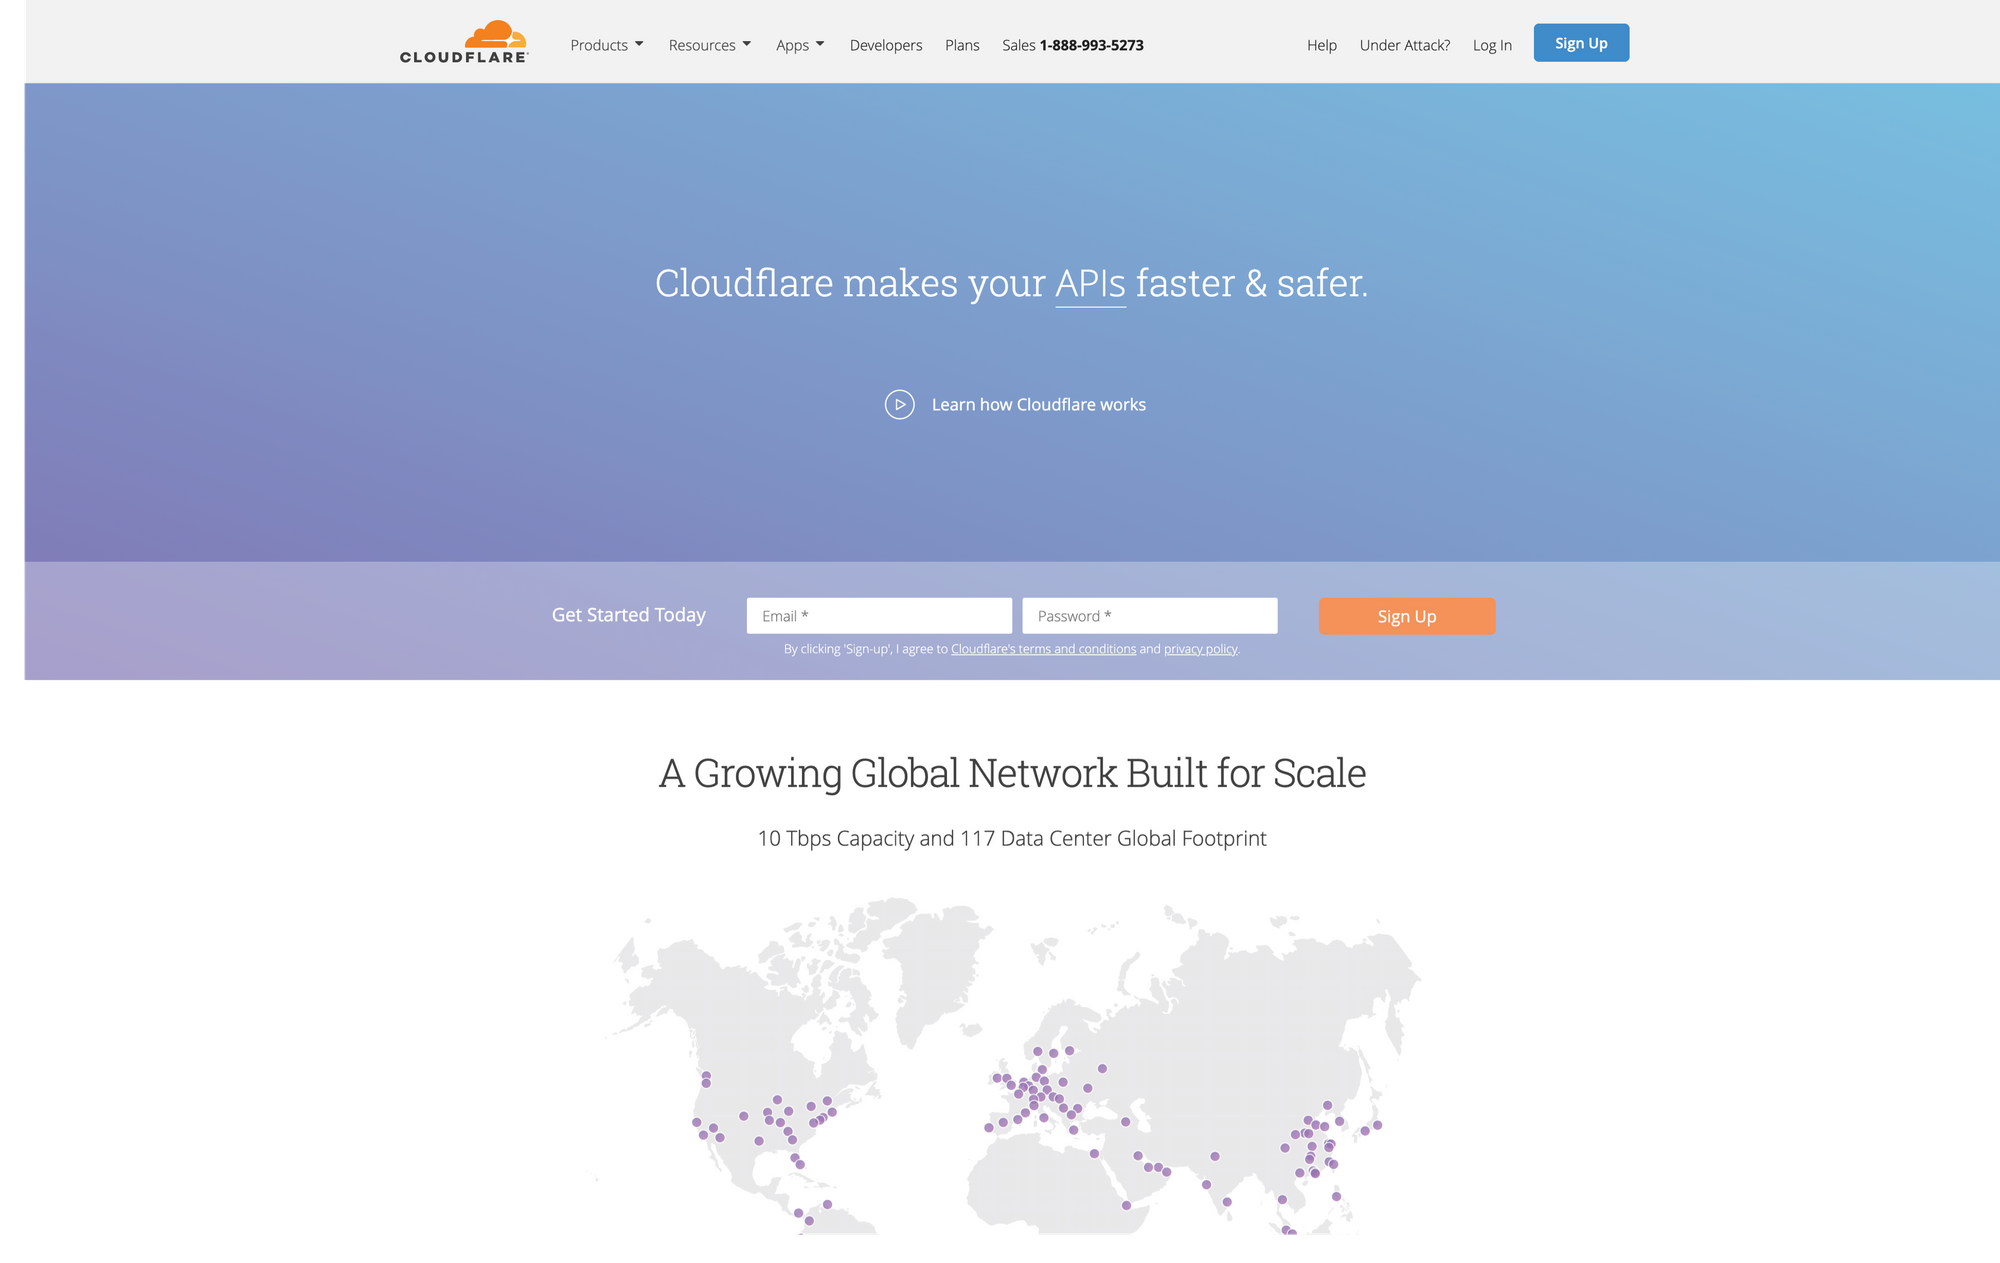
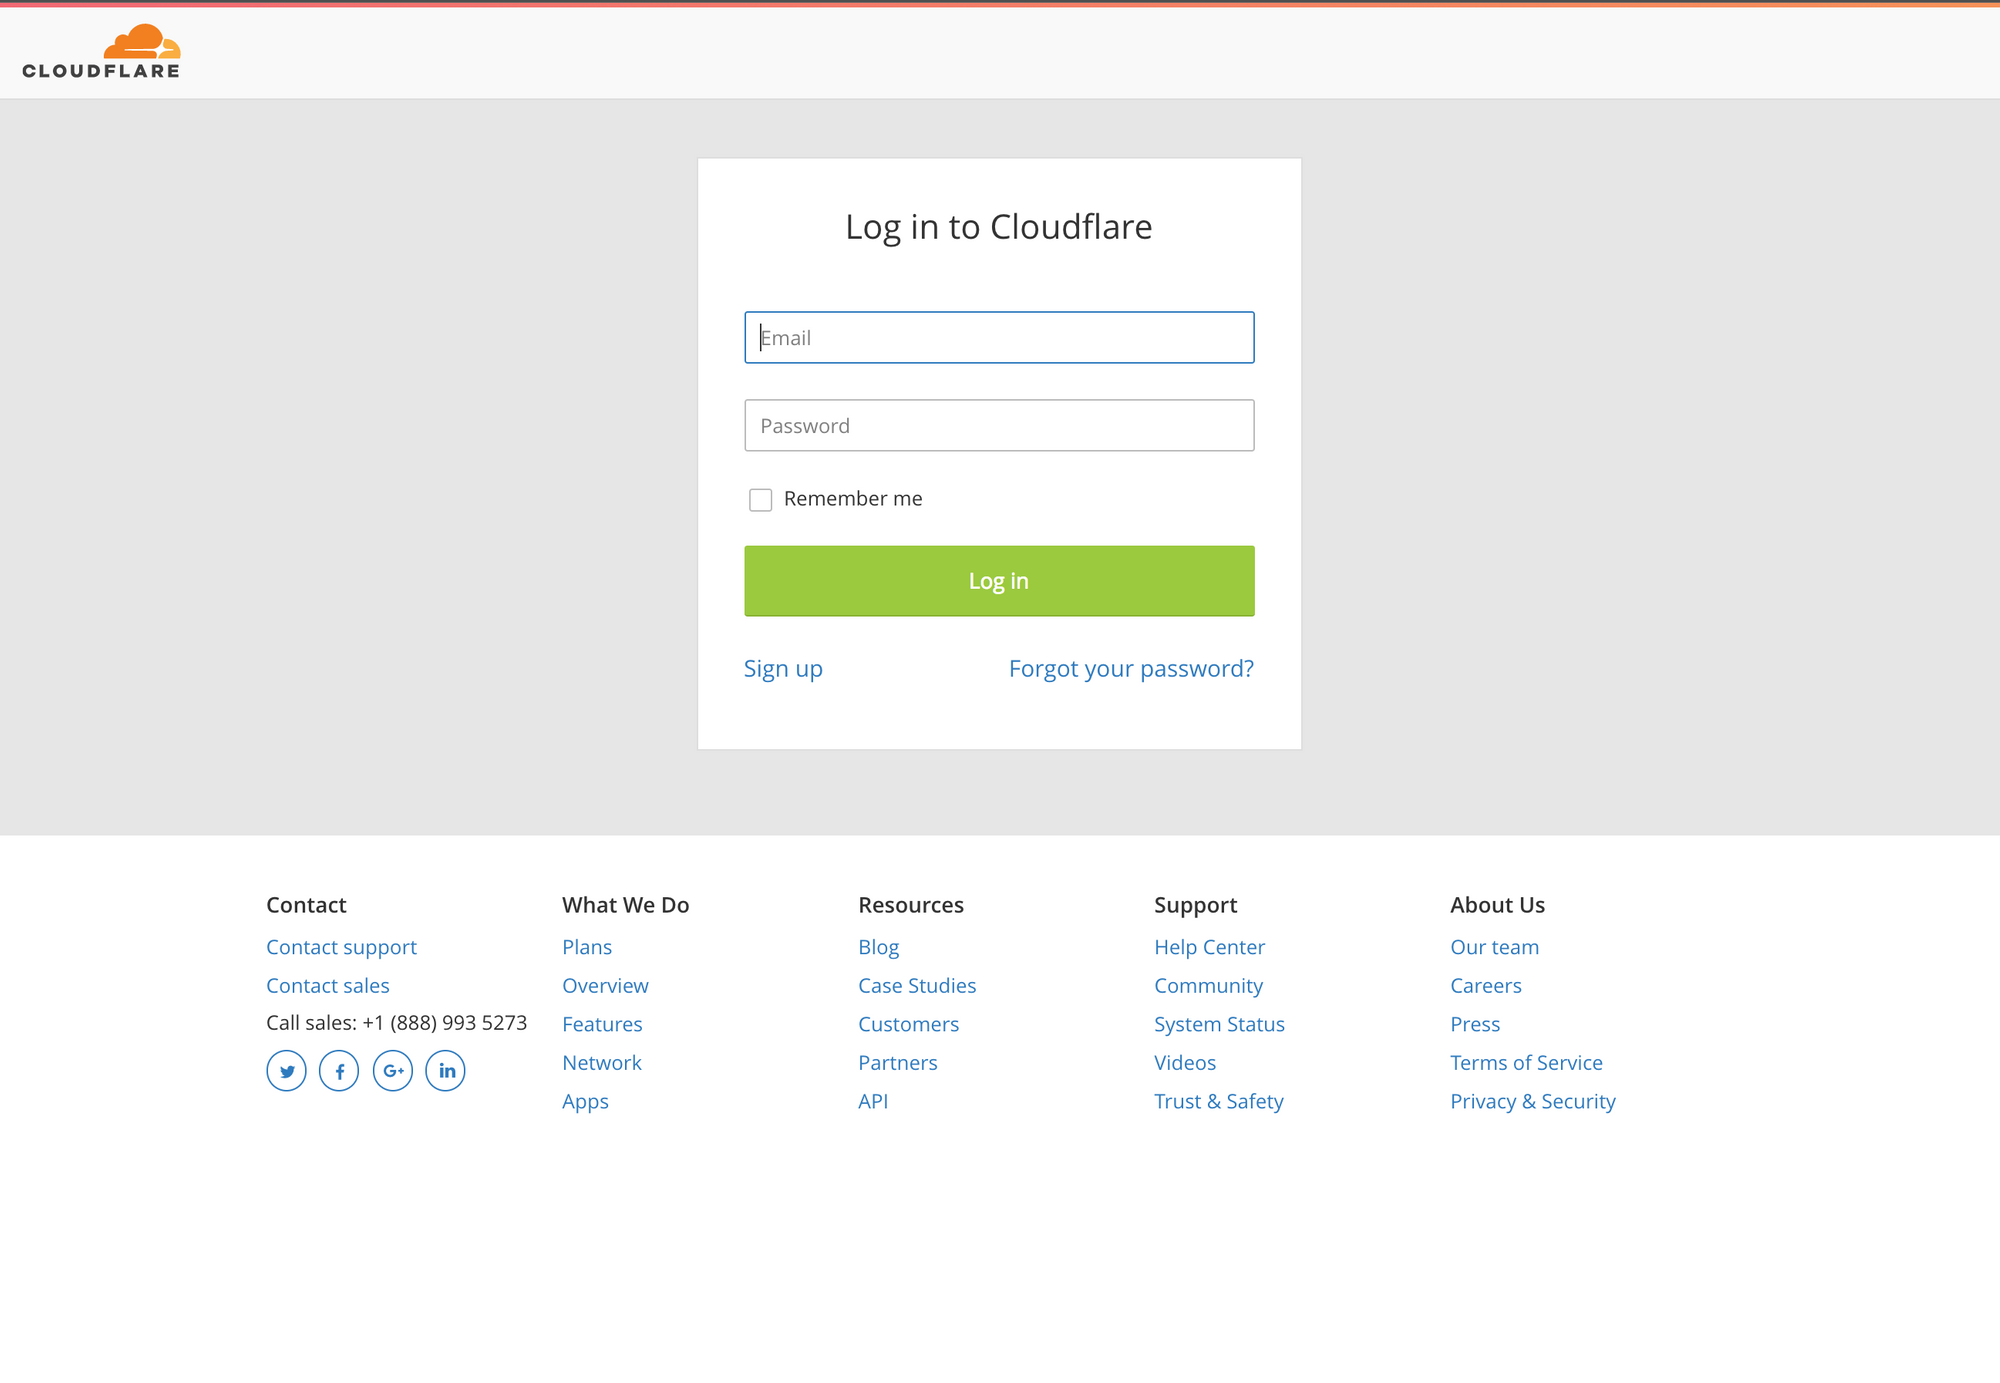
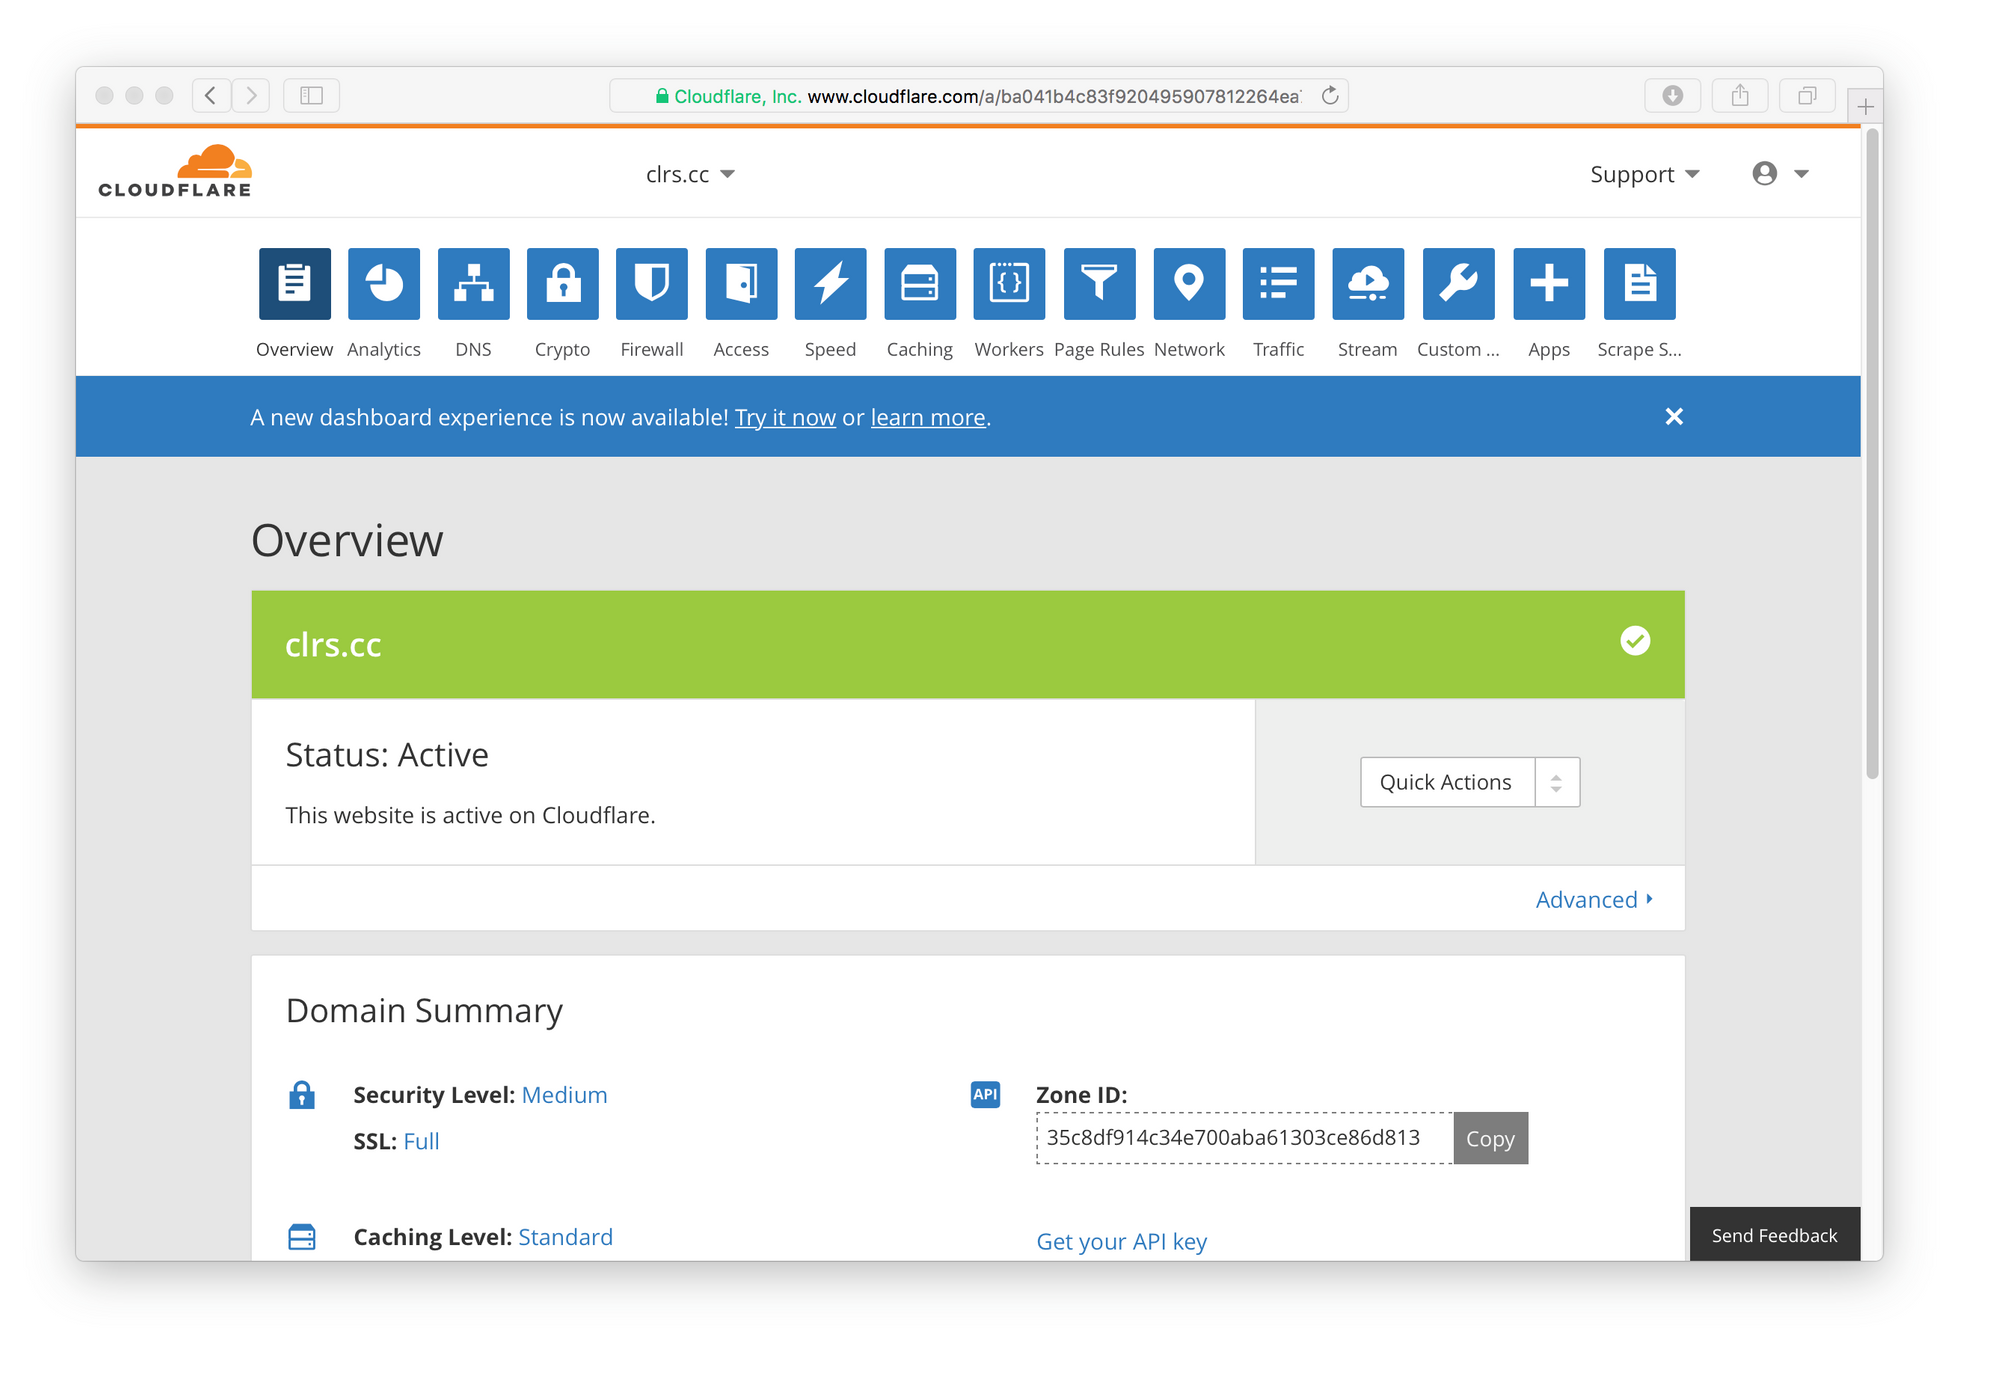
2019
Next steps
Trying to keep dozens of sites all using the same palette in a consistent manner across time is a task that you can never complete. It’s an ongoing maintenance problem. Engineers familiar with the color system leave, new engineers join and need to learn how the system works. People still launch sites using a different palette that doesn’t meet accessibility standards. Our work continues to be cut out for us. As they say, a garden doesn’t tend itself.
If we do ever revisit our brand colors, we're excited to have infrastructure in place to update our apps and several of our satellite sites with significantly less effort than our first time around.
Resources
Some of our favorite materials and resources we found while exploring this problem space.
Apps
- Color - Cloudflare Design
- Color matching game - Method
- Colorbox - Lyft
- Colorable - Brent Jackson
- Color contrast picker - Kevin Gutowski
Writing
- Designing accessible color systems - Stripe
- Re-approaching Color - Lyft
- Color constancy - Akiyoshi Kitaoka
- Weber-Fechner law


