The recommendation for social distancing to slow down the spread of COVID-19 has led many companies to adopt a work-from-home policy for their employees in offices around the world, and Cloudflare is no exception.
As a result, a large portion of Internet access shifted from office-focused areas, like city centers and business parks, towards more residential areas like suburbs and outlying towns. We wanted to find out just precisely how broad this geographical traffic migration was, and how different locations were affected by it.
It turns out it is substantial, and the results are quite stunning:
Gathering the Data
So how can we determine if Internet usage patterns have changed from a geographical perspective?
In each Cloudflare Point of Presence (in more than 200 cities worldwide) there's an edge router whose responsibility it is to switch Internet traffic to serve the requests of end users in the region.
These edge routers are the network's entry point and for monitoring and debugging purposes each router samples IP packet information regarding the traffic that traverses them. This data is collected as flow records and contains layer-3 related information, such as the source and destination IP address, port, packet size etc.
These statistical samples allow us to monitor aggregate traffic information, spot unusual activity, and verify that our connections to the greater Internet are working correctly.
By using a geolocation database like Maxmind, we can determine the rough location from which a flow emanates. If the geographic data is too imprecise it is excluded from our set to reduce noise.
By merging together information about flows that come from similar areas, we can infer a geospatial distribution of traffic volume across the globe.
Visual Representation
This distribution of traffic volume is an indication of Internet usage patterns. By plotting a geospatial heatmap of the Internet traffic in New York City for two separate dates four weeks apart (February 19, 2020 and March 18, 2020), we can already notice an erosion of traffic volume from the city center dissipating into the surrounding areas.
All the charts in this blog post show day time traffic in each geography. This is done to show the difference working from home is having on Internet traffic.
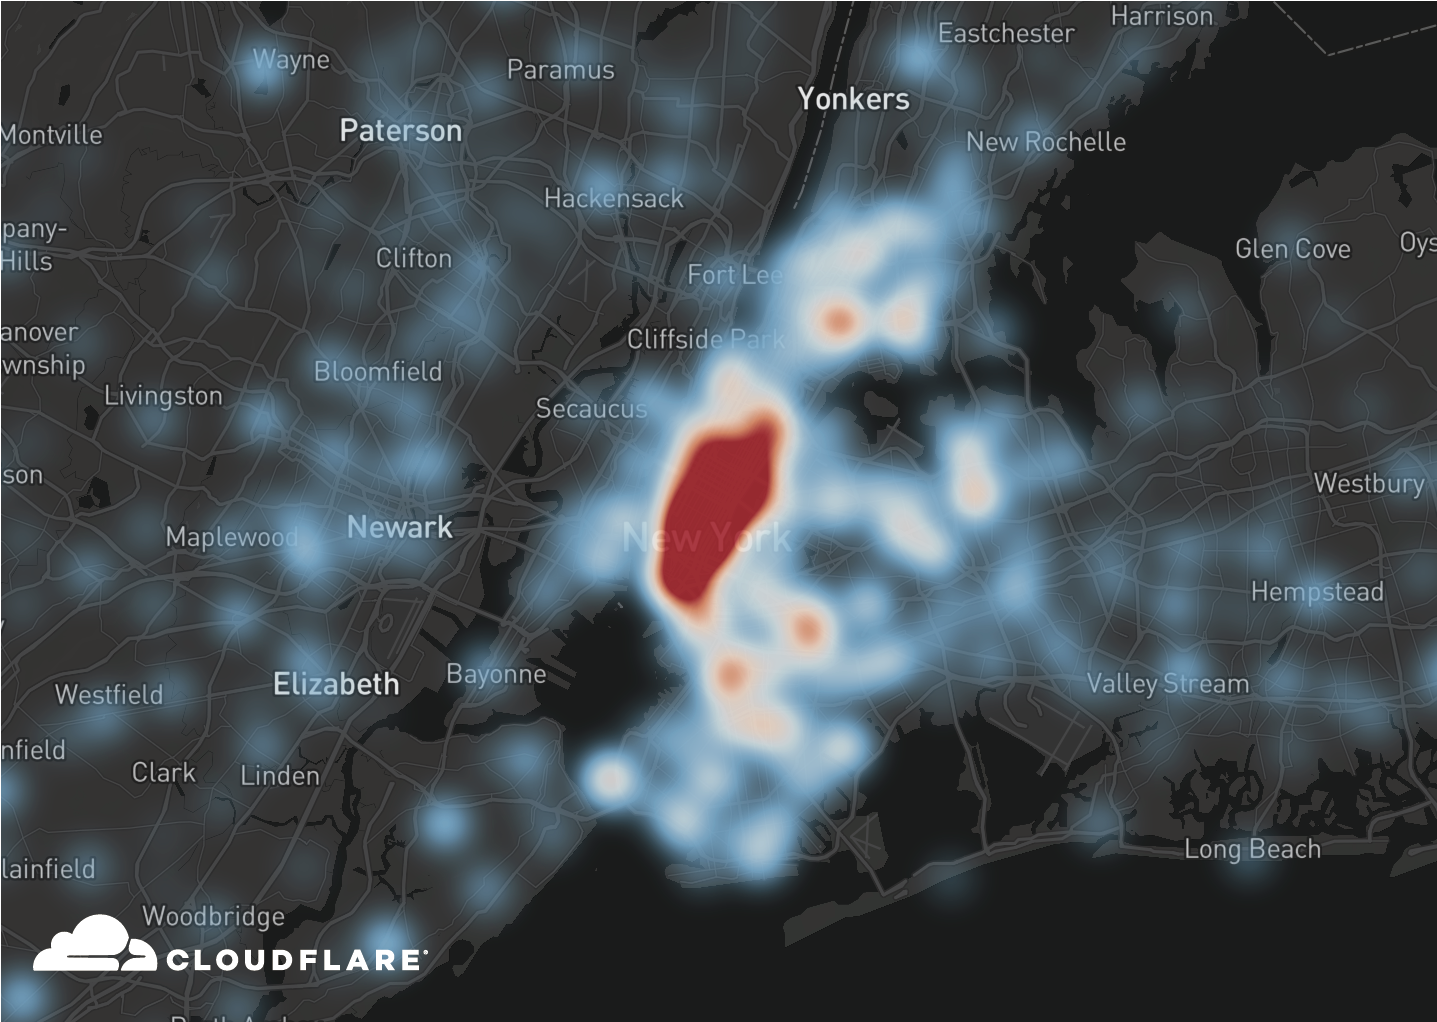
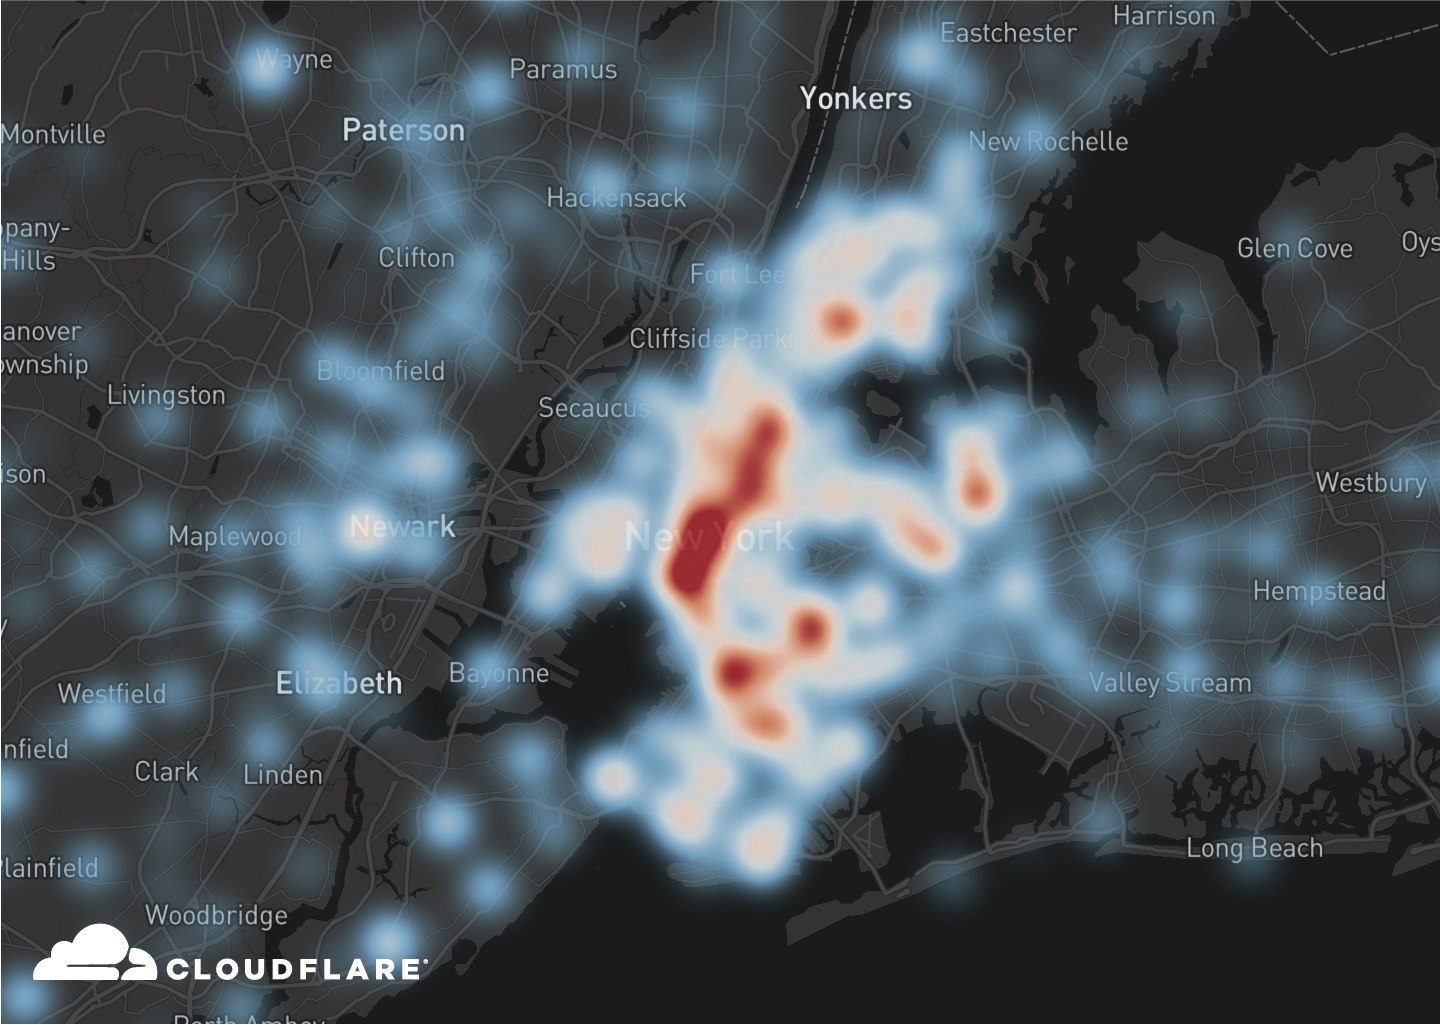
But the migration pattern really jumps forward when producing a differential heatmap of these two dates:
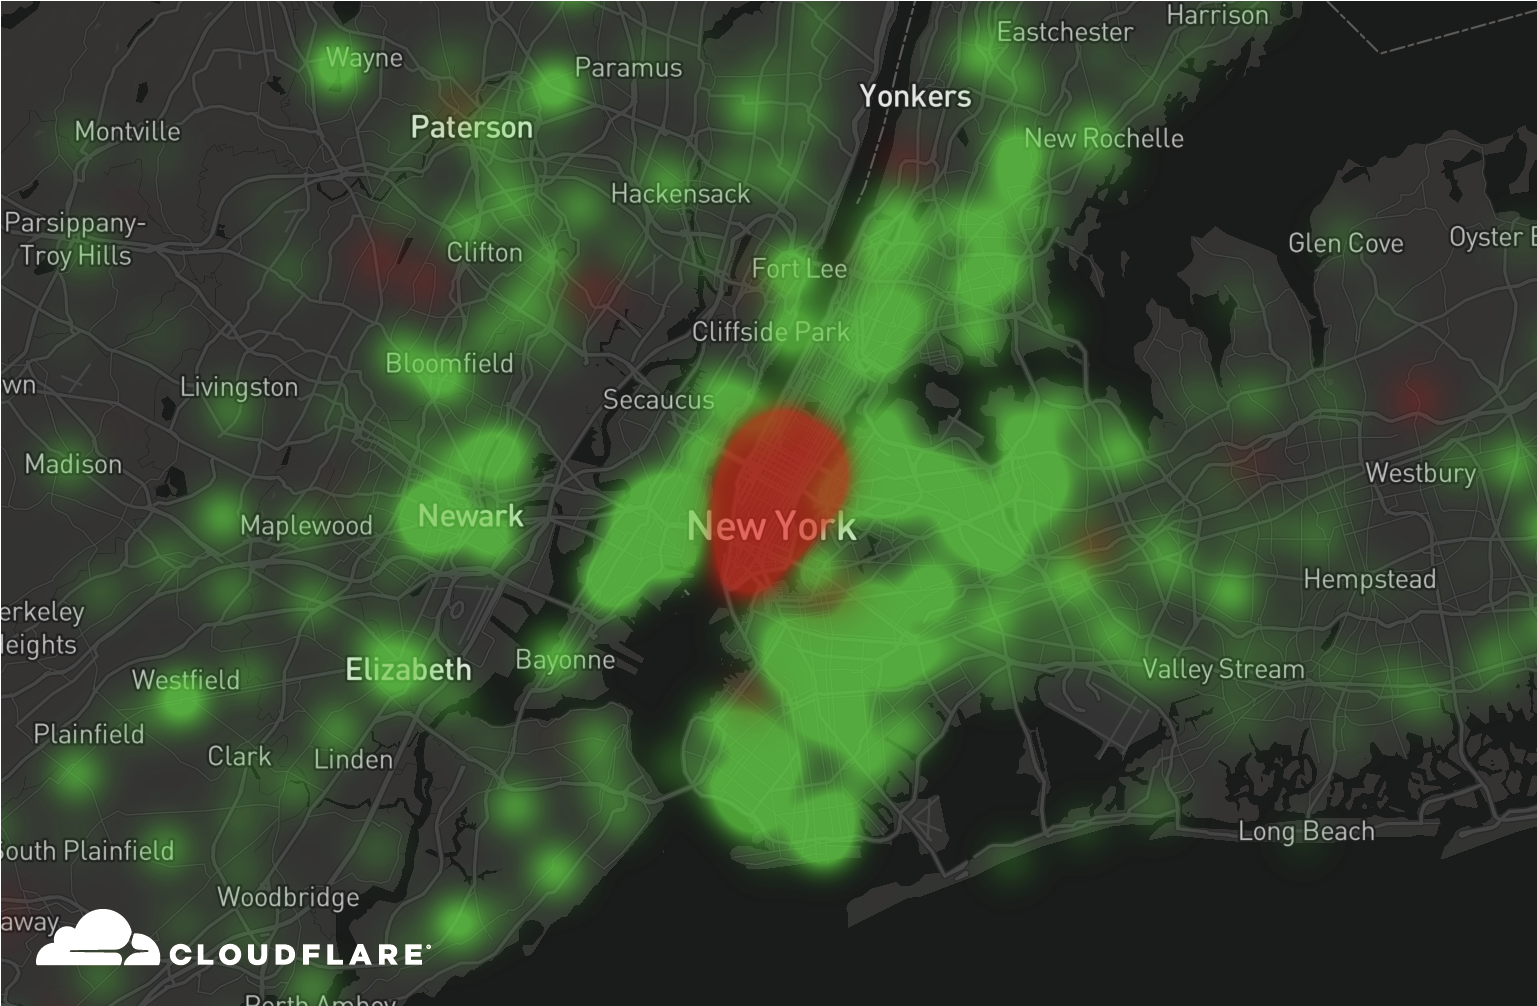
This chart shows a diff of the “before” and “after” scenarios, highlighting only differences in volume between the two dates. The red color represents areas where Internet usage has decreased since February 19, and green where it has increased.
It strongly suggests a migration of Internet usage towards suburban and residential areas.
The data used is comparing working hours periods (1000 to 1600 local time) between two Wednesdays four weeks apart (February 19 and March 18).
Cities
We produced similar visual representations for other impacted locations around the world. All exhibit similar migration patterns.
Seattle, US
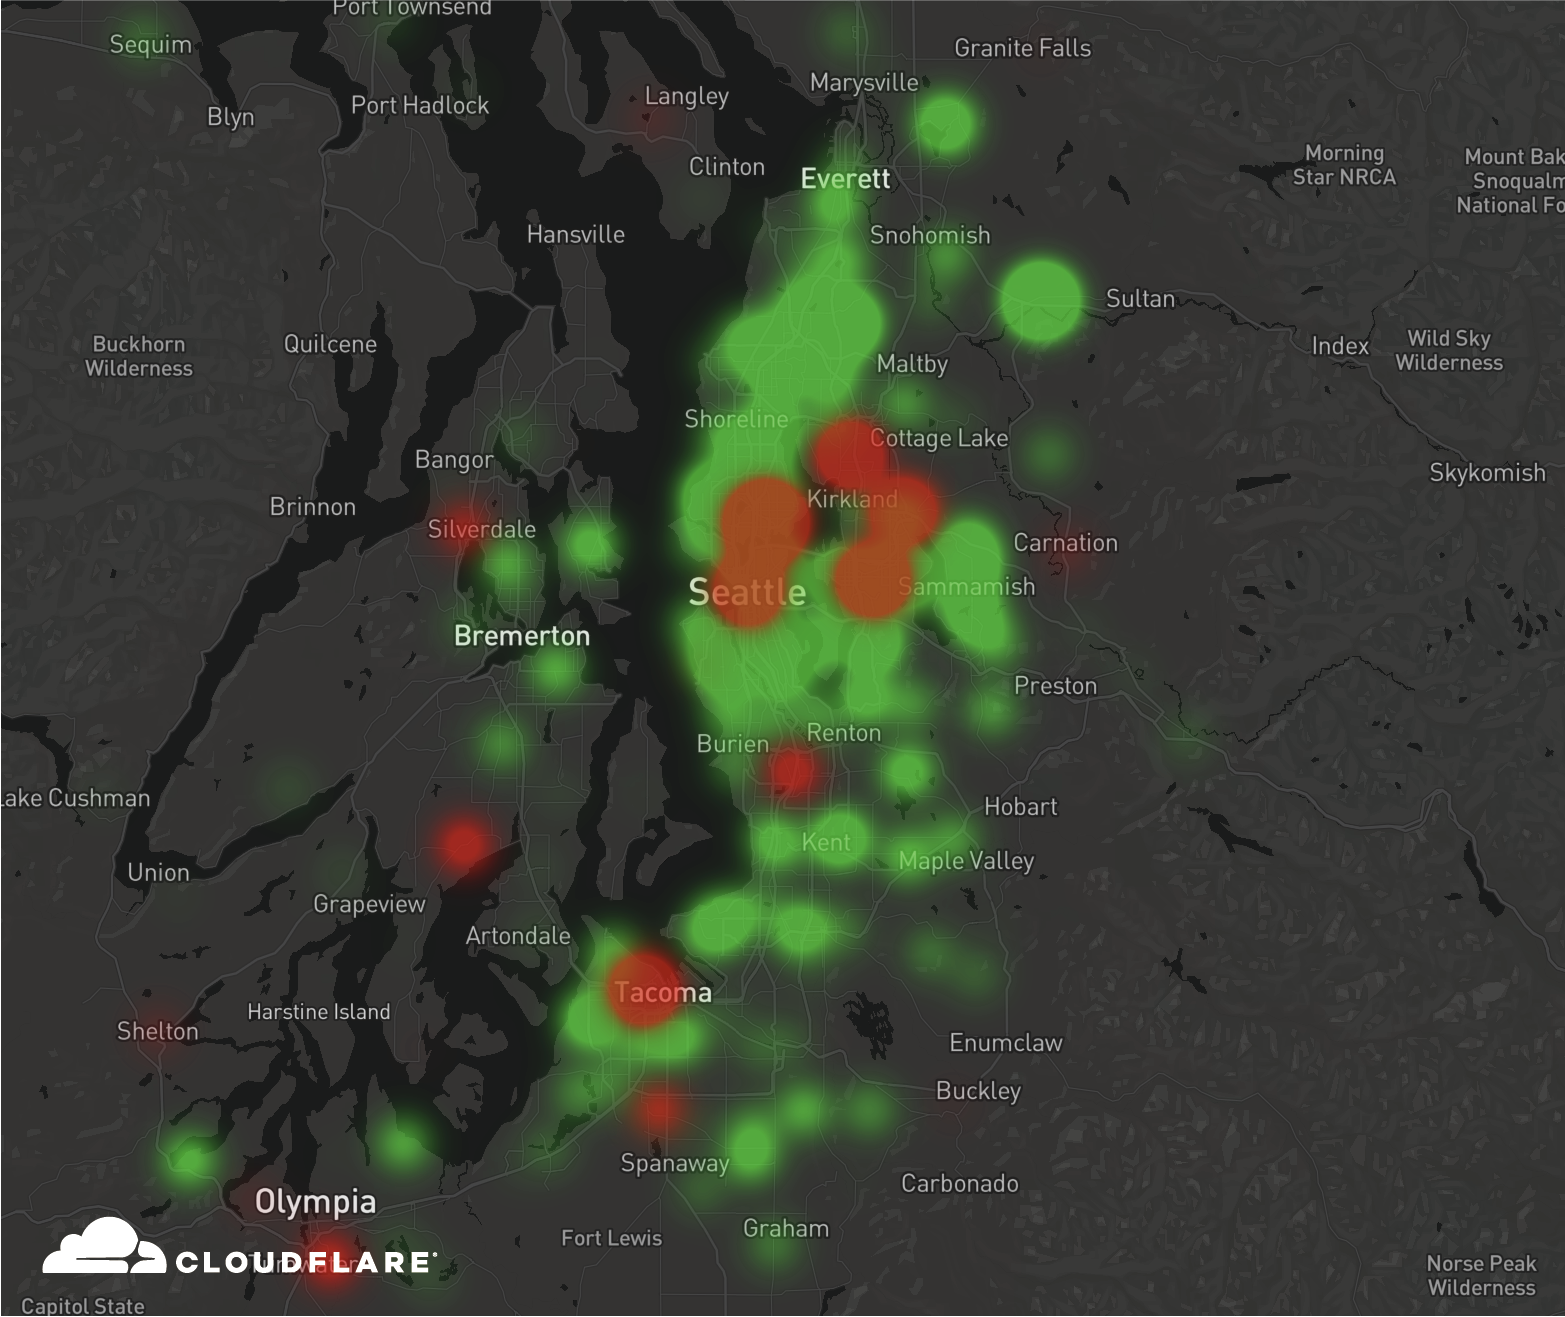
Additional features can be picked out from the chart. The red dot in Silverdale, WA appears to be Internet access from the Kitsap Mall (which is currently closed). And Sea-Tac Airport is seen as a red area between Burien and Renton.
San Francisco Bay Area, US
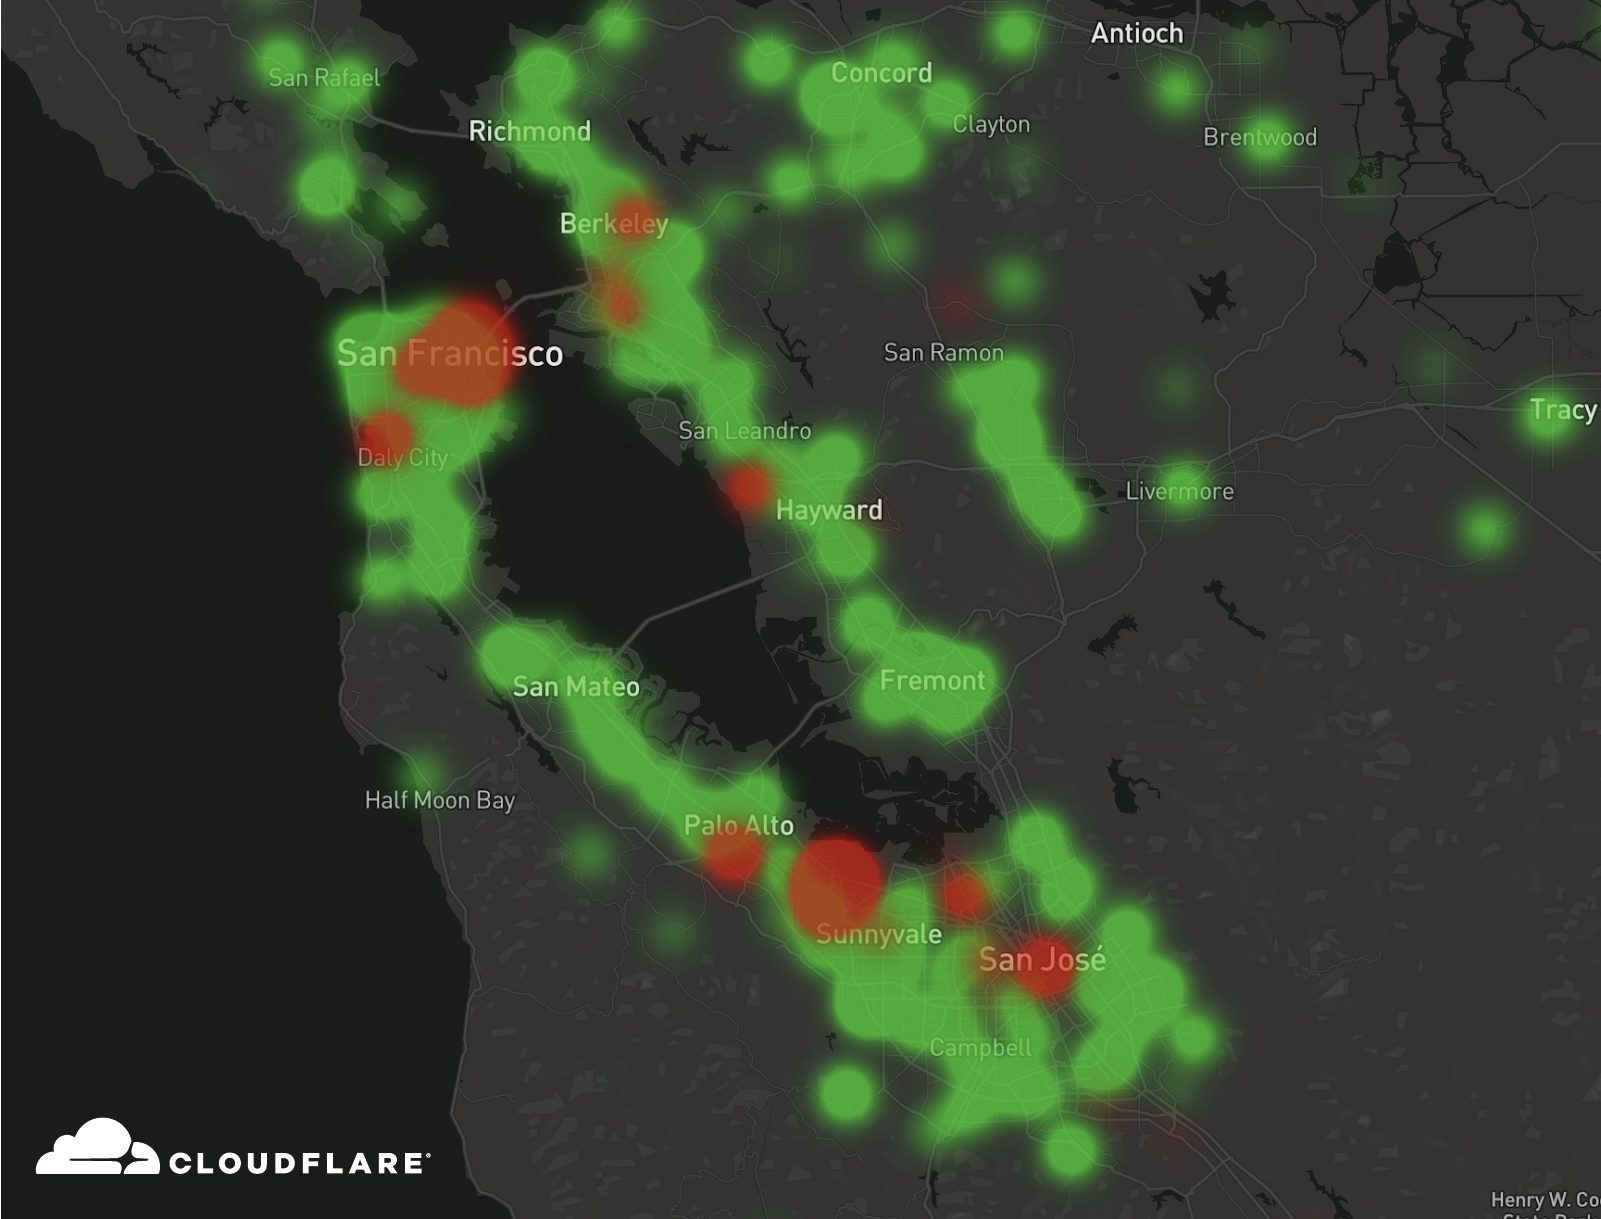
Areas where large Silicon Valley businesses have sent employees home are clearly visible.
Paris, France
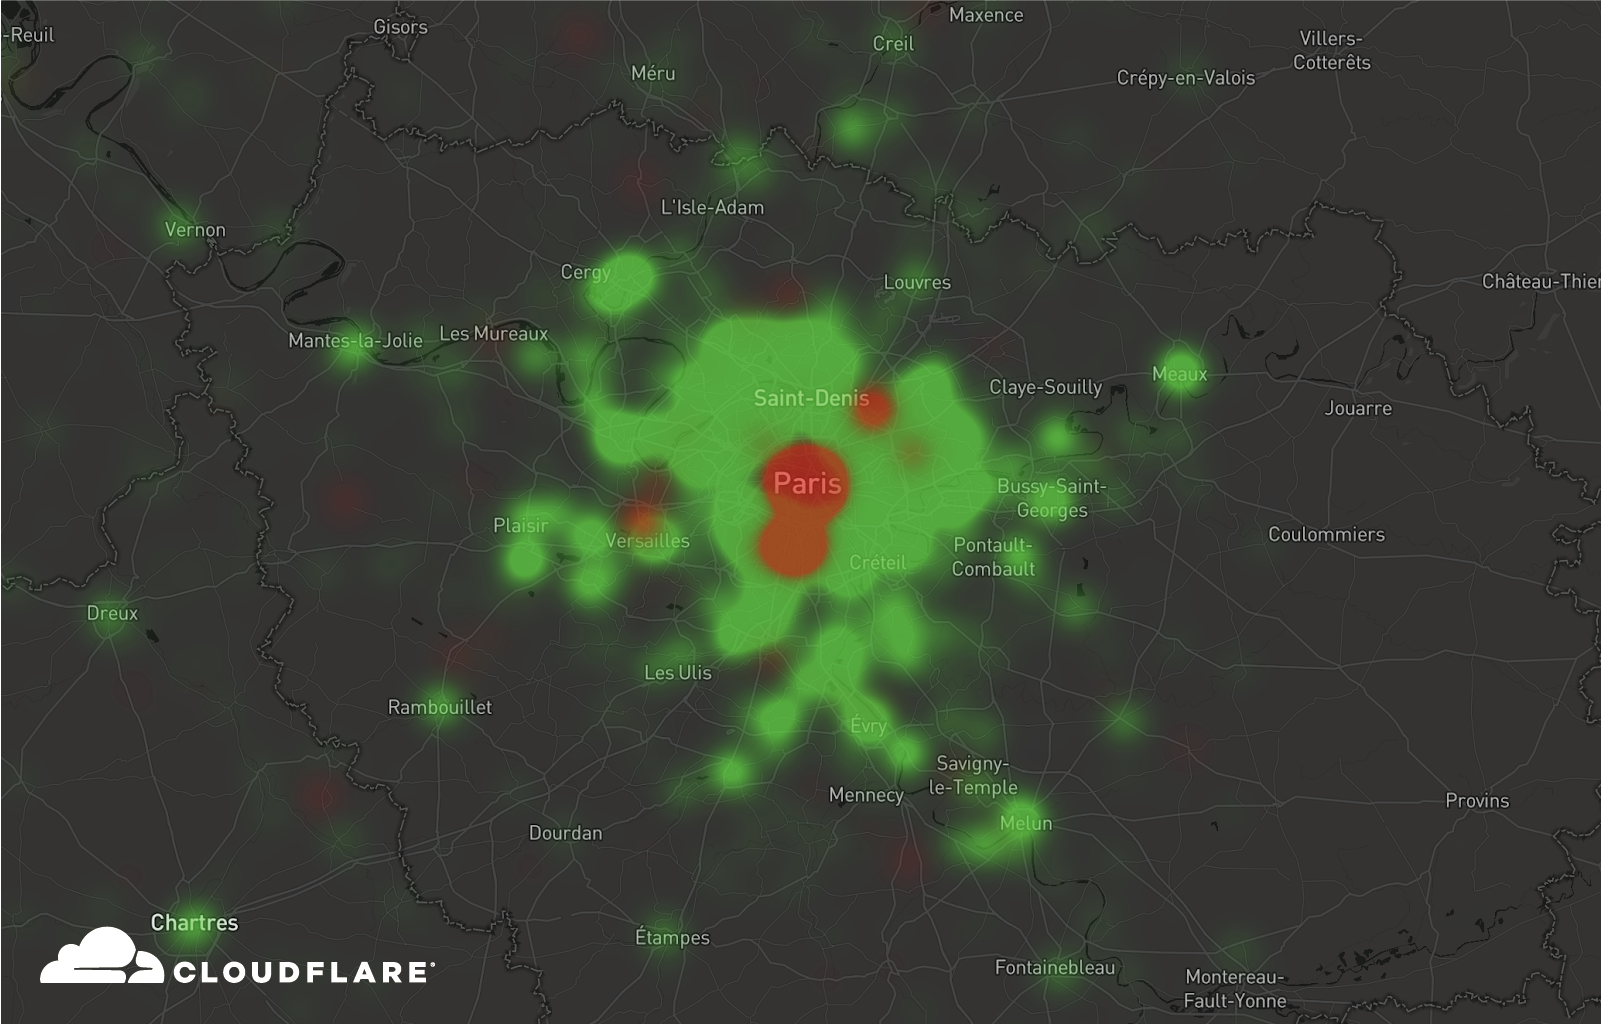
The red area in north east Paris appears to be the airport at Le Bourget and the surrounding industrial zone. To the west there’s another red area: Le Château de Versailles.
Berlin, Germany
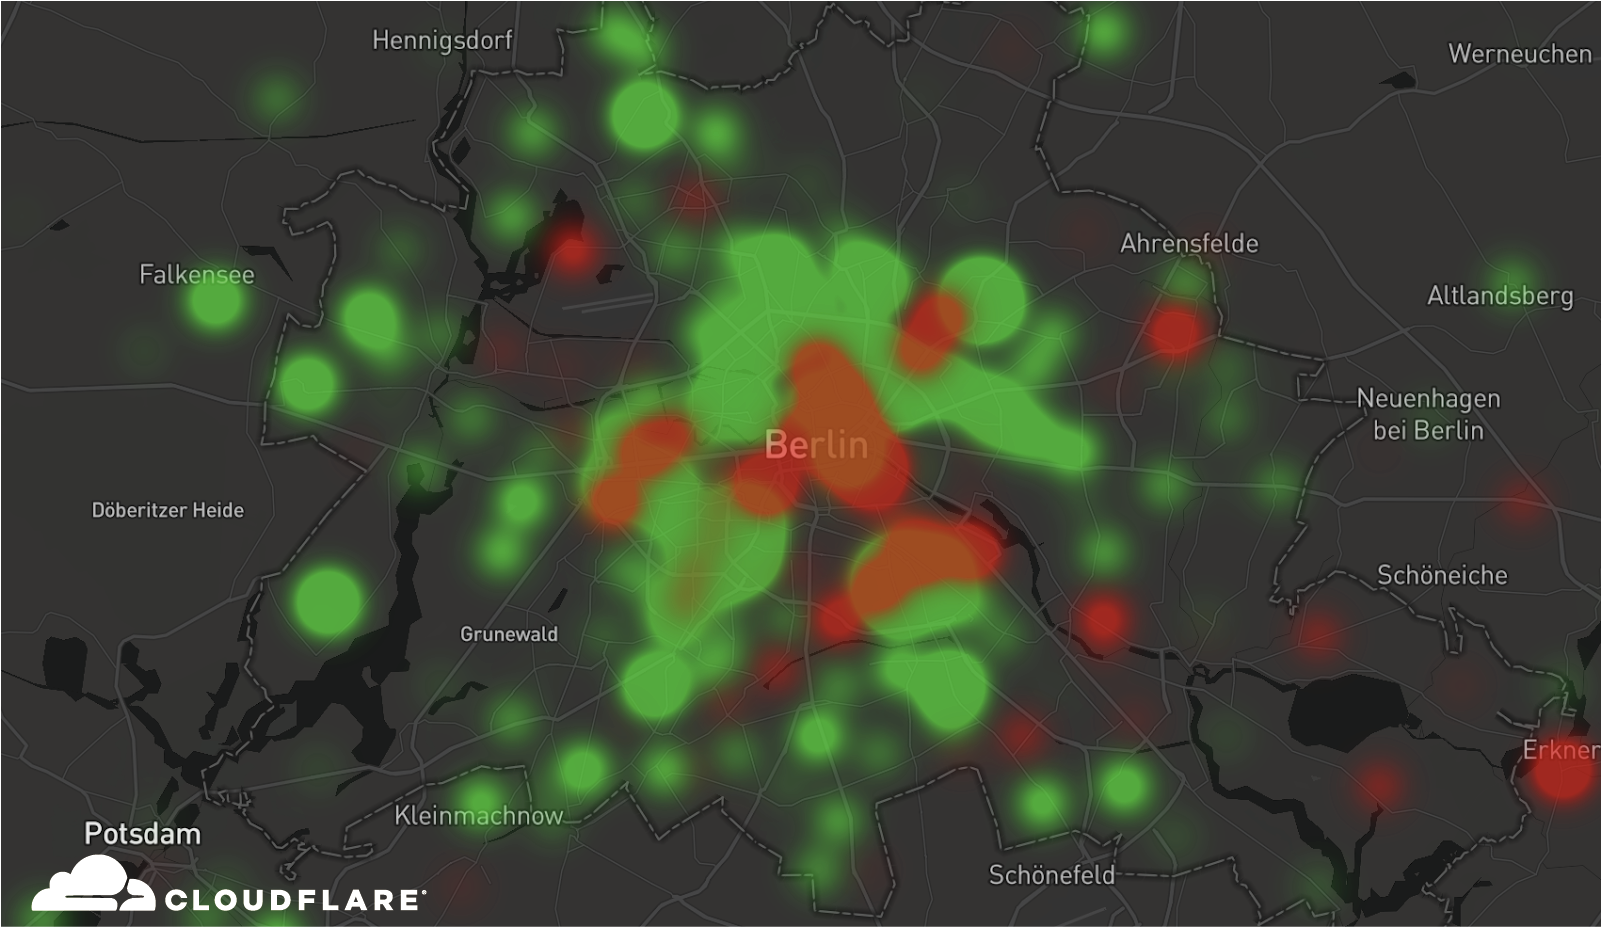
In Berlin a red dot near the Tegeler See is Flughafen Berlin-Tegel likely resulting from fewer passengers passing through the airport.
Network Impact
As shown above, geographical Internet usage changes are visible from Internet traffic exchanged between end users and Cloudflare at various locations around the globe.
Besides the geographical migration in various metropolitan areas, the overall volume of traffic in these locations has also increased between 10% and 40% in just a period of four weeks.
It’s interesting to reflect that the Internet was originally conceived as a communications network for humanity during a crisis, and it’s come a long way since then. But in this moment of crisis, it’s being put to use for that original purpose. The Internet was built for this.
Cloudflare helps power a substantial portion of Internet traffic. During this time of increased strain on networks around the world, our team is working to ensure our service continues to run smoothly.
We are also providing our Cloudflare for Teams products at no cost to companies of any size struggling to support their employees working from home: learn more.

