In September 2021, we shared extensive benchmarking results of 1,000 networks all around the world. The results showed that on a range of tests (TCP connection time, time to first byte, time to last byte), and on different measures (p95, mean), Cloudflare was the fastest provider in 49% of networks around the world. Since then, we’ve worked to continuously improve performance, with the ultimate goal of being the fastest everywhere and an intermediate goal to grow the number of networks where we’re the fastest by at least 10% every Innovation Week. We met that goal during Security Week (March 2022), and we’re carrying the work over to Platform Week (May 2022).
We’re excited to update you on the latest results, but before we do: after running with this benchmark for nine months, we've also been looking for ways to improve the benchmark itself — to make it even more representative of speeds in the real world. To that end, we're expanding our measured networks from 1,000 to 3,000, to give an even more accurate sense of real world performance across the globe.
In terms of results: using the old benchmark of 1,000 networks, we’re the fastest in 69% of them. In this new expanded view of 3,000 networks, we’re the fastest in 42% of them. We’ve demonstrated a consistent ability to improve our performance against what we measure, and we’re excited to optimize our performance and lift our ranking in these smaller networks all around the world.
In addition to sharing a general update on where our network performance stands, we’re also sharing updated performance metrics on our Workers platform (given that it’s Platform Week!). We’ve done an extensive benchmark of Cloudflare Workers vs Fastly’s Compute@Edge.
We’ve got the results below, but before we get to that, we want to spend a bit of time on our revamped measurements.
Revamped measurements
A few months ago, we discussed the performance of Cloudflare Workers, as compared to other similar offerings out there. We compared our performance to Fastly’s Compute@Edge, showing that Workers was significantly faster.
After we published our results, there were questions and suggestions on how to improve our testing methodology (including sharing more detail about where and how we ran the tests). As we re-ran tests for this iteration, we made some small changes, and also worked to address the suggestions from the community. Let’s talk about what’s changed and why.
Measuring what matters
To quantify global network performance, we have to get enough data from around the world, across all manner of different networks, comparing ourselves with other providers. We used Real User Measurements (RUM) to fetch a 100kB file from different providers. Users around the world report the performance of different providers. The more users who report the data, the higher fidelity the signal is. The goal is to provide an accurate picture of where different providers are faster, and more importantly, where Cloudflare can improve. You can read more about the methodology in the original Speed Week blog post here.
In the process of quantifying network performance, it became clear where we needed to expand our scope in measuring performance. After Security Week, we were fastest in 71% of networks, and we decided that we wanted to expand the pool of networks from the top 1,000 most reported networks to the top 3,000 most reported networks.
We’ve shown the graph detailing the number of networks where Cloudflare is #1 in network performance, but from here on out, we will only be showing this graph in percentages of networks where we are number one out of 100%, since the denominator will be changing going forward as we set ourselves harder and harder challenges.
Benchmarking for everyone
At the time we published our earlier set of benchmarks, we had an unnecessary “no benchmarking” clause in our Terms of Service. It has since been removed. It’s been a while since we’ve worried about such things, and the clause lived past its intended life in our ToS.
We’ve done the work to show where we are the fastest provider, and it’s important that everyone else be able to validate that independently. We’re also confident that well run benchmarks will only help further improve performance for Workers, other Cloudflare products, and the Internet as a whole. Game on.
Measuring Workers performance from real users
To run our tests, we used Catchpoint, an industry standard “synthetic” testing tool, and measurements collected from real users distributed around the world. Catchpoint is a monitoring platform that has around 2,000 total endpoints distributed around the world that can be configured to fetch specific resources and time each test. Catchpoint is useful for network providers like us as it provides a consistent, repeatable way to measure end-to-end performance of a workload, and delivers a best-effort approximation for what a user sees.
Catchpoint has a series of backbone nodes that are embedded in ISPs around the world. That means that these nodes are plugged into ISP routers just like you are, and the traffic goes through the ISP network to each endpoint they are monitoring. These can approximate a real user, but they will never truly approximate a real user. For example, the bandwidth for these nodes is 100% dedicated for platform monitoring, as opposed to your home Internet connection, where your Internet experience will be a mixed bag of different use cases, some of which won’t talk to Workers applications at all.
For this new test, we chose 300 backbone nodes that are embedded in last mile ISPs around the world. We filtered out nodes in cloud providers, or in metro areas with multiple transit options, trying to remove duplicate paths as much as possible.
We cross-checked these tests with our own data set, which is collected from users connecting to free websites when they are served 1xxx error pages, similar to how we collect data for global network performance. When a user sees this error page, that page will contain a call that will execute these tests and upload performance metrics on these calls to Cloudflare. Users would run these calls independently of the error page, ensuring that Cloudflare did not get a head start in these tests.
We also changed our test methodology to use paid accounts for both Fastly and Cloudflare.
Changing the numbers we look at
For this new test, we decided to look at Wait time in addition to Time to First Byte. Time to First Byte is the time it takes for a web server to establish a connection, fetch the content, and deliver the first byte of a response to a user, and Wait time is the time the client spends waiting for the server to send back that first byte after the connection is established. We are using this particular measurement to look at the actual time it takes for the server to compute the request on the machine. Wait time is a subcomponent of TTFB, and contains the machine processing time, the time it takes the server to give the response to the socket to be sent back to the user, and the time it takes the response to reach the user. There could be latency in passing the request to the socket on the machine, but we measured the actual time it took the server to send the request for all tests and found it to be zero:

So we would calculate the wait time as the amount of time spent on the box plus the time it took the server to send the packet over the wire to the client.
However, others have noted that using Time to First Byte to measure performance of serverless computing solutions could potentially be misleading because user performance measurements can be influenced by more than just the time spent computing functions on the machine. For example, things like the time to connect to the server, DNS resolution, and cache times can impact Time to First Byte. Time to connect to the server (connect) can be impacted by how well peered a network is (or how poorly). DNS resolution can be impacted by client behavior, local DNS behavior, or by the performance of the provider’s DNS. Cache times can be driven by the performance of the cache on the server itself.
We agree that it is difficult to tease out computing time from Time to First Byte. To look at that particular aspect of serverless computing, we look at Wait, which is a value that contains the least amount of variables: we aren’t caching anything during our tests, DNS isn’t part of the wait time, and the only thing impacting Wait aside from the time spent on the machine is the Connect time.
However, since we’re trying to measure the end user experience and not just the amount of time spent on a server, we want to use both the Wait and TTFB so that we can show the time spent both on the server and how that impacts end-to-end performance.
What’s in the test?
For our test this time around, we decided to measure three things: a simple JavaScript function like last time, a complex JavaScript function, and a complex Rust function. Here are the functions for each of them:
async function getErrorResponse(event, message, status) {
  return new Response(message, {status: status, headers: {'Content-Type': 'text/plain'}});
}
function testHardBusyLoop() {
  let value = 0;
  let offset = Date.now();

  for (let n = 0; n < 15000; n++) {
    value += Math.floor(Math.abs(Math.sin(offset + n)) * 10);
  }

  return value;
}
fn test_hard_busy_loop() -> i32 {
  let mut value = 0;
  let offset = Date::now().as_millis();

  for n in 0..15000 {
    value += (((offset + n) as f64).sin().abs() * 10.0) as i32;
  }

  value
}
The goals of each of these tests is simple: test the ability of Workers and Compute@Edge to perform compute actions.
Latest update on network performance
We have two updates on data: a general network performance update, and then data on how Workers compares with Compute@Edge.
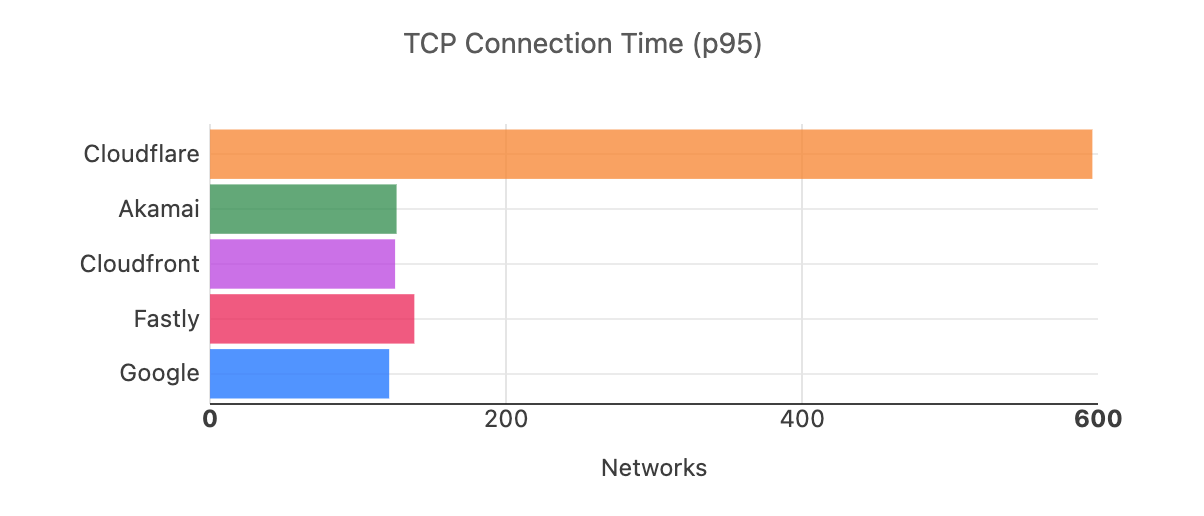
At Security Week (March 2022), we shared that we were faster in more of the most reported networks than our competitors. Out of the top 1,000 networks in the world (by number of IPv4 addresses advertised), here’s a breakdown of how many providers are number one in p95 TCP Connection Time, which represents the time it takes for a user to connect to the provider. This data is from Security Week (March 2022):
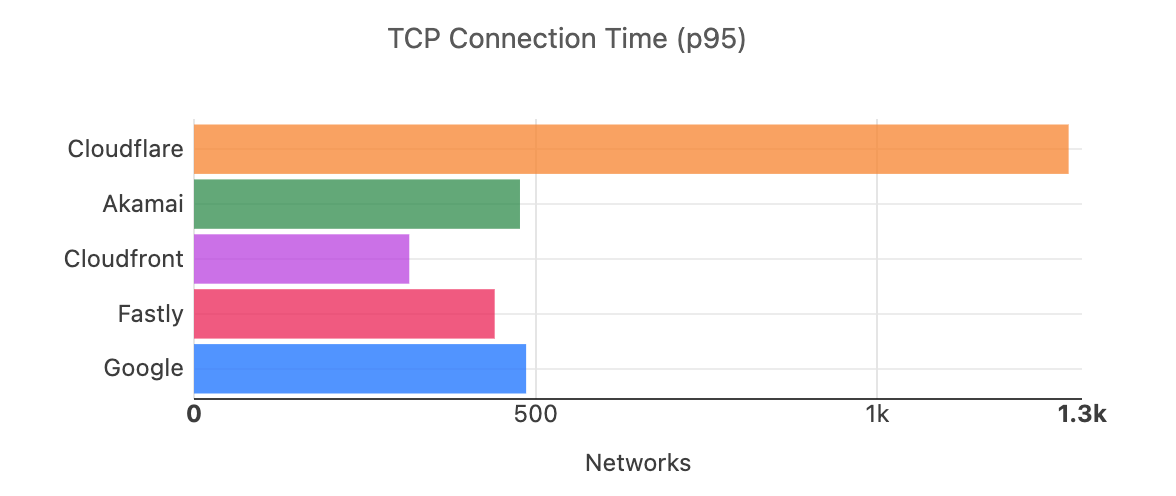
Recognizing that we are now looking at different numbers of networks, here is what the distribution looks like for the top 3,000 networks for Platform Week (May 2022):
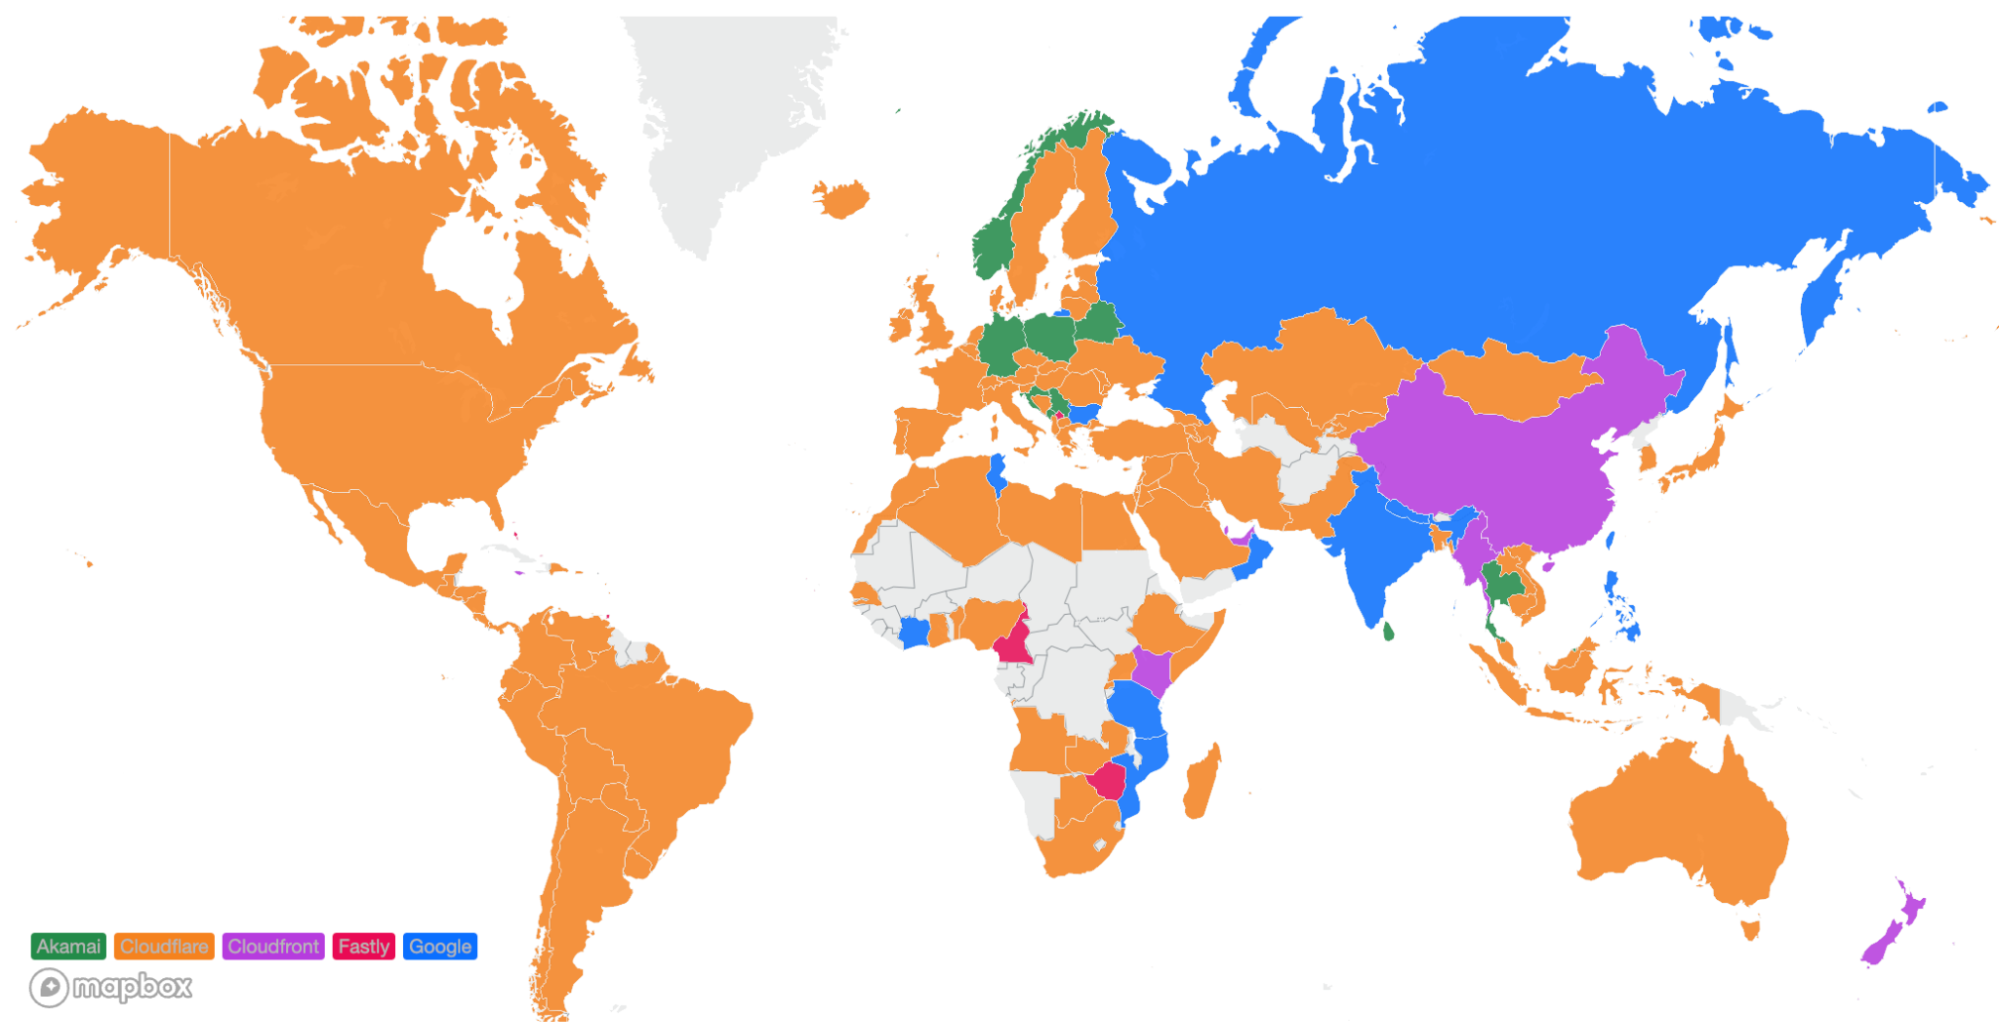
In addition to being the fastest across popular networks, Cloudflare is also committed to being the fastest provider in every country.
Using data on the top 1,000 networks from Full Stack Week (March 2022), here’s what the world map looks like:
And here’s what the world looks like while looking at the top 3,000 networks:

Cloudflare became #1 in more countries in Africa and Europe, some of which previously did not have enough samples to officially be counted to one provider or another.
Workers vs Compute@Edge
Moving on from general network results, what does performance look like when comparing serverless compute products across providers — in this case, Cloudflare Workers performance to Compute@Edge? Looking at the Catchpoint data, the first thing we noticed was Cloudflare is faster than Fastly in all tests at the 95th percentile for Time to First Byte:
| Test | 95th percentile TTFB (ms) |
|---|---|
| Cloudflare JS no-op | 469 |
| Fastly JS no-op | 596 |
| Cloudflare JS hard | 481 |
| Fastly JS hard | 631 |
| Cloudflare Rust hard | 493 |
| Fastly Rust hard | 577 |
Cloudflare is significantly faster at all tests compared to Fastly. But let’s dig into why that is. Looking at p95 Wait, we can see that Cloudflare does have an edge in most tests related to compute on-box:

| Test | 95th Percentile Wait (ms) |
|---|---|
| Cloudflare JS no-op | 123 |
| Fastly JS no-op | 123 |
| Cloudflare JS hard | 136 |
| Fastly JS hard | 170 |
| Cloudflare Rust hard | 160 |
| Fastly Rust hard | 121 |
Looking at the Wait times, you can see that Cloudflare does have a significant edge in on-box performance, except in Rust, where Fastly claims their workloads are the most optimized. This data backs up that claim. But why is Fastly so much slower on Time to First Byte? The answer lies in the rest of the request. While latency spent in compute matters, it only matters in conjunction with the rest of the network performance. And Cloudflare has an advantage over Fastly in Connect times and SSL establishment times:
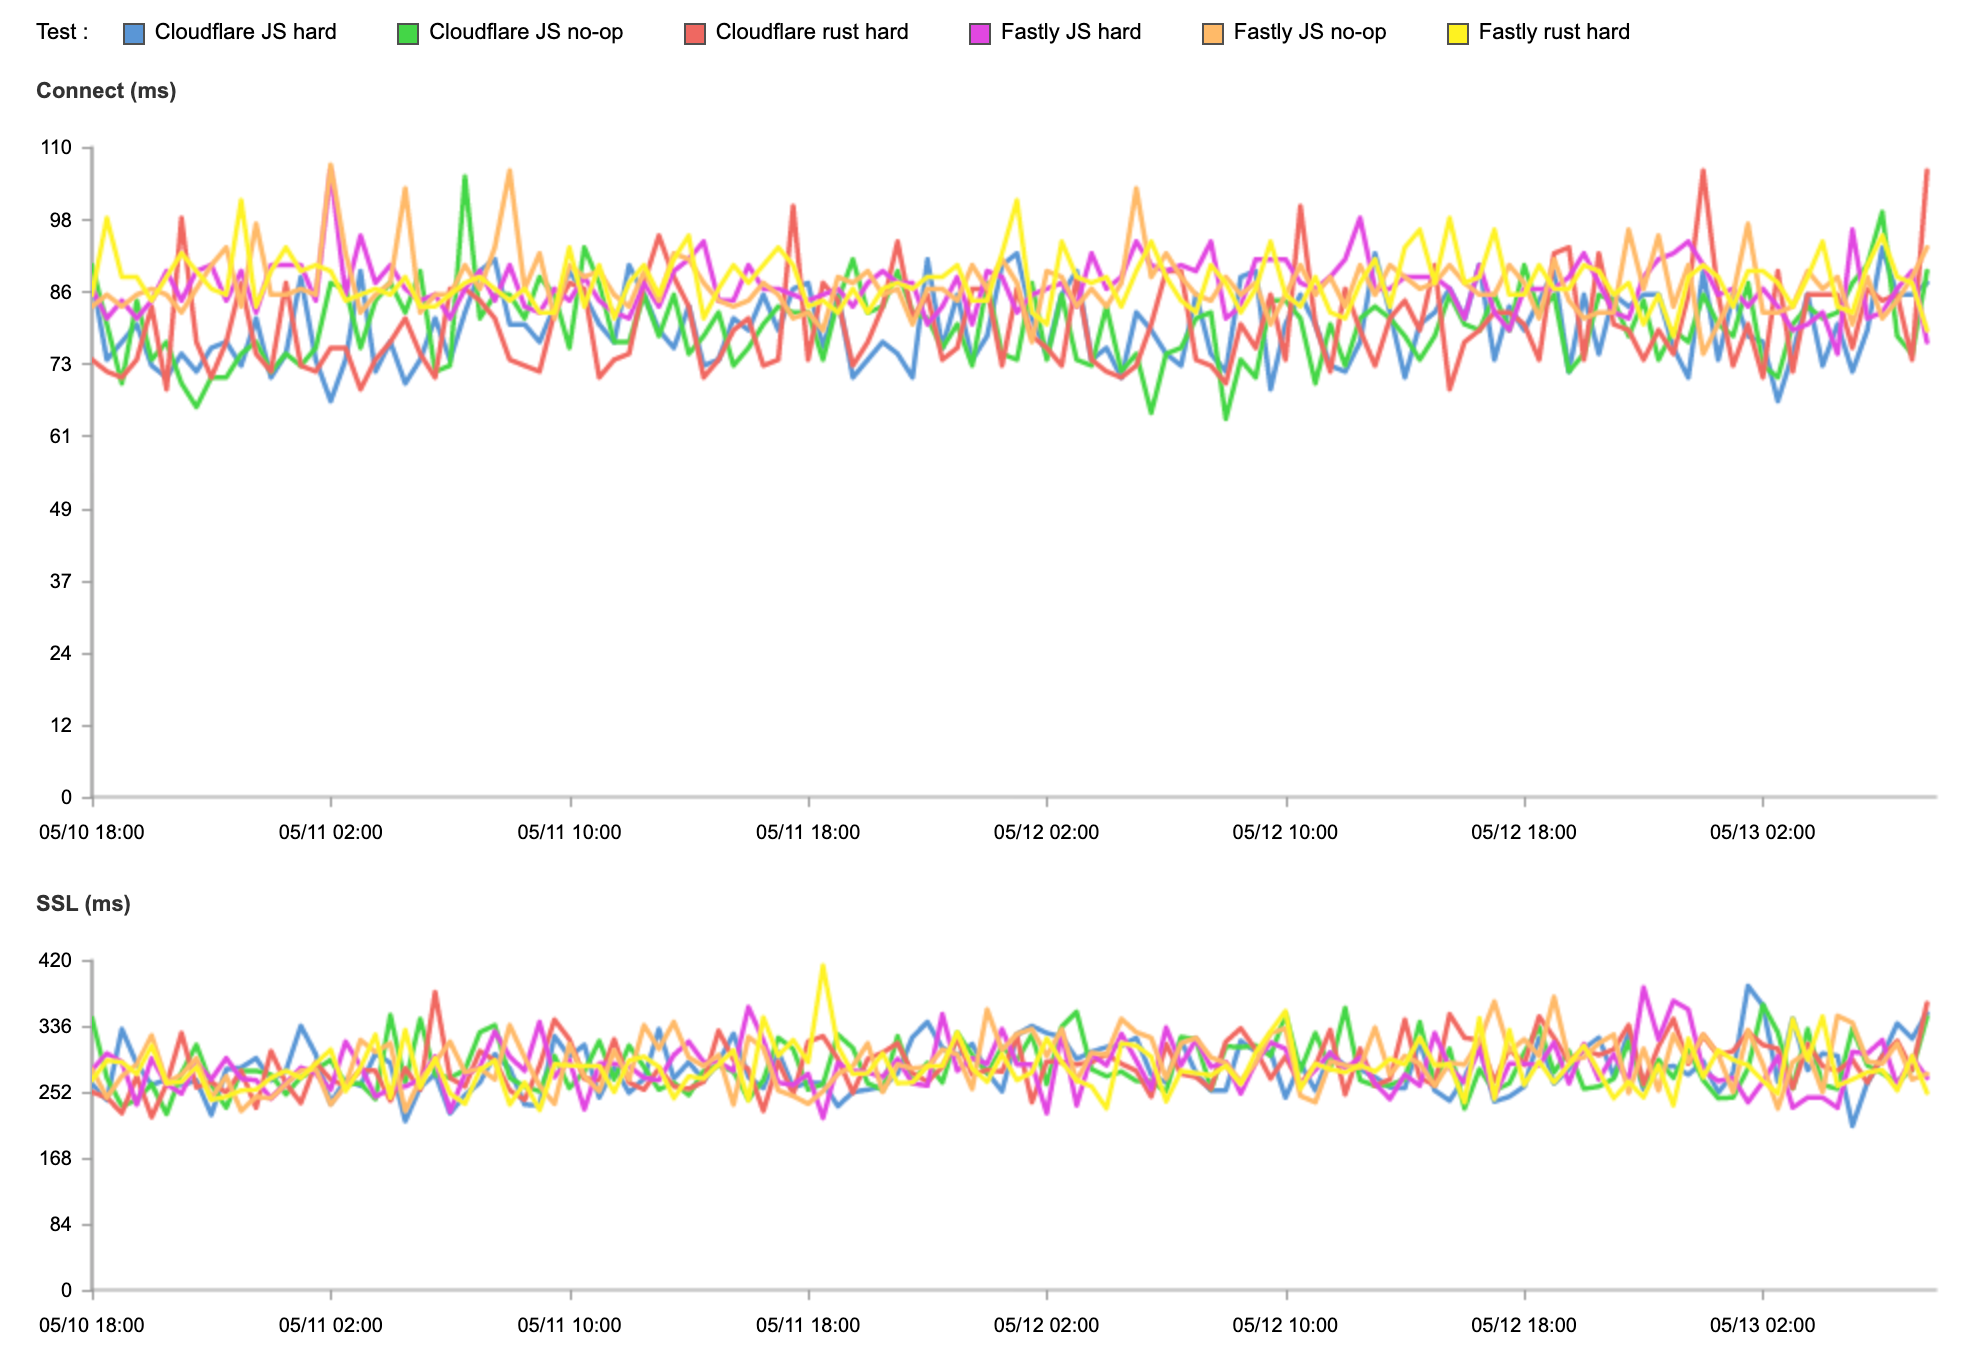
| Test | 95th Percentile Connect (ms) | 95th Percentile SSL (ms) |
|---|---|---|
| Cloudflare JS no-op | 81 | 289 |
| Fastly JS no-op | 88 | 293 |
| Cloudflare JS hard | 81 | 286 |
| Fastly JS hard | 88 | 291 |
| Cloudflare Rust hard | 81 | 288 |
| Fastly Rust hard | 88 | 295 |
Cloudflare’s hyper-optimized web stack allows us to process all requests faster, meaning that Workers code gets started faster. Having that extra head start in Connect and SSL allows us to further increase the distance between us and Compute@Edge.
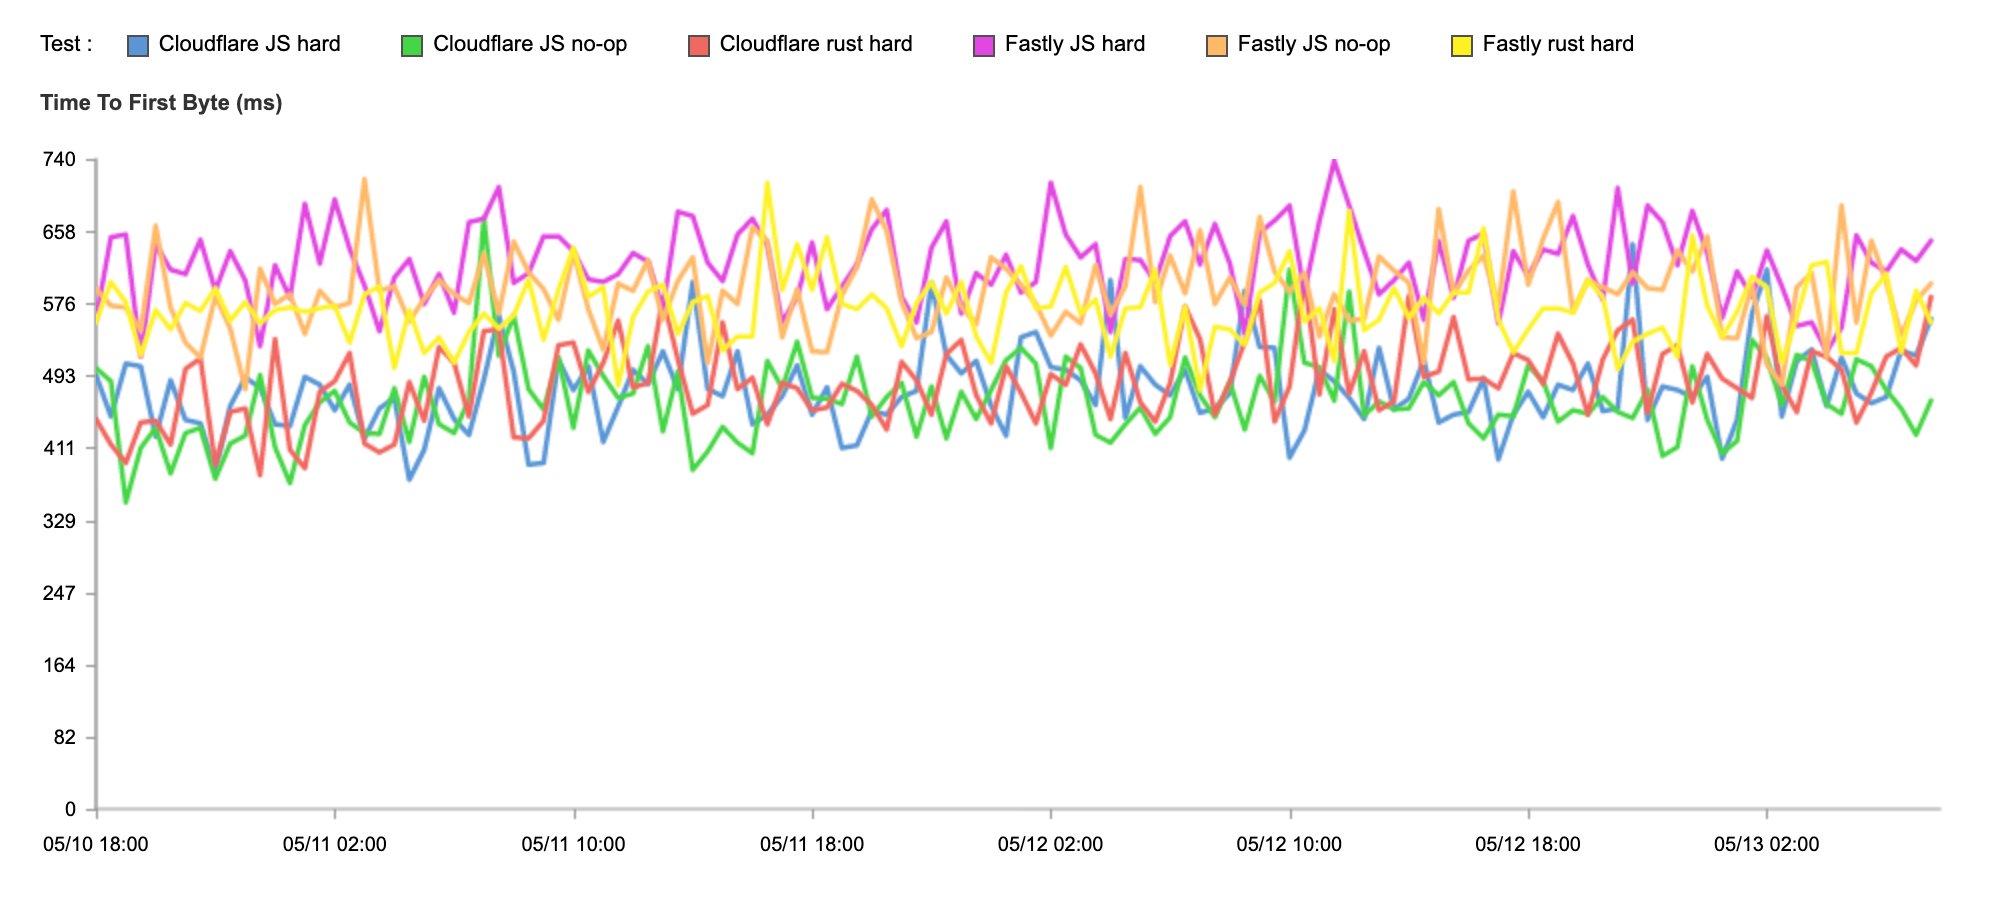
To verify these results, we compared the Catchpoint results to our own data set. Here is the p95 TTFB for the JavaScript and Rust hard loops for both Fastly and Cloudflare from our data:

As you can see, Cloudflare is faster on JavaScript and Rust calls. And when you look at wait time, you will see that outside of Catchpoint results, Cloudflare even beats Fastly in the Rust hard tests:

The big takeaway from this is that in addition to Cloudflare being faster for the time spent processing requests, Cloudflare’s network and performance optimizations as a whole set us apart and make our Workers platform even faster.
A fast network makes for a faster developer platform
Cloudflare’s commitment to building the fastest network allows us to deliver unparalleled performance for all applications, including our developer tools. Whether it’s by accelerating Cloudflare Pages performance by hosting on every single Cloudflare server, or by deploying Workers in 275 cities without developers needing to configure a thing, Cloudflare’s developer tools are all built on top of Cloudflare’s global network. We’re committed to making our network faster so that our developer products are as performant as they could possibly be.
And it’s not just the developer platform. Cloudflare runs an integrated and optimized stack that includes DDoS protection, WAF, rate limiting, bot management, caching, SSL, smart routing, and more. By having a single software stack we are able to offer the widest range of features while ensuring that performance (no matter which of our products you use) remains excellent. We don’t want you to have to compromise performance to get security or vice versa.

