
Cloudflare has a unique vantage point on the Internet. From this position, we are able to see, explore, and identify trends that would otherwise go unnoticed. In this report we are doing just that and sharing our insights into Internet-wide application security trends.
This report is the third edition of our Application Security Report. The first one was published in March 2022, with the second published earlier this year in March, and this is the first to be published on a quarterly basis.
Since the last report, our network is bigger and faster: we are now processing an average of 46 million HTTP requests/second and 63 million at peak. We consistently handle approximately 25 million DNS queries per second. That's around 2.1 trillion DNS queries per day, and 65 trillion queries a month. This is the sum of authoritative and resolver requests served by our infrastructure. Summing up both HTTP and DNS requests, we get to see a lot of malicious traffic. Focusing on HTTP requests only, in Q2 2023 Cloudflare blocked an average of 112 billion cyber threats each day, and this is the data that powers this report.
But as usual, before we dive in, we need to define our terms.
Definitions
Throughout this report, we will refer to the following terms:
Mitigated traffic: any eyeball HTTP* request that had a “terminating” action applied to it by the Cloudflare platform. These include the following actions:
BLOCK,CHALLENGE,JS_CHALLENGEandMANAGED_CHALLENGE. This does not include requests that had the following actions applied:LOG,SKIP,ALLOW. In contrast to last year, we now exclude requests that hadCONNECTION_CLOSEandFORCE_CONNECTION_CLOSEactions applied by our DDoS mitigation system, as these technically only slow down connection initiation. They also accounted for a relatively small percentage of requests. Additionally, we improved our calculation regarding theCHALLENGEtype actions to ensure that only unsolved challenges are counted as mitigated. A detailed description of actions can be found in our developer documentation.Bot traffic/automated traffic: any HTTP* request identified by Cloudflare’s Bot Management system as being generated by a bot. This includes requests with a bot score between 1 and 29 inclusive. This has not changed from last year’s report.
API traffic: any HTTP* request with a response content type of
XMLorJSON. Where the response content type is not available, such as for mitigated requests, the equivalentAcceptcontent type (specified by the user agent) is used instead. In this latter case, API traffic won’t be fully accounted for, but it still provides a good representation for the purposes of gaining insights.
Unless otherwise stated, the time frame evaluated in this post is the 3 month period from April 2023 through June 2023 inclusive.
Finally, please note that the data is calculated based only on traffic observed across the Cloudflare network and does not necessarily represent overall HTTP traffic patterns across the Internet.
* When referring to HTTP traffic we mean both HTTP and HTTPS.
Global traffic insights
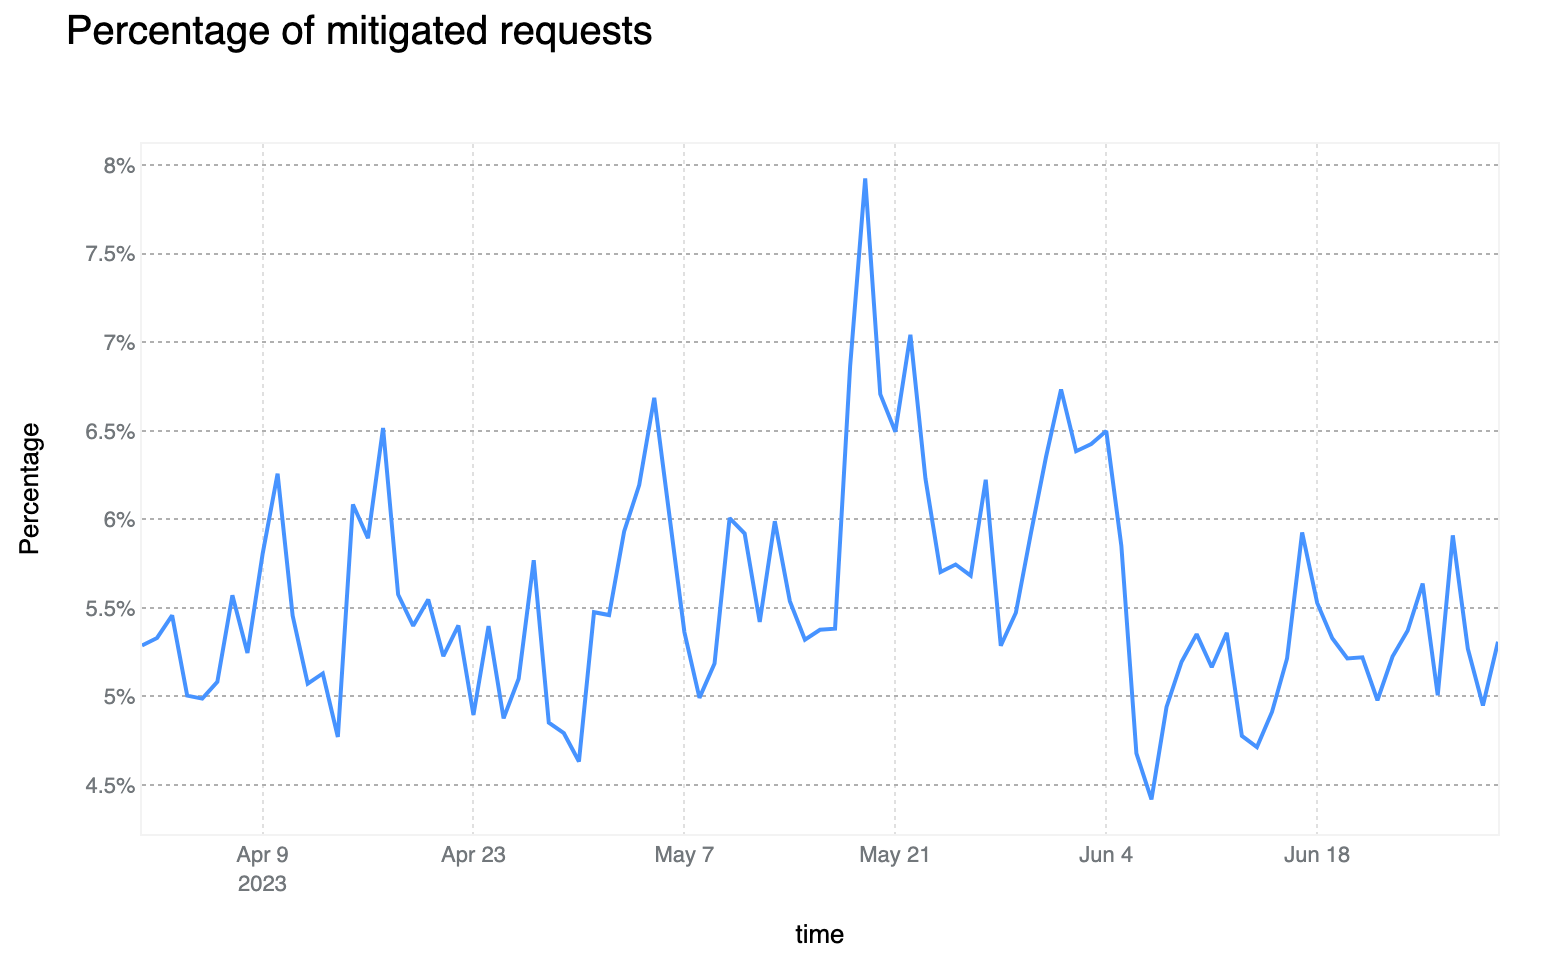
Mitigated daily traffic stable at 6%, spikes reach 8%
Although daily mitigated HTTP requests decreased by 2 percentage points to 6% on average from 2021 to 2022, days with larger than usual malicious activity can be clearly seen across the network. One clear example is shown in the graph below: towards the end of May 2023, a spike reaching nearly 8% can be seen. This is attributable to large DDoS events and other activity that does not follow standard daily or weekly cycles and is a constant reminder that large malicious events can still have a visible impact at a global level, even at Cloudflare scale.
75% of mitigated HTTP requests were outright BLOCKed. This is a 6 percentage point decrease compared to the previous report. The majority of other requests are mitigated with the various CHALLENGE type actions, with managed challenges leading with ~20% of this subset.
Shields up: customer configured rules now biggest contributor to mitigated traffic
In our previous report, our automated DDoS mitigation system accounted for, on average, more than 50% of mitigated traffic. Over the past two quarters, due to both increased WAF adoption, but most likely organizations better configuring and locking down their applications from unwanted traffic, we’ve seen a new trend emerge, with WAF mitigated traffic surpassing DDoS mitigation. Most of the increase has been driven by WAF Custom Rule BLOCKs rather than our WAF Managed Rules, indicating that these mitigations are generated by customer configured rules for business logic or related purposes. This can be clearly seen in the chart below.
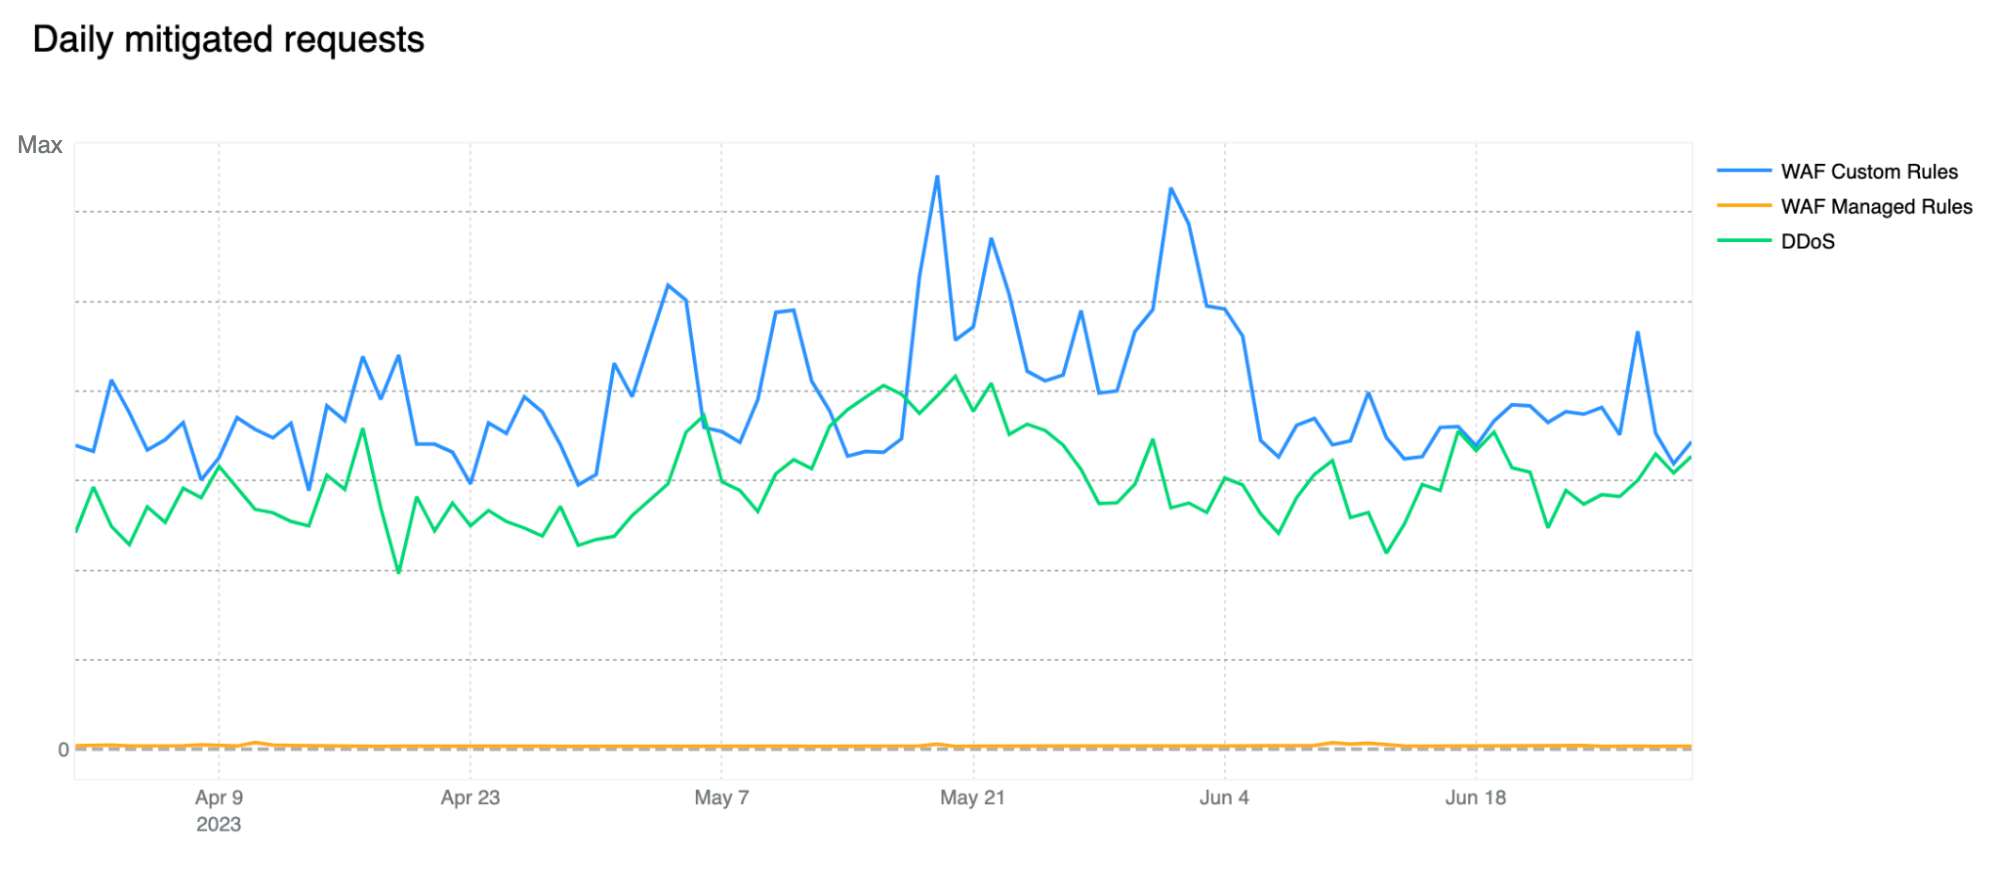
Note that our WAF Managed Rules mitigations (yellow line) are negligible compared to overall WAF mitigated traffic also indicating that customers are adopting positive security models by allowing known good traffic as opposed to blocking only known bad traffic. Having said that, WAF Managed Rules mitigations reached as much as 1.5 billion/day during the quarter.
Our DDoS mitigation is, of course, volumetric and the amount of traffic matching our DDoS layer 7 rules should not be underestimated, especially given that we are observing a number of novel attacks and botnets being spun up across the web. You can read a deep dive on DDoS attack trends in our Q2 DDoS threat report.
Aggregating the source of mitigated traffic, the WAF now accounts for approximately 57% of all mitigations. Tabular format below with other sources for reference.

Application owners are increasingly relying on geo location blocks
Given the increase in mitigated traffic from customer defined WAF rules, we thought it would be interesting to dive one level deeper and better understand what customers are blocking and how they are doing it. We can do this by reviewing rule field usage across our WAF Custom Rules to identify common themes. Of course, the data needs to be interpreted correctly, as not all customers have access to all fields as that varies by contract and plan level, but we can still make some inferences based on field “categories”. By reviewing all ~7M WAF Custom Rules deployed across the network and focusing on main groupings only, we get the following field usage distribution:
Notably, 40% of all deployed WAF Custom Rules use geolocation-related fields to make decisions on how to treat traffic. This is a common technique used to implement business logic or to exclude geographies from which no traffic is expected and helps reduce attack surface areas. While these are coarse controls which are unlikely to stop a sophisticated attacker, they are still efficient at reducing the attack surface.
Another notable observation is the usage of Bot Management related fields in 11% of WAF Custom Rules. This number has been steadily increasing over time as more customers adopt machine learning-based classification strategies to protect their applications.
Old CVEs are still exploited en masse
Contributing ~32% of WAF Managed Rules mitigated traffic overall, HTTP Anomaly is still the most common attack category blocked by the WAF Managed Rules. SQLi moved up to second position, surpassing Directory Traversal with 12.7% and 9.9% respectively.
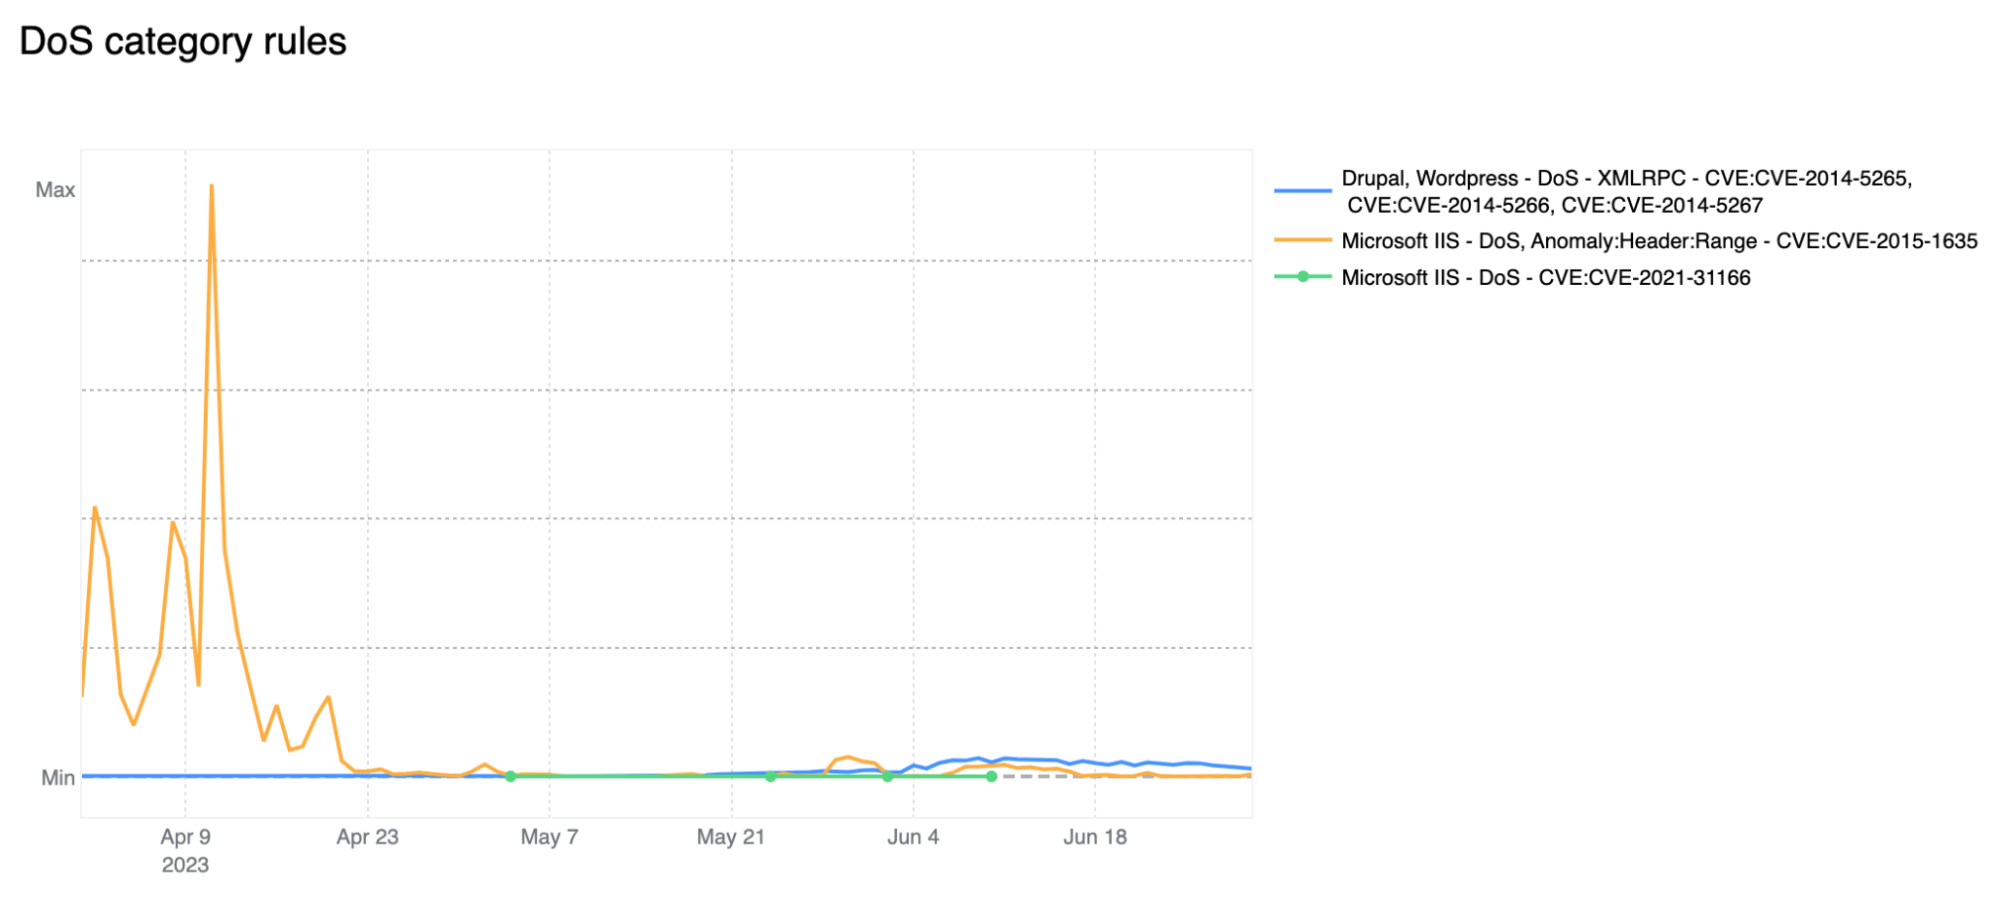
If we look at the start of April 2023, we notice the DoS category far exceeding the HTTP Anomaly category. Rules in the DoS category are WAF layer 7 HTTP signatures that are sufficiently specific to match (and block) single requests without looking at cross request behavior and that can be attributed to either specific botnets or payloads that cause denial of service (DoS). Normally, as is the case here, these requests are not part of “distributed” attacks, hence the lack of the first “D” for “distributed” in the category name.

Tabular format for reference (top 10 categories):
Zooming in, and filtering on the DoS category only, we find that most of the mitigated traffic is attributable to one rule: 100031 / ce02fd… (old WAF and new WAF rule ID respectively). This rule, with a description of “Microsoft IIS - DoS, Anomaly:Header:Range - CVE:CVE-2015-1635” pertains to a CVE dating back to 2015 that affected a number of Microsoft Windows components resulting in remote code execution*****. This is a good reminder that old CVEs, even those dating back more than 8 years, are still actively exploited to compromise machines that may be unpatched and still running vulnerable software.
* Due to rule categorisation, some CVE specific rules are still assigned to a broader category such as DoS in this example. Rules are assigned to a CVE category only when the attack payload does not clearly overlap with another more generic category.
Another interesting observation is the increase in Broken Authentication rule matches starting in June. This increase is also attributable to a single rule deployed across all our customers, including our FREE users: “Wordpress - Broken Access Control, File Inclusion”. This rule is blocking attempts to access wp-config.php - the WordPress default configuration file which is normally found in the web server document root directory, but of course should never be accessed directly via HTTP.
On a similar note, CISA/CSA recently published a report highlighting the 2022 Top Routinely Exploited Vulnerabilities. We took this opportunity to explore how each CVE mentioned in CISA’s report was reflected in Cloudflare’s own data. The CISA/CSA discuss 12 vulnerabilities that malicious cyber actors routinely exploited in 2022. However, based on our analysis, two CVEs mentioned in the CISA report are responsible for the vast majority of attack traffic we have seen in the wild: Log4J and Atlassian Confluence Code Injection. Our data clearly suggests a major difference in exploit volume between the top two and the rest of the list. The following chart compares the attack volume (in logarithmic scale) of the top 6 vulnerabilities of the CISA list according to our logs.

Bot traffic insights
Cloudflare’s Bot Management continues to see significant investment as the addition of JavaScript Verified URLs for greater protection against browser-based bots, Detection IDs are now available in Custom Rules for additional configurability, and an improved UI for easier onboarding. For self-serve customers, we’ve added the ability to “Skip” Super Bot Fight Mode rules and support for Wordpress Loopback requests, to better integrate with our customers’ applications and give them the protection they need.
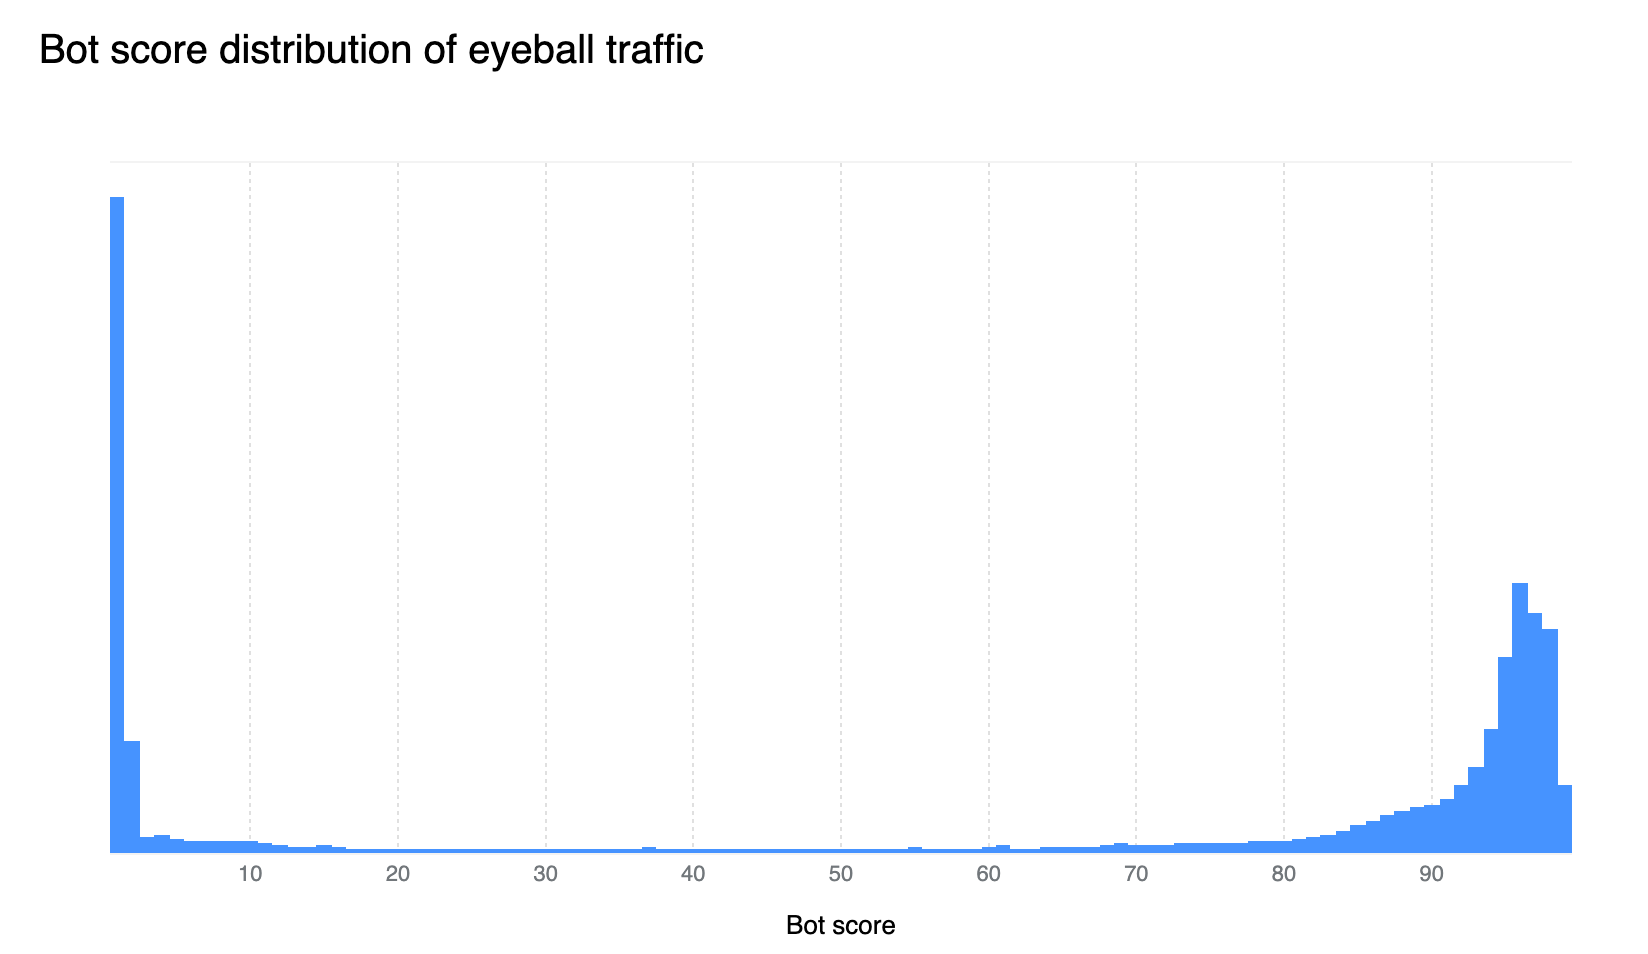
Our confidence in the Bot Management classification output remains very high. If we plot the bot scores across the analyzed time frame, we find a very clear distribution, with most requests either being classified as definitely bot (score below 30) or definitely human (score greater than 80), with most requests actually scoring less than 2 or greater than 95. This equates, over the same time period, to 33% of traffic being classified as automated (generated by a bot). Over longer time periods we do see the overall bot traffic percentage stable at 29%, and this reflects the data shown on Cloudflare Radar.
On average, more than 10% of non-verified bot traffic is mitigated
Compared to the last report, non-verified bot HTTP traffic mitigation is currently on a downward trend (down 6 percentage points). However, the Bot Management field usage within WAF Custom Rules is non negligible, standing at 11%. This means that there are more than 700k WAF Custom Rules deployed on Cloudflare that are relying on bot signals to perform some action. The most common field used is cf.client.bot, an alias to cf.bot_management.verified_bot which is powered by our list of verified bots and allows customers to make a distinction between “good” bots and potentially “malicious” non-verified ones.
Enterprise customers have access to the more powerful cf.bot_management.score which provides direct access to the score computed on each request, the same score used to generate the bot score distribution graph in the prior section.

The above data is also validated by looking at what Cloudflare service is mitigating unverified bot traffic. Although our DDoS mitigation system is automatically blocking HTTP traffic across all customers, this only accounts for 13% of non-verified bot mitigations. On the other hand, WAF, and mostly customer defined rules, account for 77% of such mitigations, much higher than mitigations across all traffic (57%) discussed at the start of the report. Note that Bot Management is specifically called out but refers to our “default” one-click rules, which are counted separately from the bot fields used in WAF Custom Rules.
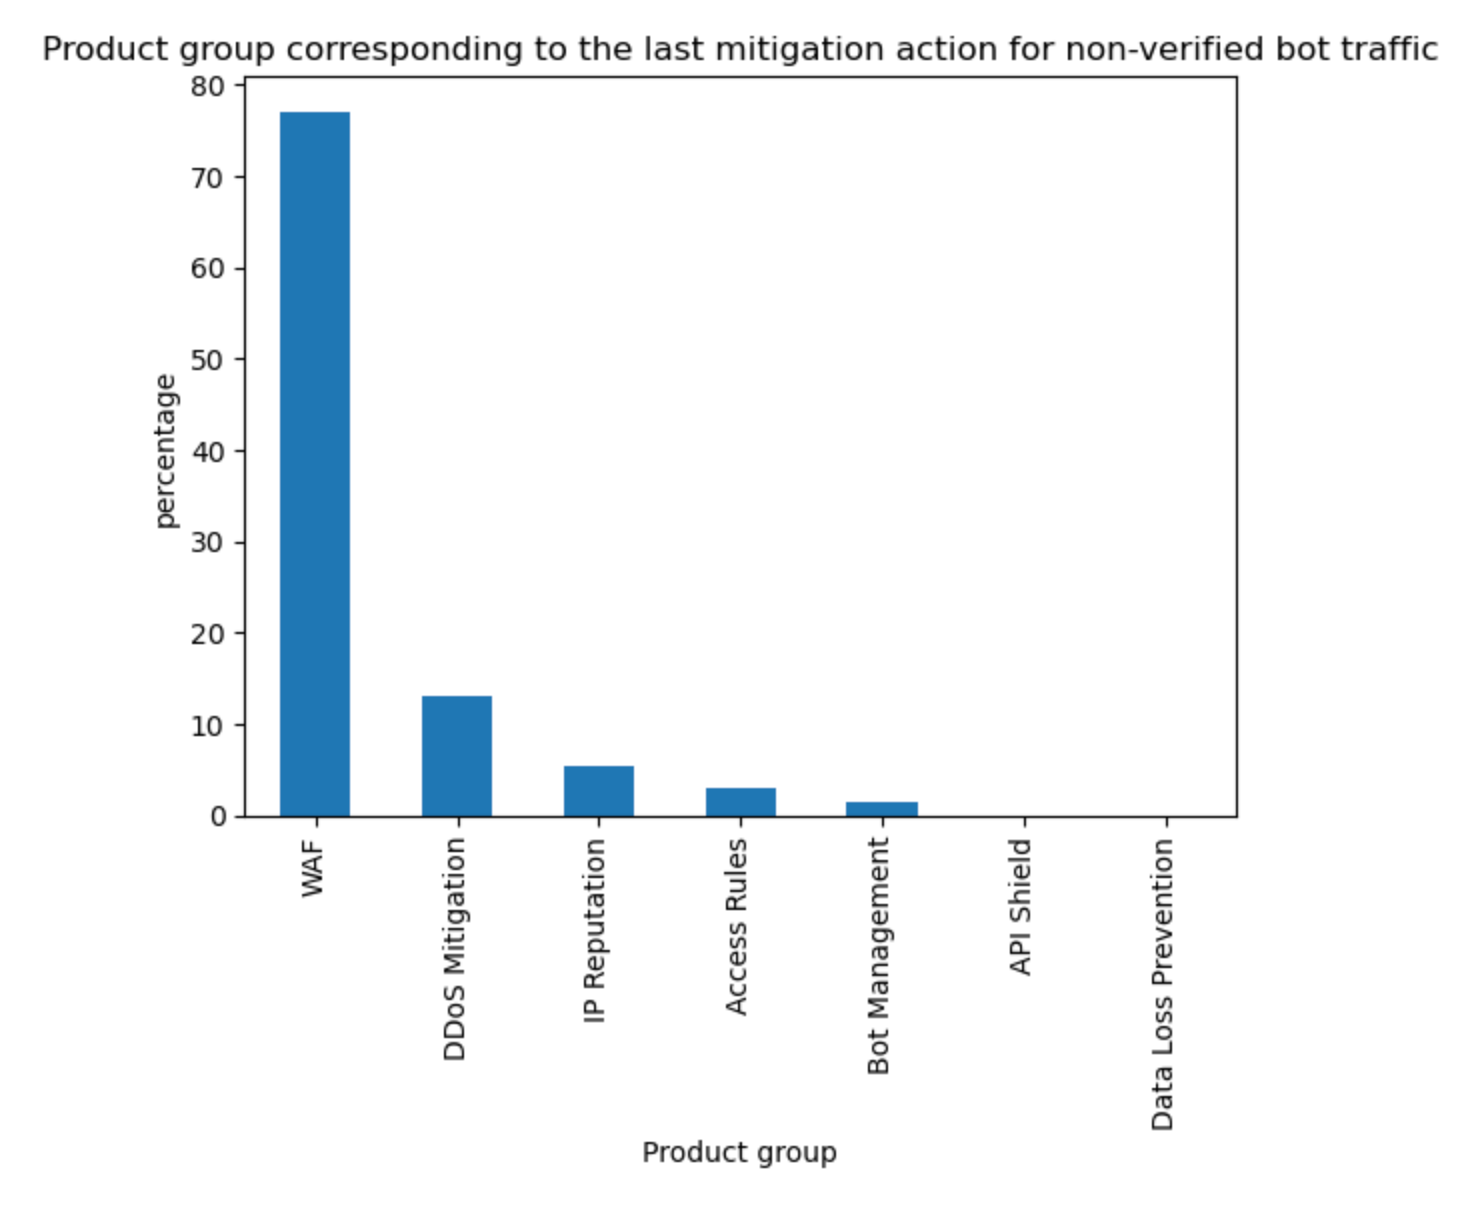
Tabular format for reference:
API traffic insights
58% of dynamic (non cacheable) traffic is API related
The growth of overall API traffic observed by Cloudflare is not slowing down. Compared to last quarter, we are now seeing 58% of total dynamic traffic be classified as API related. This is a 3 percentage point increase as compared to Q1.

Our investment in API Gateway is also following a similar growth trend. Over the last quarter we have released several new API security features.
First, we’ve made API Discovery easier to use with a new inbox view. API Discovery inventories your APIs to prevent shadow IT and zombie APIs, and now customers can easily filter to show only new endpoints found by API Discovery. Saving endpoints from API Discovery places them into our Endpoint Management system.
Next, we’ve added a brand new API security feature offered only at Cloudflare: the ability to control API access by client behavior. We call it Sequence Mitigation. Customers can now create positive or negative security models based on the order of API paths accessed by clients. You can now ensure that your application’s users are the only ones accessing your API instead of brute-force attempts that ignore normal application functionality. For example, in a banking application you can now enforce that access to the funds transfer endpoint can only be accessed after a user has also accessed the account balance check endpoint.
We’re excited to continue releasing API security and API management features for the remainder of 2023 and beyond.
65% of global API traffic is generated by browsers
The percentage of API traffic generated by browsers has remained very stable over the past quarter. With this statistic, we are referring to HTTP requests that are not serving HTML based content that will be directly rendered by the browser without some preprocessing, such as those more commonly known as AJAX calls which would normally serve JSON based responses.

HTTP Anomalies are the most common attack vector on API endpoints
Just like last quarter, HTTP Anomalies remain the most common mitigated attack vector on API traffic. SQLi injection attacks, however, are non negligible, contributing approximately 11% towards the total mitigated traffic, closely followed by XSS attacks, at around 9%.

Tabular format for reference (top 5):
Looking forward
As we move our application security report to a quarterly cadence, we plan to deepen some of the insights and to provide additional data from some of our newer products such as Page Shield, allowing us to look beyond HTTP traffic, and explore the state of third party dependencies online.
Stay tuned and keep an eye on Cloudflare Radar for more frequent application security reports and insights.


