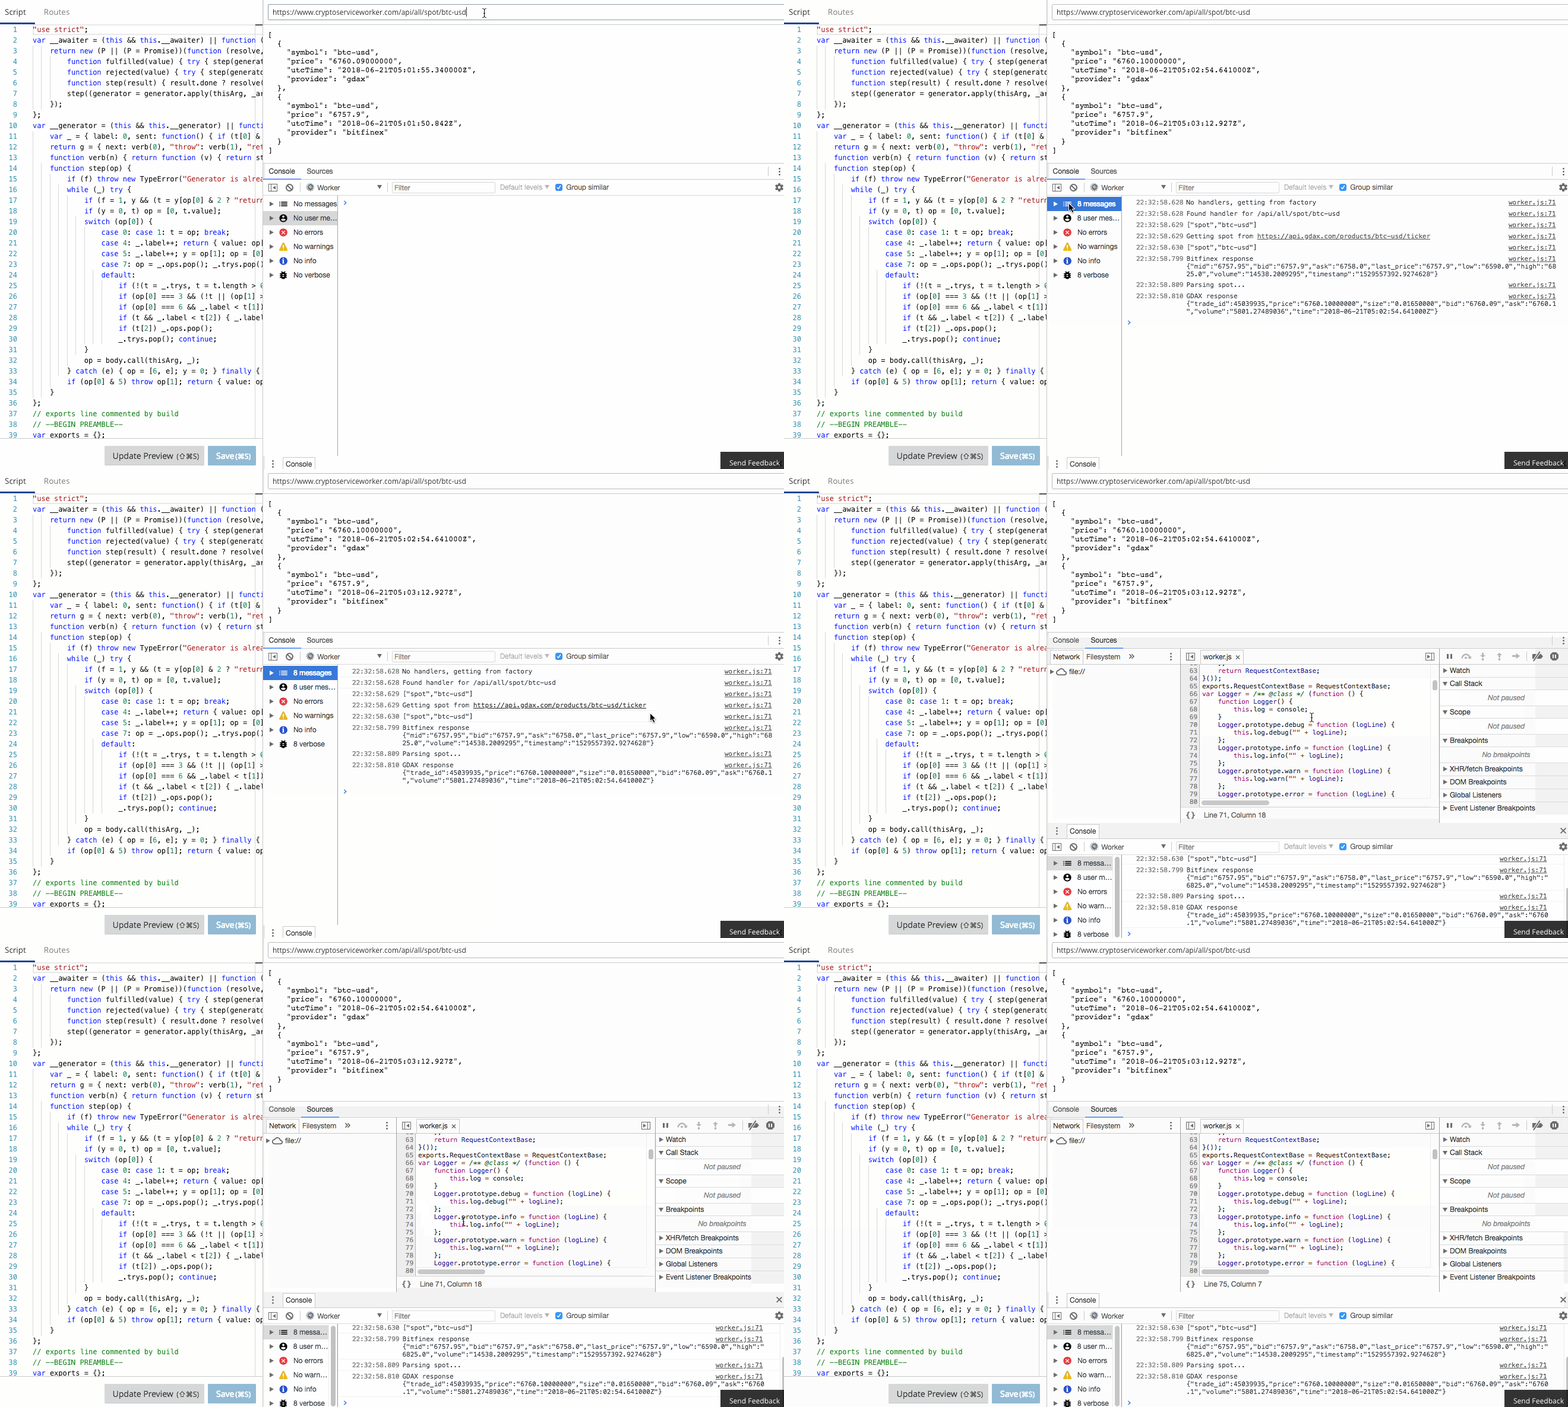
The Workers team have already done an amazing job of creating a functional, familiar edit and debug tooling experience in the Workers IDE. It's Chrome Developer Tools fully integrated to Workers.
console.log in your Worker goes straight to the console, just as if you were debugging locally! Furthermore, errors and even log lines come complete with call-site info, so you click and navigate straight to the relevant line.In this blog post I’m going to show a small and powerful technique I use to make debugging serverless apps simple and quick.

There is a comprehensive guide to common debugging approaches and I'm going to focus on returning debug information in a header. This is a great tip and one that I use to capture debug information when I'm using curl or Postman, or integration tests. It was a little finicky to get right the first time, so let me save you some trouble.
If you've followed part 1 or part 2 of my Workers series, you'll know I'm using Typescript, but the approach would equally apply to Javascript. In the rest of this example, I’ll be using the routing framework I created in part 2.
Requesting Debug Info
I want my Worker to return debugging information whenever:
An X-Debug header is present or
a ?debug query parameter is present.
Exercise for the reader: You may also like to require a shared secret key (so that you control who can enable debugging information) and pass a log level.
I'd like my debug info to be the same that I'd see in the Workers IDE. That is, all the log lines and any exception info from the execution of my Worker.
Architecture
Logging is orthogonal to the main request flow, so let's try keep it abstracted. Different frameworks use different terms for this abstraction. I’ll use the term interceptor.
Let's define an interceptor as something that runs pre and/or post the main request flow.
/**
 * Intercepts requests before handlers and responses after handlers
 */
export interface IInterceptor {
  preProcess(req: RequestContextBase): void;
  postProcess(req: RequestContextBase, res: Response): void;
}
And then run pre and post processing before and after the handler has executed.
public async handle(request: Request): Promise<Response> {
	this.preProcess(req);
	const handler = this.route(req);
	const res = await handler.handle(req);
	this.postProcess(req, res);
	return res;
}

private preProcess(req: RequestContextBase) {
	for (const interceptor of this.interceptors) {
	  interceptor.preProcess(req);
	}
}

private postProcess(req: RequestContextBase, res: Response) {
	for (const interceptor of this.interceptors) {
	  interceptor.postProcess(req, res);
	}
}
OK, so with a generalized pattern to execute code before and after a request, let's add our first Interceptor:
LogInterceptor
First we'll need a logger. This logger just redirects to console, but also keeps track of the log lines so the interceptor can retrieve them later.
export class Logger implements ILogger {
  public logLines: string[] = [];

  public debug(logLine: string): void {
    this.log(`DEBUG: ${logLine}`);
  }

  public info(logLine: string): void {
    this.log(`INFO: ${logLine}`);
  }

  public warn(logLine: string): void {
    this.log(`WARN: ${logLine}`);
  }

  public error(logLine: string): void {
    this.log(`ERROR: ${logLine}`);
  }

  public getLines(): string[] {
    return this.logLines;
  }

  public clear(): void {
    this.logLines = [];
  }

  private log(logLine: string): void {
    // tslint:disable-next-line:no-console
    console.log(logLine);
    this.logLines.push(logLine);
  }
}
The LogInterceptor is simple enough in post processing, if it detects the X-Debug header or debug query param, it adds all the log lines to the X-Debug response header as a URL-encoded string.
const logger = new Logger();

export class LogInterceptor implements IInterceptor {
  public preProcess(req: RequestContextBase) {
    return;
  }

  public postProcess(req: RequestContextBase, res: Response) {
    logger.debug('Evaluating request for logging');
    const debugHeader = 'X-Debug';
    if (
      req.url.searchParams.get('debug') !== 'true' &&
      req.request.headers.get(debugHeader) !== 'true'
    ) {
      return;
    }
    logger.debug('Executing log interceptor');
    const lines = logger.getLines();
    const logStr = encodeURIComponent(lines.join('\n'));

    logger.debug(`Adding to ${debugHeader} header ${logStr.length} chars`);
    res.headers.append(debugHeader, logStr);
  }
}
Now it's up to the client to display.
Decoding the result
urldecode isn't native on most operating systems. There are Perl and Python implementations, but here's a Bash only function:
$ urldecode() { : "${*//+/ }"; echo -e "${_//%/\\x}"; }Source: StackOverflow
Using that, we can call curl, extract the headers, grep for our X-Debug header and then invoke the urldecode function.
$ urldecode `curl -sD - -o /dev/null https://cryptoserviceworker.com/api/all/spot/btc-usd -H "X-Debug:true" | grep x-debug`
x-debug: INFO: Handling: https://cryptoserviceworker.com/api/all/spot/btc-usd
DEBUG: No handlers, getting from factory
DEBUG: Found handler for /api/all/spot/btc-usd
DEBUG: ["spot","btc-usd"]
DEBUG: Getting spot from https://api.gdax.com/products/btc-usd/ticker
DEBUG: ["spot","btc-usd"]
DEBUG: Parsing spot...
INFO: GDAX response {"trade_id":45329353,"price":"6287.01000000","size":"0.03440000","bid":"6287","ask":"6287.01","volume":"9845.51680796","time":"2018-06-25T18:12:48.282000Z"}
INFO: Bitfinex response {"mid":"6283.45","bid":"6283.4","ask":"6283.5","last_price":"6283.5","low":"6068.5","high":"6341.0","volume":"28642.882017660013","timestamp":"1529950365.0694907"}
DEBUG: Evaluating request for logging
DEBUG: Executing log interceptor
Boom. Decoded debug info right there in the console. Ship it.
If you log stack traces in your worker with logger.error(e.stack), that will also format nicely:
$ urldecode `curl -sD - -o /dev/null https://cryptoserviceworker.com/api/all/spot/btc-usd -H "X-Debug:true" | grep x-debug`
x-debug: INFO: Handling: https://cryptoserviceworker.com/api/all/spot/btc-usd
ERROR: Error: boom
    at Router.<anonymous> (worker.js:118:35)
    at step (worker.js:32:23)
    at Object.next (worker.js:13:53)
    at worker.js:7:71
    at new Promise (<anonymous>)
    at __awaiter (worker.js:3:12)
    at Router.handle (worker.js:111:16)
    at worker.js:48:42
    at step (worker.js:32:23)
    at Object.next (worker.js:13:53)
DEBUG: Evaluating request for logging
DEBUG: Executing log interceptor
Summary
In this post we:
Defined a pre- and post-processing framework using Interceptors
Implemented a LogInterceptor to return logs generated as we were processing in the X-Debug header
Decoded them in bash
May the logs be with you.


