
This is a heavily truncated version of an internal blog post from August 2017. For more recent updates on Kafka, check out another blog post on compression, where we optimized throughput 4.5x for both disks and network.
Photo by Alex Povolyashko / Unsplash

Upgrading our systems to Debian Stretch
For quite some time we've been rolling out Debian Stretch, to the point where we have reached ~10% adoption in our core datacenters. As part of upgarding the underlying OS, we also evaluate the higher level software stack, e.g. taking a look at our ClickHouse and Kafka clusters.
During our upgrade of Kafka, we sucessfully migrated two smaller clusters, logs and dns, but ran into issues when attempting to upgrade one of our larger clusters, http.
Thankfully, we were able to roll back the http cluster upgrade relatively easily, due to heavy versioning of both the OS and the higher level software stack. If there's one takeaway from this blog post, it's to take advantage of consistent versioning.
High level differences
We upgraded one Kafka http node, and it did not go as planned:
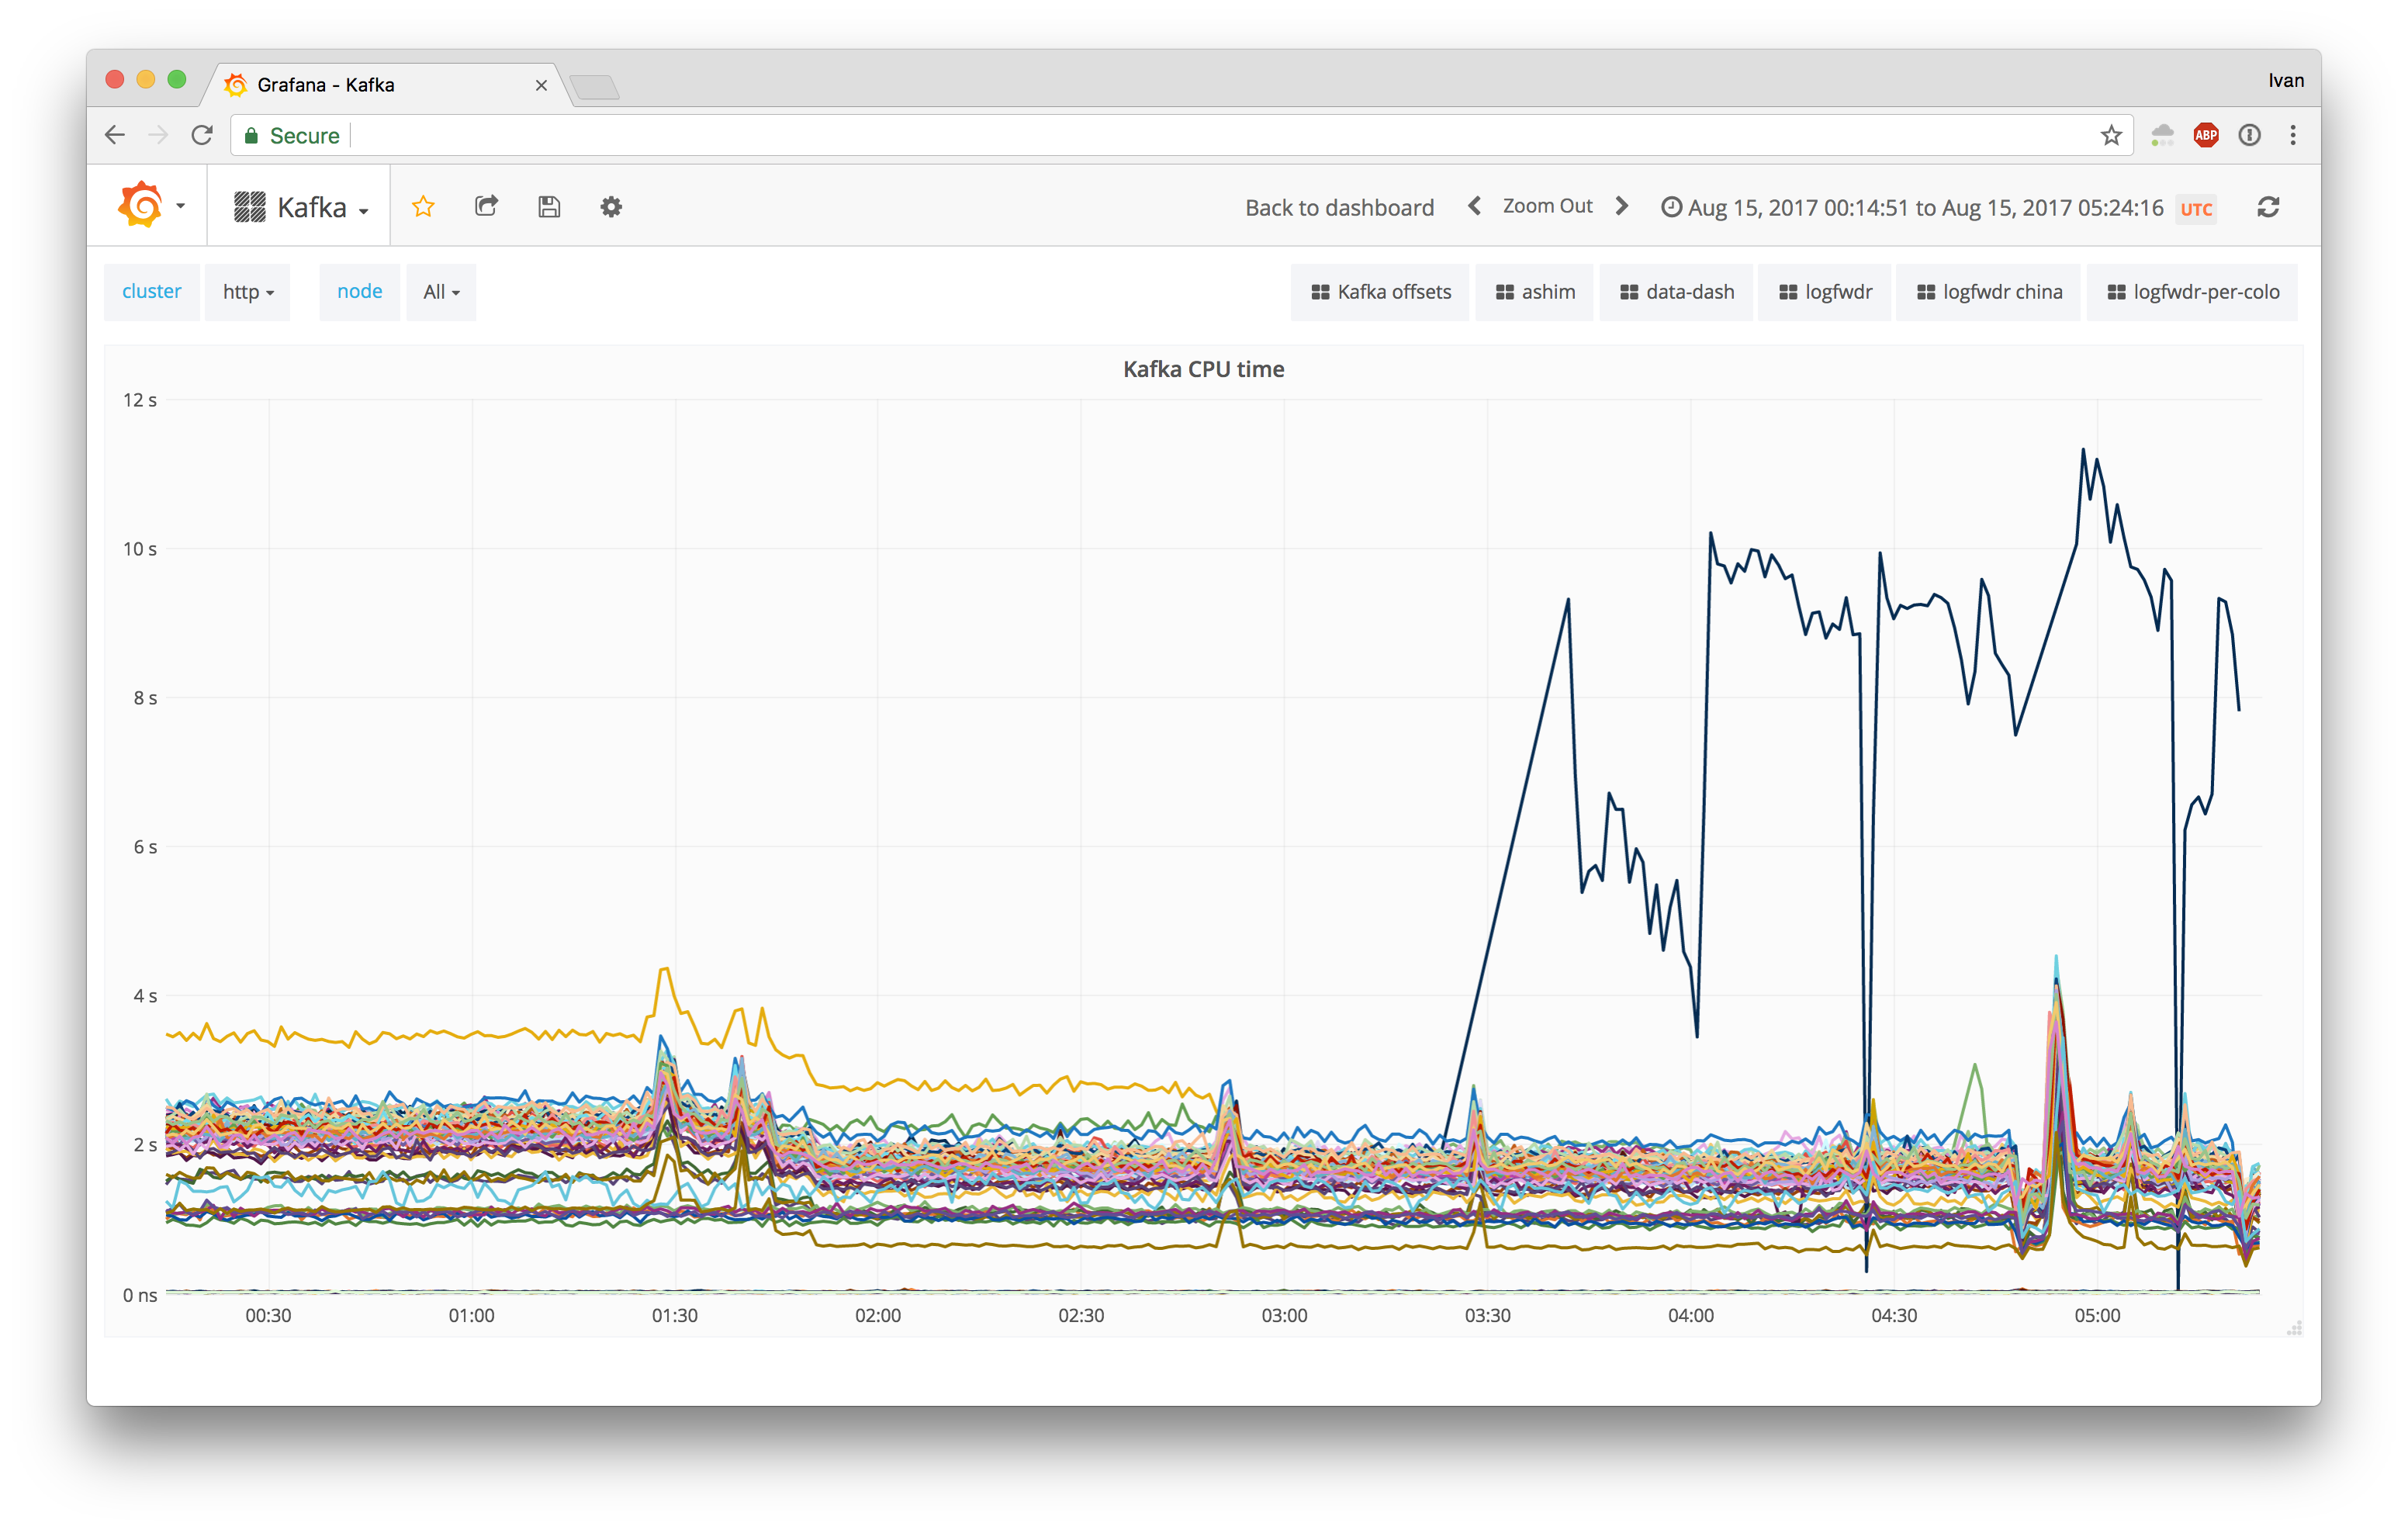
Having 5x CPU usage was definitely an unexpected outcome. For control datapoints, we compared to a node where no upgrade happened, and an intermediary node that received a software stack upgrade, but not an OS upgrade. Neither of these two nodes experienced the same CPU saturation issues, even though their setups were practically identical.
For debugging CPU saturation issues, we call on perf to fish out details:
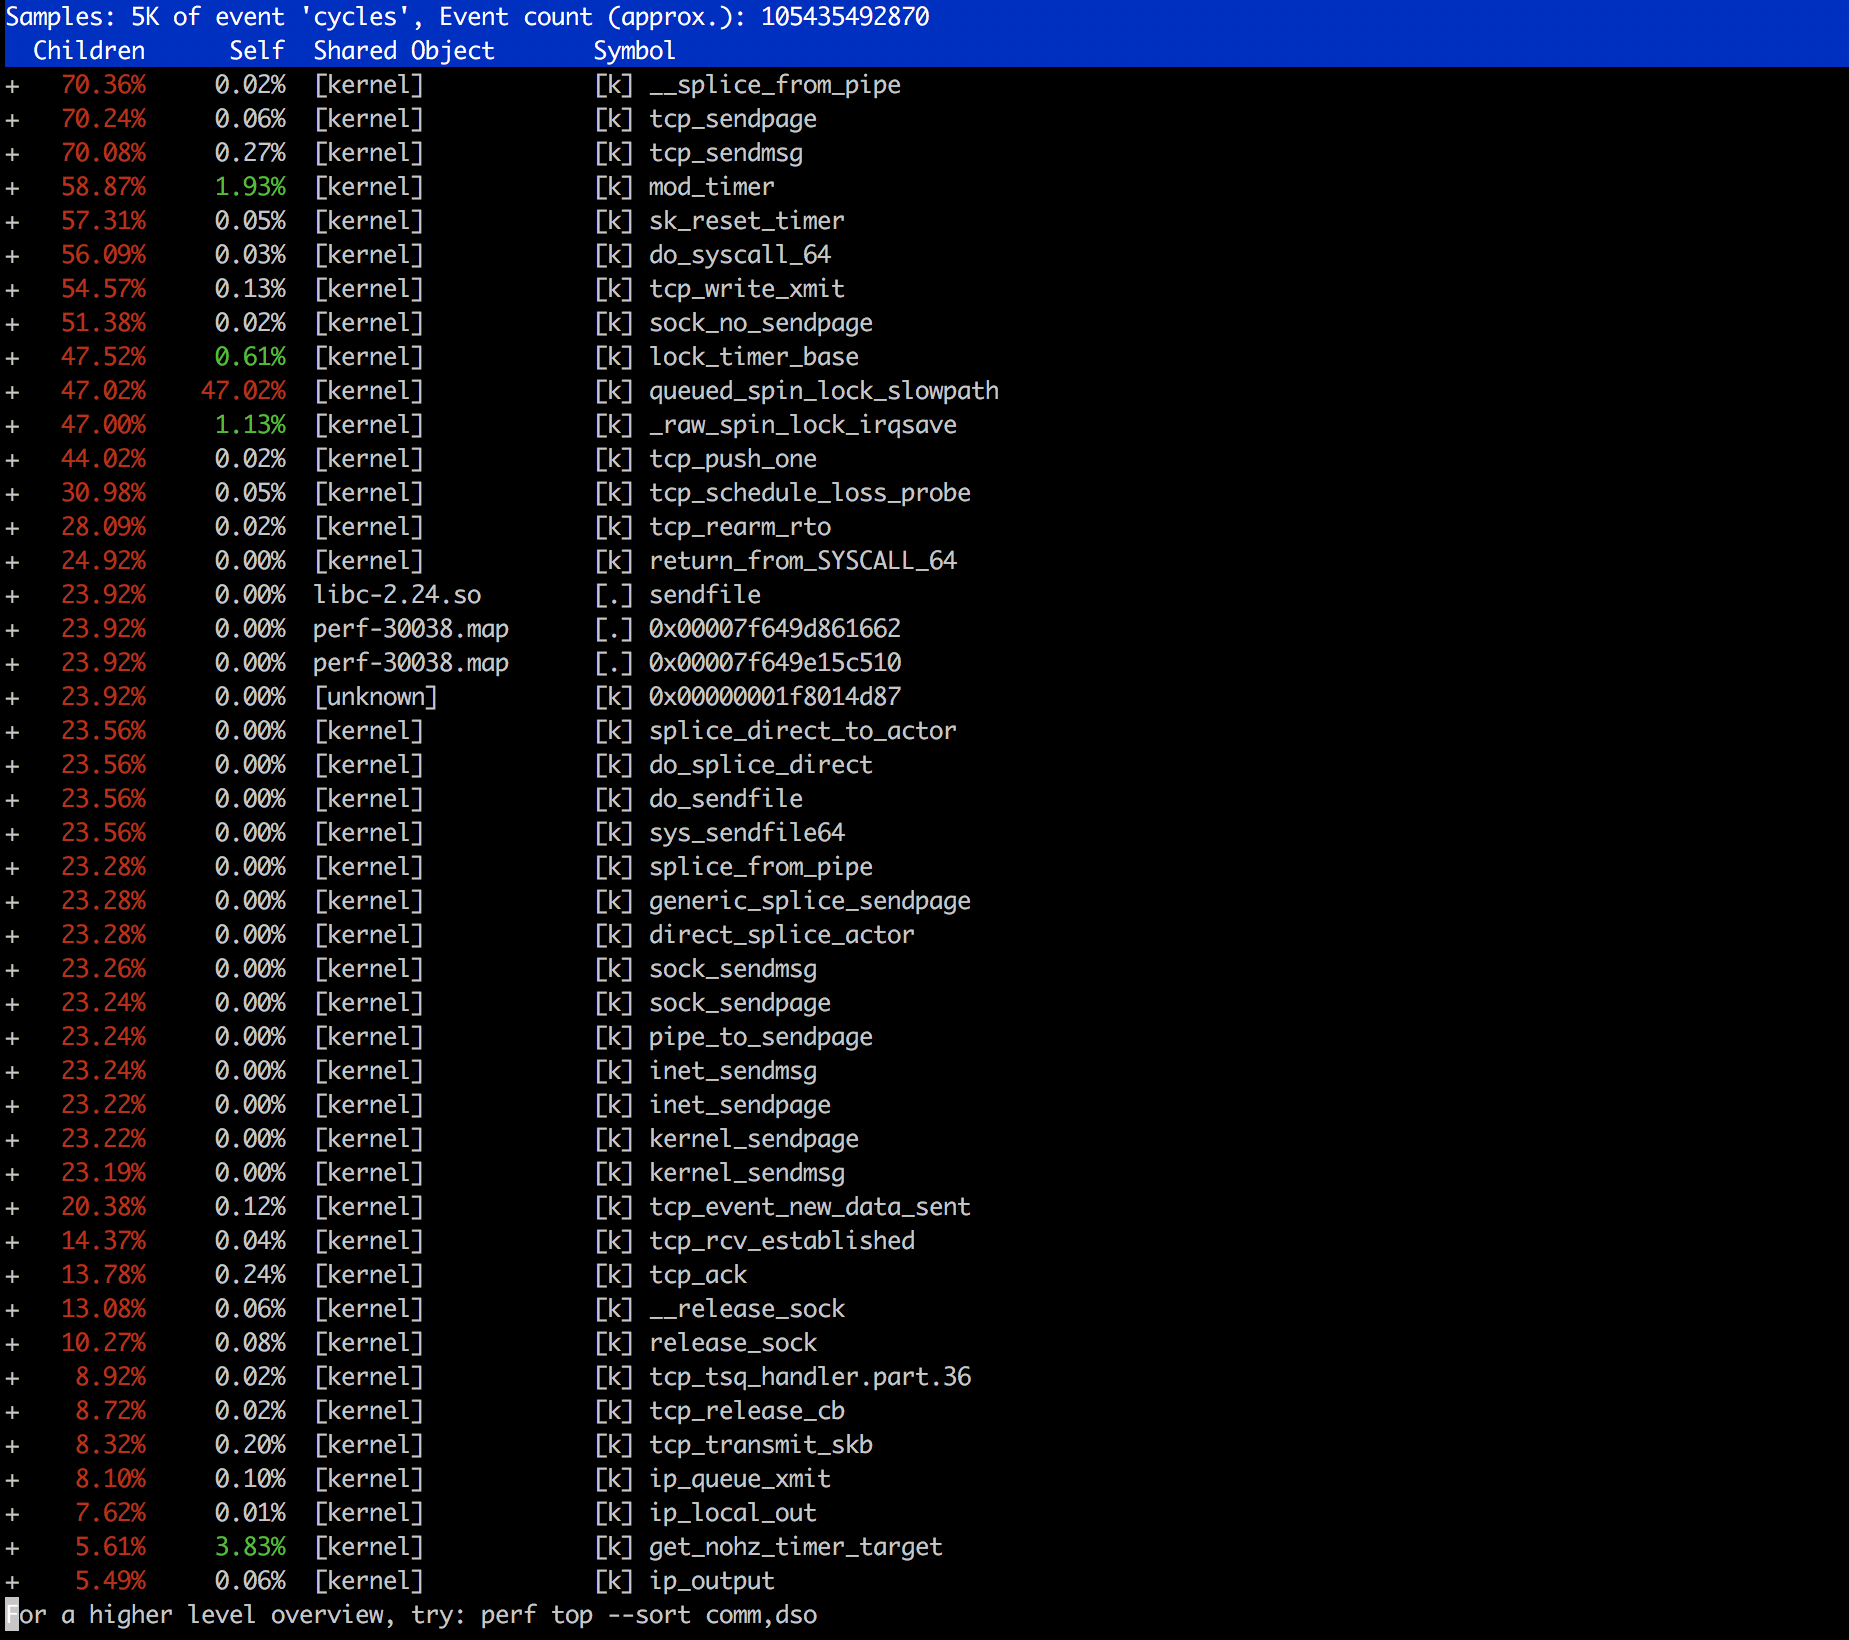
The command used was: perf top -F 99.
RCU stalls
In addition to higher system CPU usage, we found secondary slowdowns, including read-copy update (RCU) stalls:
[ 4909.110009] logfwdr (26887) used greatest stack depth: 11544 bytes left
[ 4909.392659] oom_reaper: reaped process 26861 (logfwdr), now anon-rss:8kB, file-rss:0kB, shmem-rss:0kB
[ 4923.462841] INFO: rcu_sched self-detected stall on CPU
[ 4923.462843]  13-...: (2 GPs behind) idle=ea7/140000000000001/0 softirq=1/2 fqs=4198
[ 4923.462845]   (t=8403 jiffies g=110722 c=110721 q=6440)
We've seen RCU stalls before, and our (suboptimal) solution was to reboot the machine.
However, one can only handle so many reboots before the problem becomes severe enough to warrant a deep dive. During our deep dive, we noticed in dmesg that we had issues allocating memory, while trying to write errors:
Aug 15 21:51:35 myhost kernel: INFO: rcu_sched detected stalls on CPUs/tasks:
Aug 15 21:51:35 myhost kernel:         26-...: (1881 ticks this GP) idle=76f/140000000000000/0 softirq=8/8 fqs=365
Aug 15 21:51:35 myhost kernel:         (detected by 0, t=2102 jiffies, g=1837293, c=1837292, q=262)
Aug 15 21:51:35 myhost kernel: Task dump for CPU 26:
Aug 15 21:51:35 myhost kernel: java            R  running task    13488  1714   1513 0x00080188
Aug 15 21:51:35 myhost kernel:  ffffc9000d1f7898 ffffffff814ee977 ffff88103f410400 000000000000000a
Aug 15 21:51:35 myhost kernel:  0000000000000041 ffffffff82203142 ffffc9000d1f78c0 ffffffff814eea10
Aug 15 21:51:35 myhost kernel:  0000000000000041 ffffffff82203142 ffff88103f410400 ffffc9000d1f7920
Aug 15 21:51:35 myhost kernel: Call Trace:
Aug 15 21:51:35 myhost kernel:  [<ffffffff814ee977>] ? scrup+0x147/0x160
Aug 15 21:51:35 myhost kernel:  [<ffffffff814eea10>] ? lf+0x80/0x90
Aug 15 21:51:35 myhost kernel:  [<ffffffff814eecb5>] ? vt_console_print+0x295/0x3c0
Aug 15 21:51:35 myhost kernel:  [<ffffffff810b1193>] ? call_console_drivers.isra.22.constprop.30+0xf3/0x100
Aug 15 21:51:35 myhost kernel:  [<ffffffff810b1f51>] ? console_unlock+0x281/0x550
Aug 15 21:51:35 myhost kernel:  [<ffffffff810b2498>] ? vprintk_emit+0x278/0x430
Aug 15 21:51:35 myhost kernel:  [<ffffffff810b27ef>] ? vprintk_default+0x1f/0x30
Aug 15 21:51:35 myhost kernel:  [<ffffffff811588df>] ? printk+0x48/0x50
Aug 15 21:51:35 myhost kernel:  [<ffffffff810b30ee>] ? dump_stack_print_info+0x7e/0xc0
Aug 15 21:51:35 myhost kernel:  [<ffffffff8142d41f>] ? dump_stack+0x44/0x65
Aug 15 21:51:35 myhost kernel:  [<ffffffff81162e64>] ? warn_alloc+0x124/0x150
Aug 15 21:51:35 myhost kernel:  [<ffffffff81163842>] ? __alloc_pages_slowpath+0x932/0xb80
Aug 15 21:51:35 myhost kernel:  [<ffffffff81163c92>] ? __alloc_pages_nodemask+0x202/0x250
Aug 15 21:51:35 myhost kernel:  [<ffffffff811ae9c2>] ? alloc_pages_current+0x92/0x120
Aug 15 21:51:35 myhost kernel:  [<ffffffff81159d2f>] ? __page_cache_alloc+0xbf/0xd0
Aug 15 21:51:35 myhost kernel:  [<ffffffff8115cdfa>] ? filemap_fault+0x2ea/0x4d0
Aug 15 21:51:35 myhost kernel:  [<ffffffff8136dc95>] ? xfs_filemap_fault+0x45/0xa0
Aug 15 21:51:35 myhost kernel:  [<ffffffff8118b3eb>] ? __do_fault+0x6b/0xd0
Aug 15 21:51:35 myhost kernel:  [<ffffffff81190028>] ? handle_mm_fault+0xe98/0x12b0
Aug 15 21:51:35 myhost kernel:  [<ffffffff8110756b>] ? __seccomp_filter+0x1db/0x290
Aug 15 21:51:35 myhost kernel:  [<ffffffff8104fa5c>] ? __do_page_fault+0x22c/0x4c0
Aug 15 21:51:35 myhost kernel:  [<ffffffff8104fd10>] ? do_page_fault+0x20/0x70
Aug 15 21:51:35 myhost kernel:  [<ffffffff819bea02>] ? page_fault+0x22/0x30
This suggested that we were logging too many errors, and the actual failure may be earlier in the process. Armed with this hypothesis, we looked at the very beginning of the error chain:
Aug 16 01:14:51 myhost systemd-journald[13812]: Missed 17171 kernel messages
Aug 16 01:14:51 myhost kernel:  [<ffffffff81171754>] shrink_inactive_list+0x1f4/0x4f0
Aug 16 01:14:51 myhost kernel:  [<ffffffff8117234b>] shrink_node_memcg+0x5bb/0x780
Aug 16 01:14:51 myhost kernel:  [<ffffffff811725e2>] shrink_node+0xd2/0x2f0
Aug 16 01:14:51 myhost kernel:  [<ffffffff811728ef>] do_try_to_free_pages+0xef/0x310
Aug 16 01:14:51 myhost kernel:  [<ffffffff81172be5>] try_to_free_pages+0xd5/0x180
Aug 16 01:14:51 myhost kernel:  [<ffffffff811632db>] __alloc_pages_slowpath+0x31b/0xb80
As much as shrink_node may scream "NUMA issues", you're looking primarily at:
Aug 16 01:14:51 myhost systemd-journald[13812]: Missed 17171 kernel messages
In addition, we also found memory allocation issues:
[78972.506644] Mem-Info:
[78972.506653] active_anon:3936889 inactive_anon:371971 isolated_anon:0
[78972.506653]  active_file:25778474 inactive_file:1214478 isolated_file:2208
[78972.506653]  unevictable:0 dirty:1760643 writeback:0 unstable:0
[78972.506653]  slab_reclaimable:1059804 slab_unreclaimable:141694
[78972.506653]  mapped:47285 shmem:535917 pagetables:10298 bounce:0
[78972.506653]  free:202928 free_pcp:3085 free_cma:0
[78972.506660] Node 0 active_anon:8333016kB inactive_anon:989808kB active_file:50622384kB inactive_file:2401416kB unevictable:0kB isolated(anon):0kB isolated(file):3072kB mapped:96624kB dirty:3422168kB writeback:0kB shmem:1261156kB shmem_thp: 0kB shmem_pmdmapped: 0kB anon_thp: 0kB writeback_tmp:0kB unstable:0kB pages_scanned:15744 all_unreclaimable? no
[78972.506666] Node 1 active_anon:7414540kB inactive_anon:498076kB active_file:52491512kB inactive_file:2456496kB unevictable:0kB isolated(anon):0kB isolated(file):5760kB mapped:92516kB dirty:3620404kB writeback:0kB shmem:882512kB shmem_thp: 0kB shmem_pmdmapped: 0kB anon_thp: 0kB writeback_tmp:0kB unstable:0kB pages_scanned:9080974 all_unreclaimable? no
[78972.506671] Node 0 DMA free:15900kB min:100kB low:124kB high:148kB active_anon:0kB inactive_anon:0kB active_file:0kB inactive_file:0kB unevictable:0kB writepending:0kB present:15996kB managed:15900kB mlocked:0kB slab_reclaimable:0kB slab_unreclaimable:0kB kernel_stack:0kB pagetables:0kB bounce:0kB free_pcp:0kB local_pcp:0kB free_cma:0kB
** 9 printk messages dropped ** [78972.506716] Node 0 Normal: 15336*4kB (UMEH) 4584*8kB (MEH) 2119*16kB (UME) 775*32kB (MEH) 106*64kB (UM) 81*128kB (MH) 29*256kB (UM) 25*512kB (M) 19*1024kB (M) 7*2048kB (M) 2*4096kB (M) = 236080kB
[78972.506725] Node 1 Normal: 31740*4kB (UMEH) 3879*8kB (UMEH) 873*16kB (UME) 353*32kB (UM) 286*64kB (UMH) 62*128kB (UMH) 28*256kB (MH) 20*512kB (UMH) 15*1024kB (UM) 7*2048kB (UM) 12*4096kB (M) = 305752kB
[78972.506726] Node 0 hugepages_total=0 hugepages_free=0 hugepages_surp=0 hugepages_size=2048kB
[78972.506727] Node 1 hugepages_total=0 hugepages_free=0 hugepages_surp=0 hugepages_size=2048kB
[78972.506728] 27531091 total pagecache pages
[78972.506729] 0 pages in swap cache
[78972.506730] Swap cache stats: add 0, delete 0, find 0/0
[78972.506730] Free swap  = 0kB
[78972.506731] Total swap = 0kB
[78972.506731] 33524975 pages RAM
[78972.506732] 0 pages HighMem/MovableOnly
[78972.506732] 546255 pages reserved
[78972.620129] ntpd: page allocation stalls for 272380ms, order:0, mode:0x24000c0(GFP_KERNEL)
[78972.620132] CPU: 16 PID: 13099 Comm: ntpd Tainted: G           O    4.9.43-cloudflare-2017.8.4 #1
[78972.620133] Hardware name: Quanta Computer Inc D51B-2U (dual 1G LoM)/S2B-MB (dual 1G LoM), BIOS S2B_3A21 10/01/2015
[78972.620136]  ffffc90022f9b6f8 ffffffff8142d668 ffffffff81ca31b8 0000000000000001
[78972.620138]  ffffc90022f9b778 ffffffff81162f14 024000c022f9b740 ffffffff81ca31b8
[78972.620140]  ffffc90022f9b720 0000000000000010 ffffc90022f9b788 ffffc90022f9b738
[78972.620140] Call Trace:
[78972.620148]  [<ffffffff8142d668>] dump_stack+0x4d/0x65
[78972.620152]  [<ffffffff81162f14>] warn_alloc+0x124/0x150
[78972.620154]  [<ffffffff811638f2>] __alloc_pages_slowpath+0x932/0xb80
[78972.620157]  [<ffffffff81163d42>] __alloc_pages_nodemask+0x202/0x250
[78972.620160]  [<ffffffff811aeae2>] alloc_pages_current+0x92/0x120
[78972.620162]  [<ffffffff8115f6ee>] __get_free_pages+0xe/0x40
[78972.620165]  [<ffffffff811e747a>] __pollwait+0x9a/0xe0
[78972.620168]  [<ffffffff817c9ec9>] datagram_poll+0x29/0x100
[78972.620170]  [<ffffffff817b9d48>] sock_poll+0x48/0xa0
[78972.620172]  [<ffffffff811e7c35>] do_select+0x335/0x7b0
This specific error message did seem fun:
[78991.546088] systemd-network: page allocation stalls for 287000ms, order:0, mode:0x24200ca(GFP_HIGHUSER_MOVABLE)
You don't want your page allocations to stall for 5 minutes, especially when it's order zero allocation (smallest allocation of one 4 KiB page).
Comparing to our control nodes, the only two possible explanations were: a kernel upgrade, and the switch from Debian Jessie to Debian Stretch. We suspected the former, since CPU usage implies a kernel issue. However, just to be safe, we rolled both the kernel back to 4.4.55, and downgraded the affected nodes back to Debian Jessie. This was a reasonable compromise, since we needed to minimize downtime on production nodes.
Digging a bit deeper
Keeping servers running on older kernel and distribution is not a viable long term solution. Through bisection, we found the issue lay in the Jessie to Stretch upgrade, contrary to our initial hypothesis.
Now that we knew what the problem was, we proceeded to investigate why. With the help from existing automation around perf and Java, we generated the following flamegraphs:
- Jessie
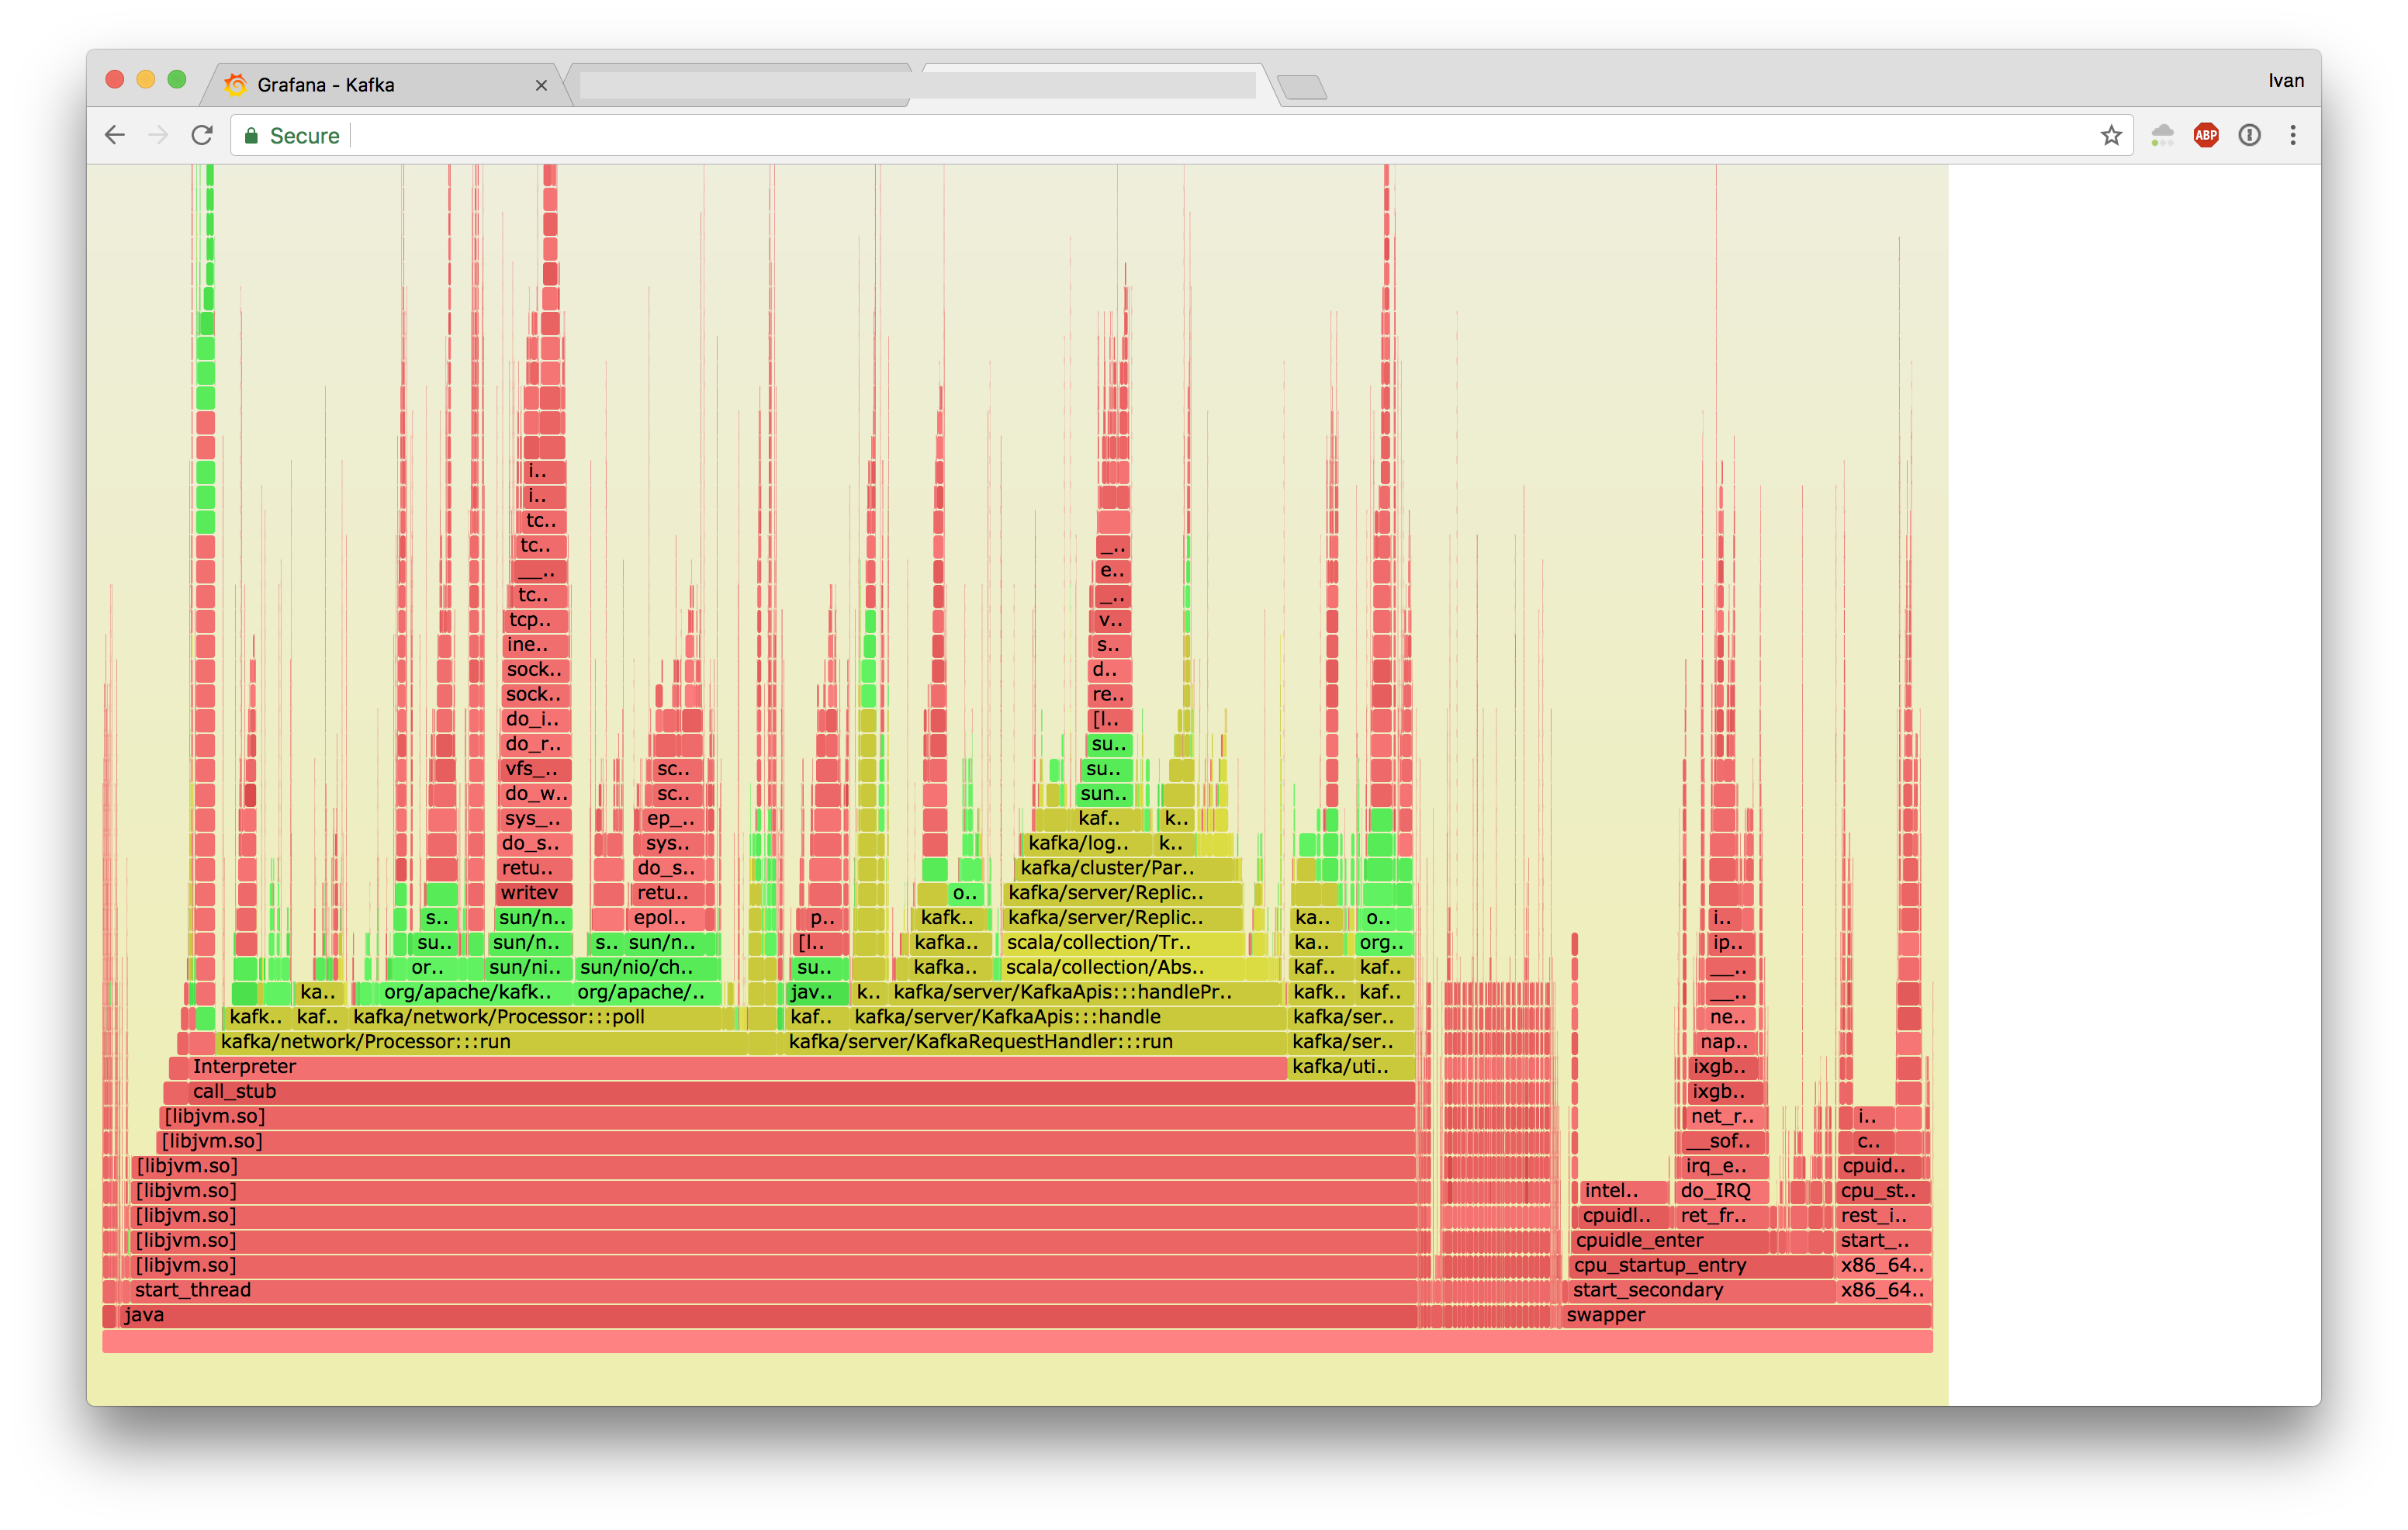
- Stretch

At first it looked like Jessie was doing writev instead of sendfile, but the full flamegraphs revealed that Strech was executing sendfile a lot slower.
If you highlight sendfile:
- Jessie

- Stretch
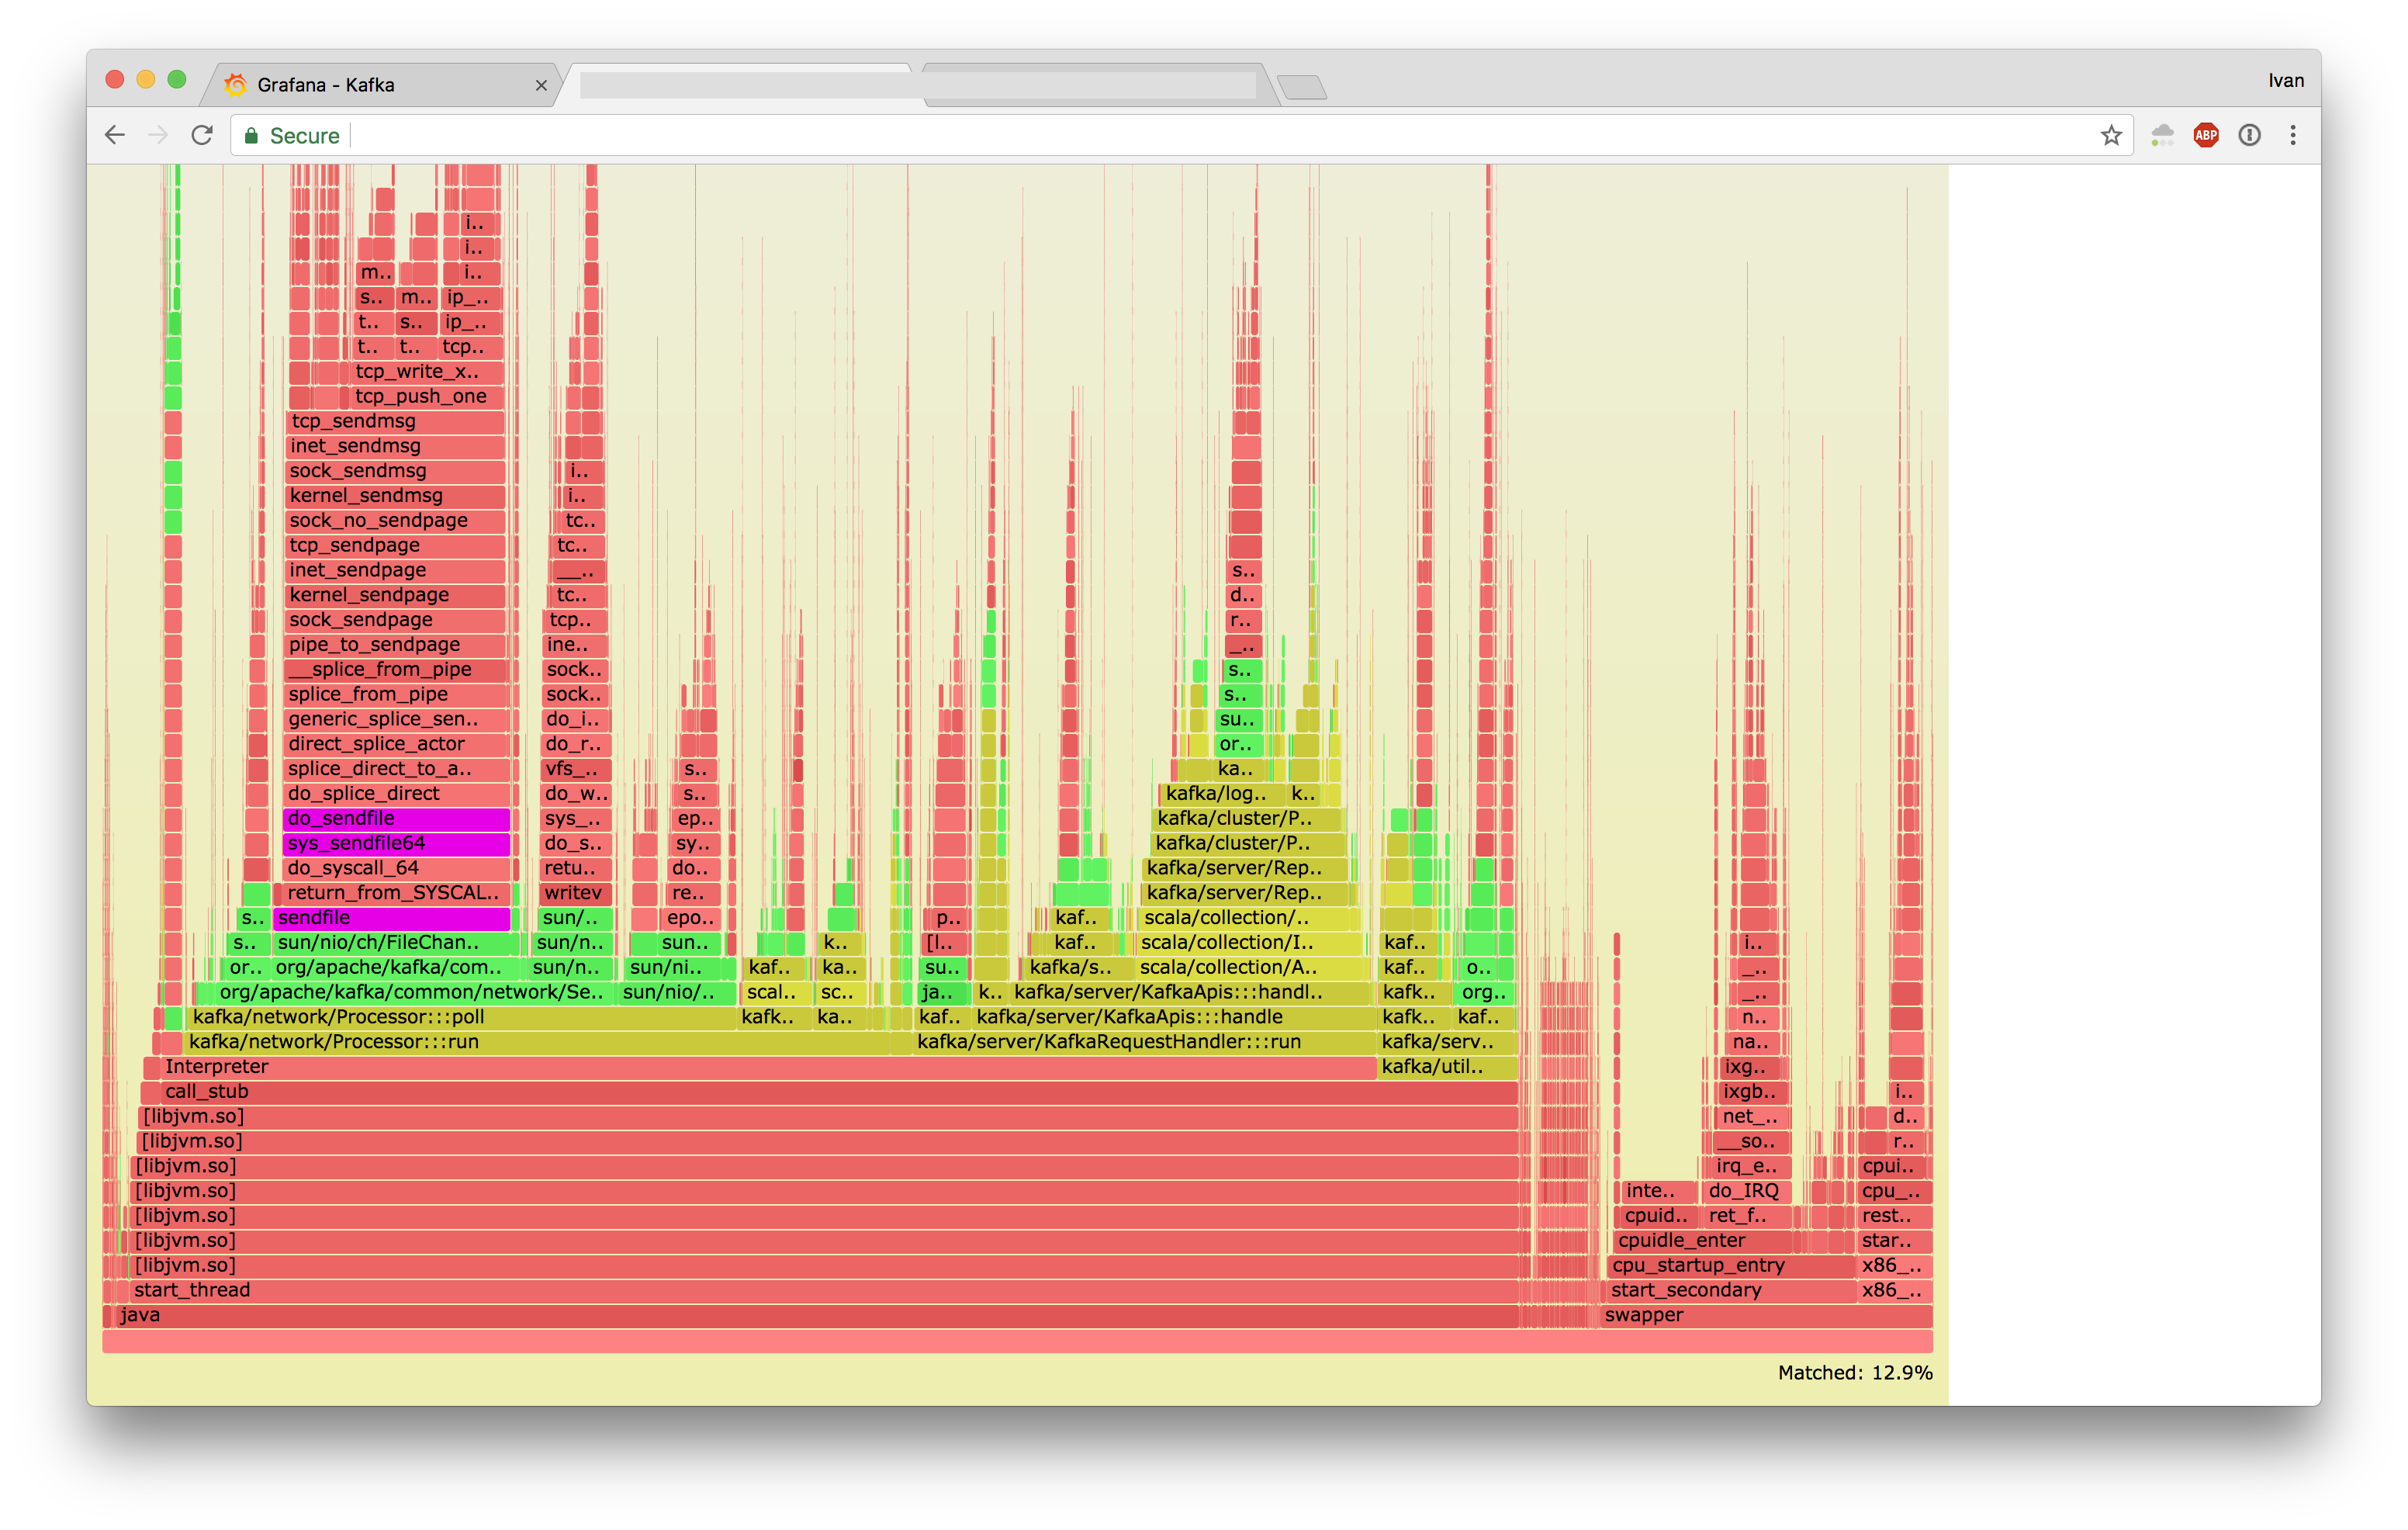
And zoomed in:
- Jessie
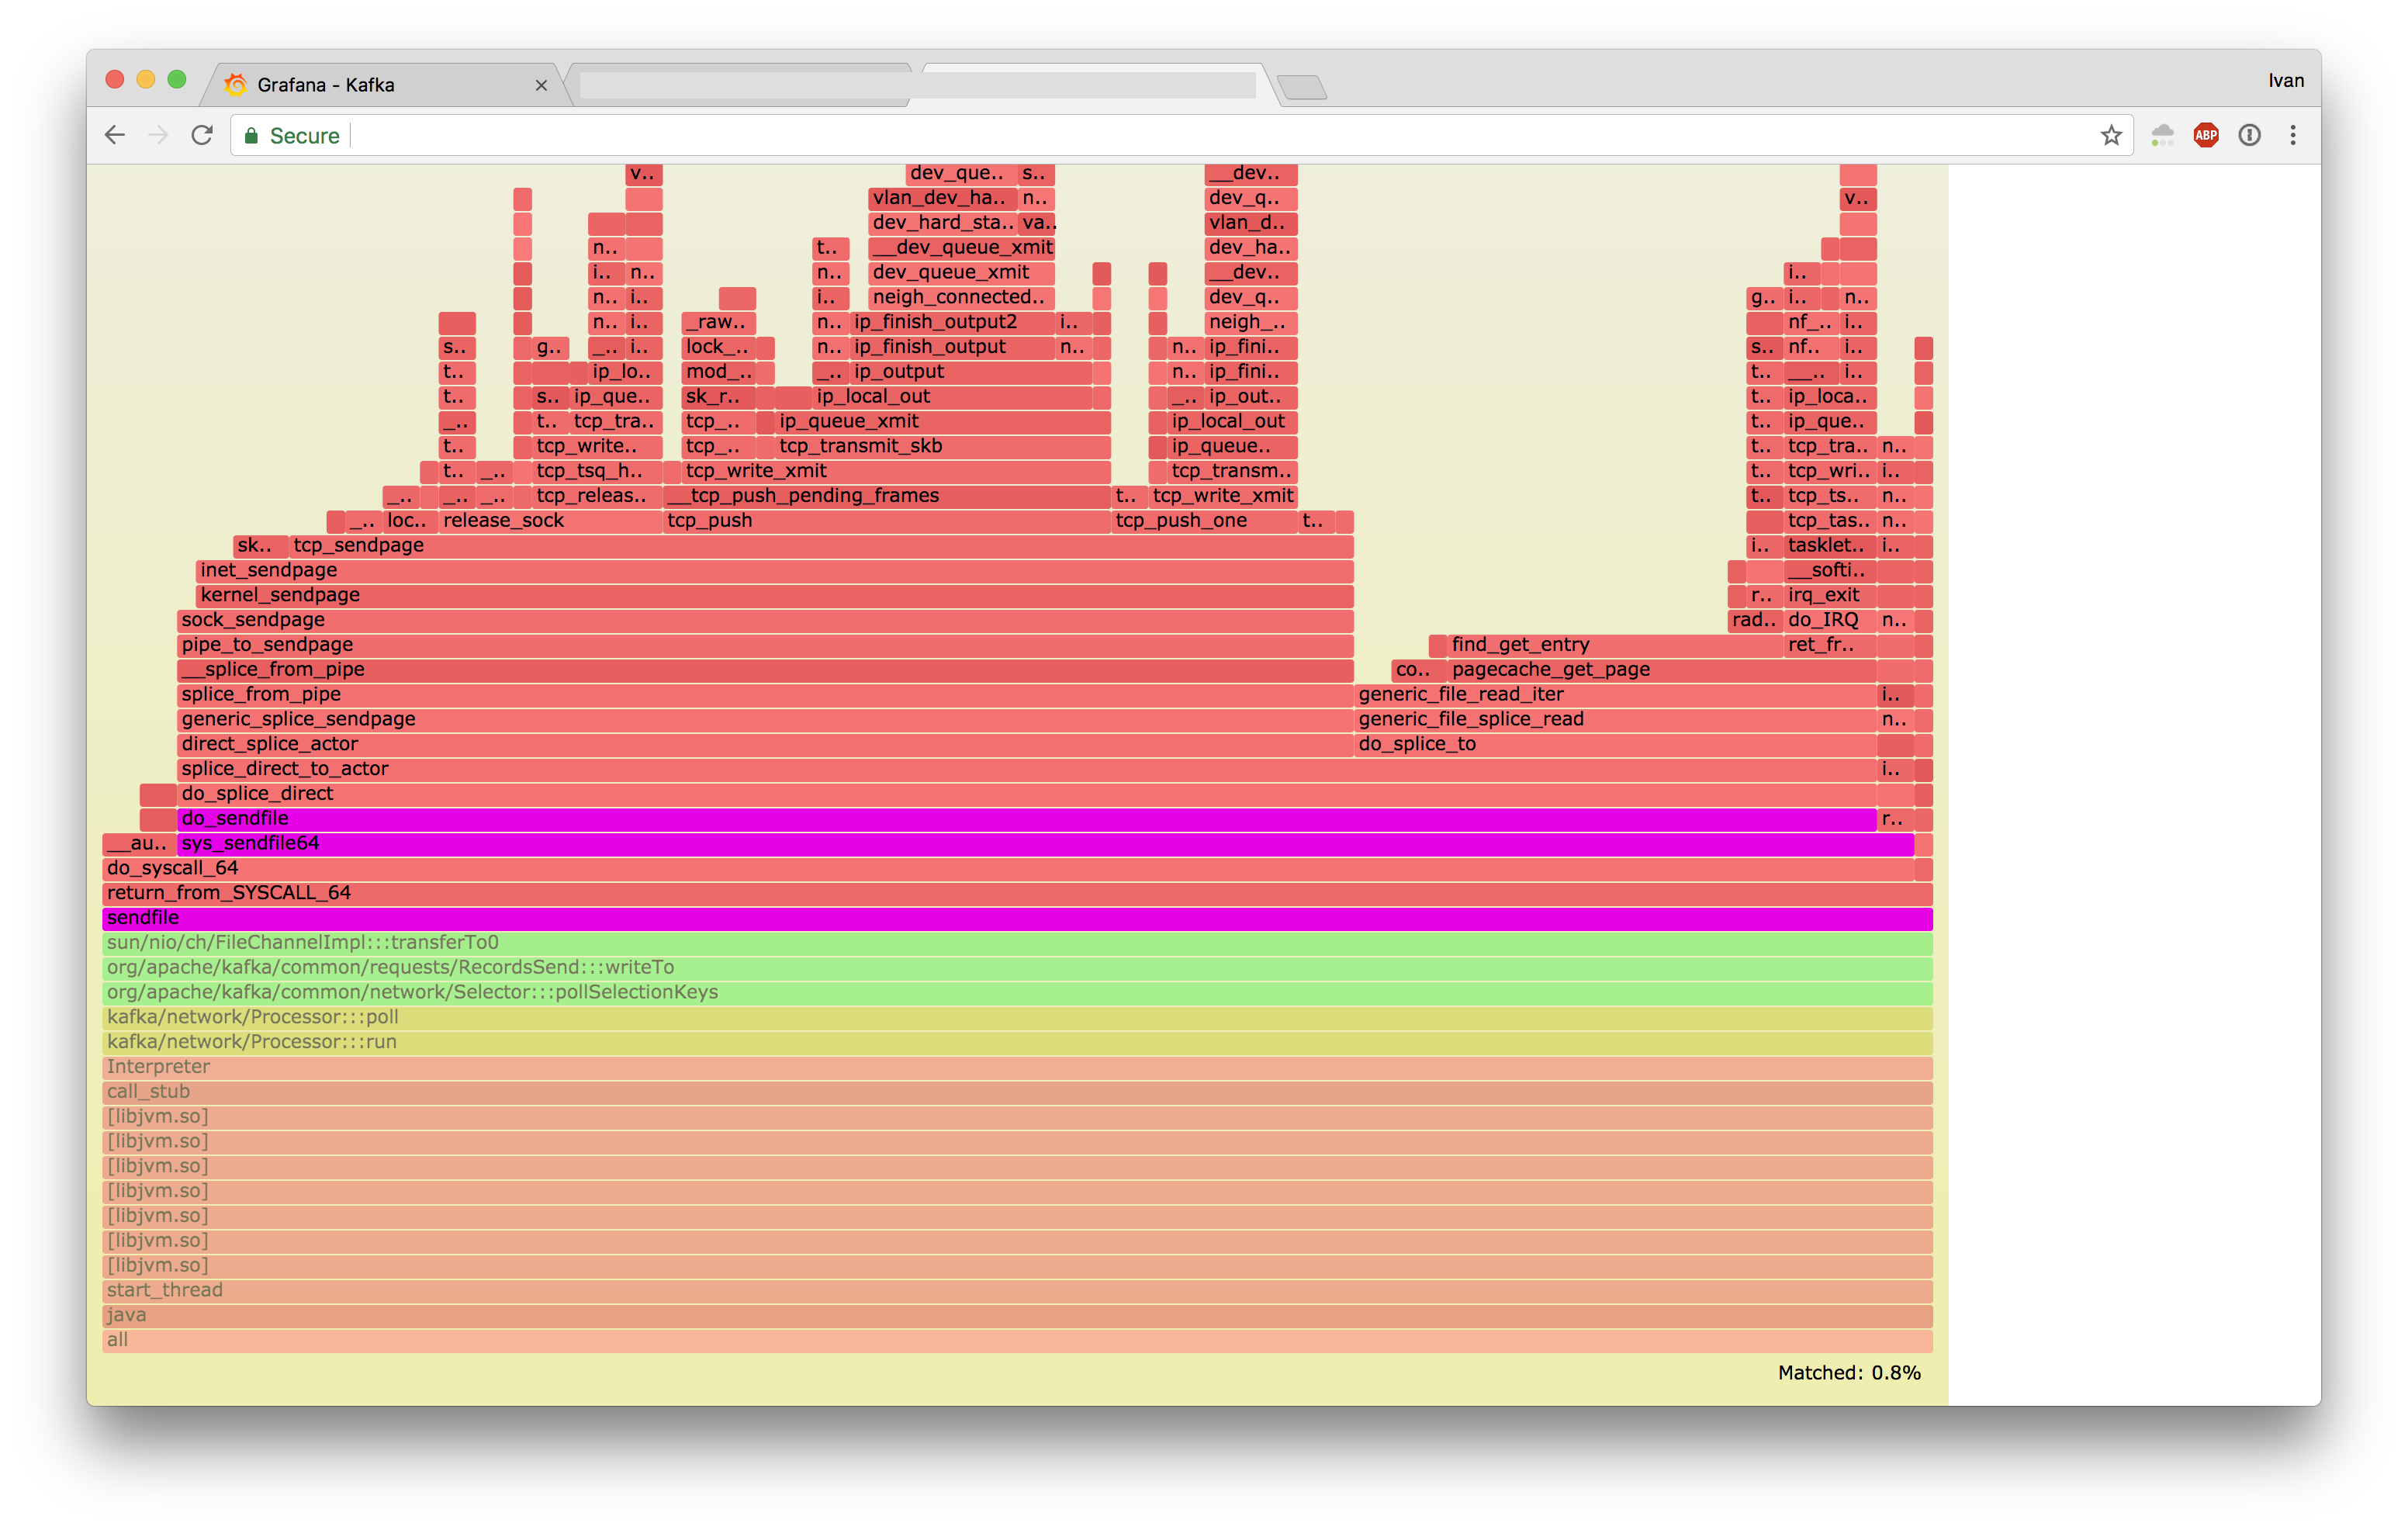
- Stretch
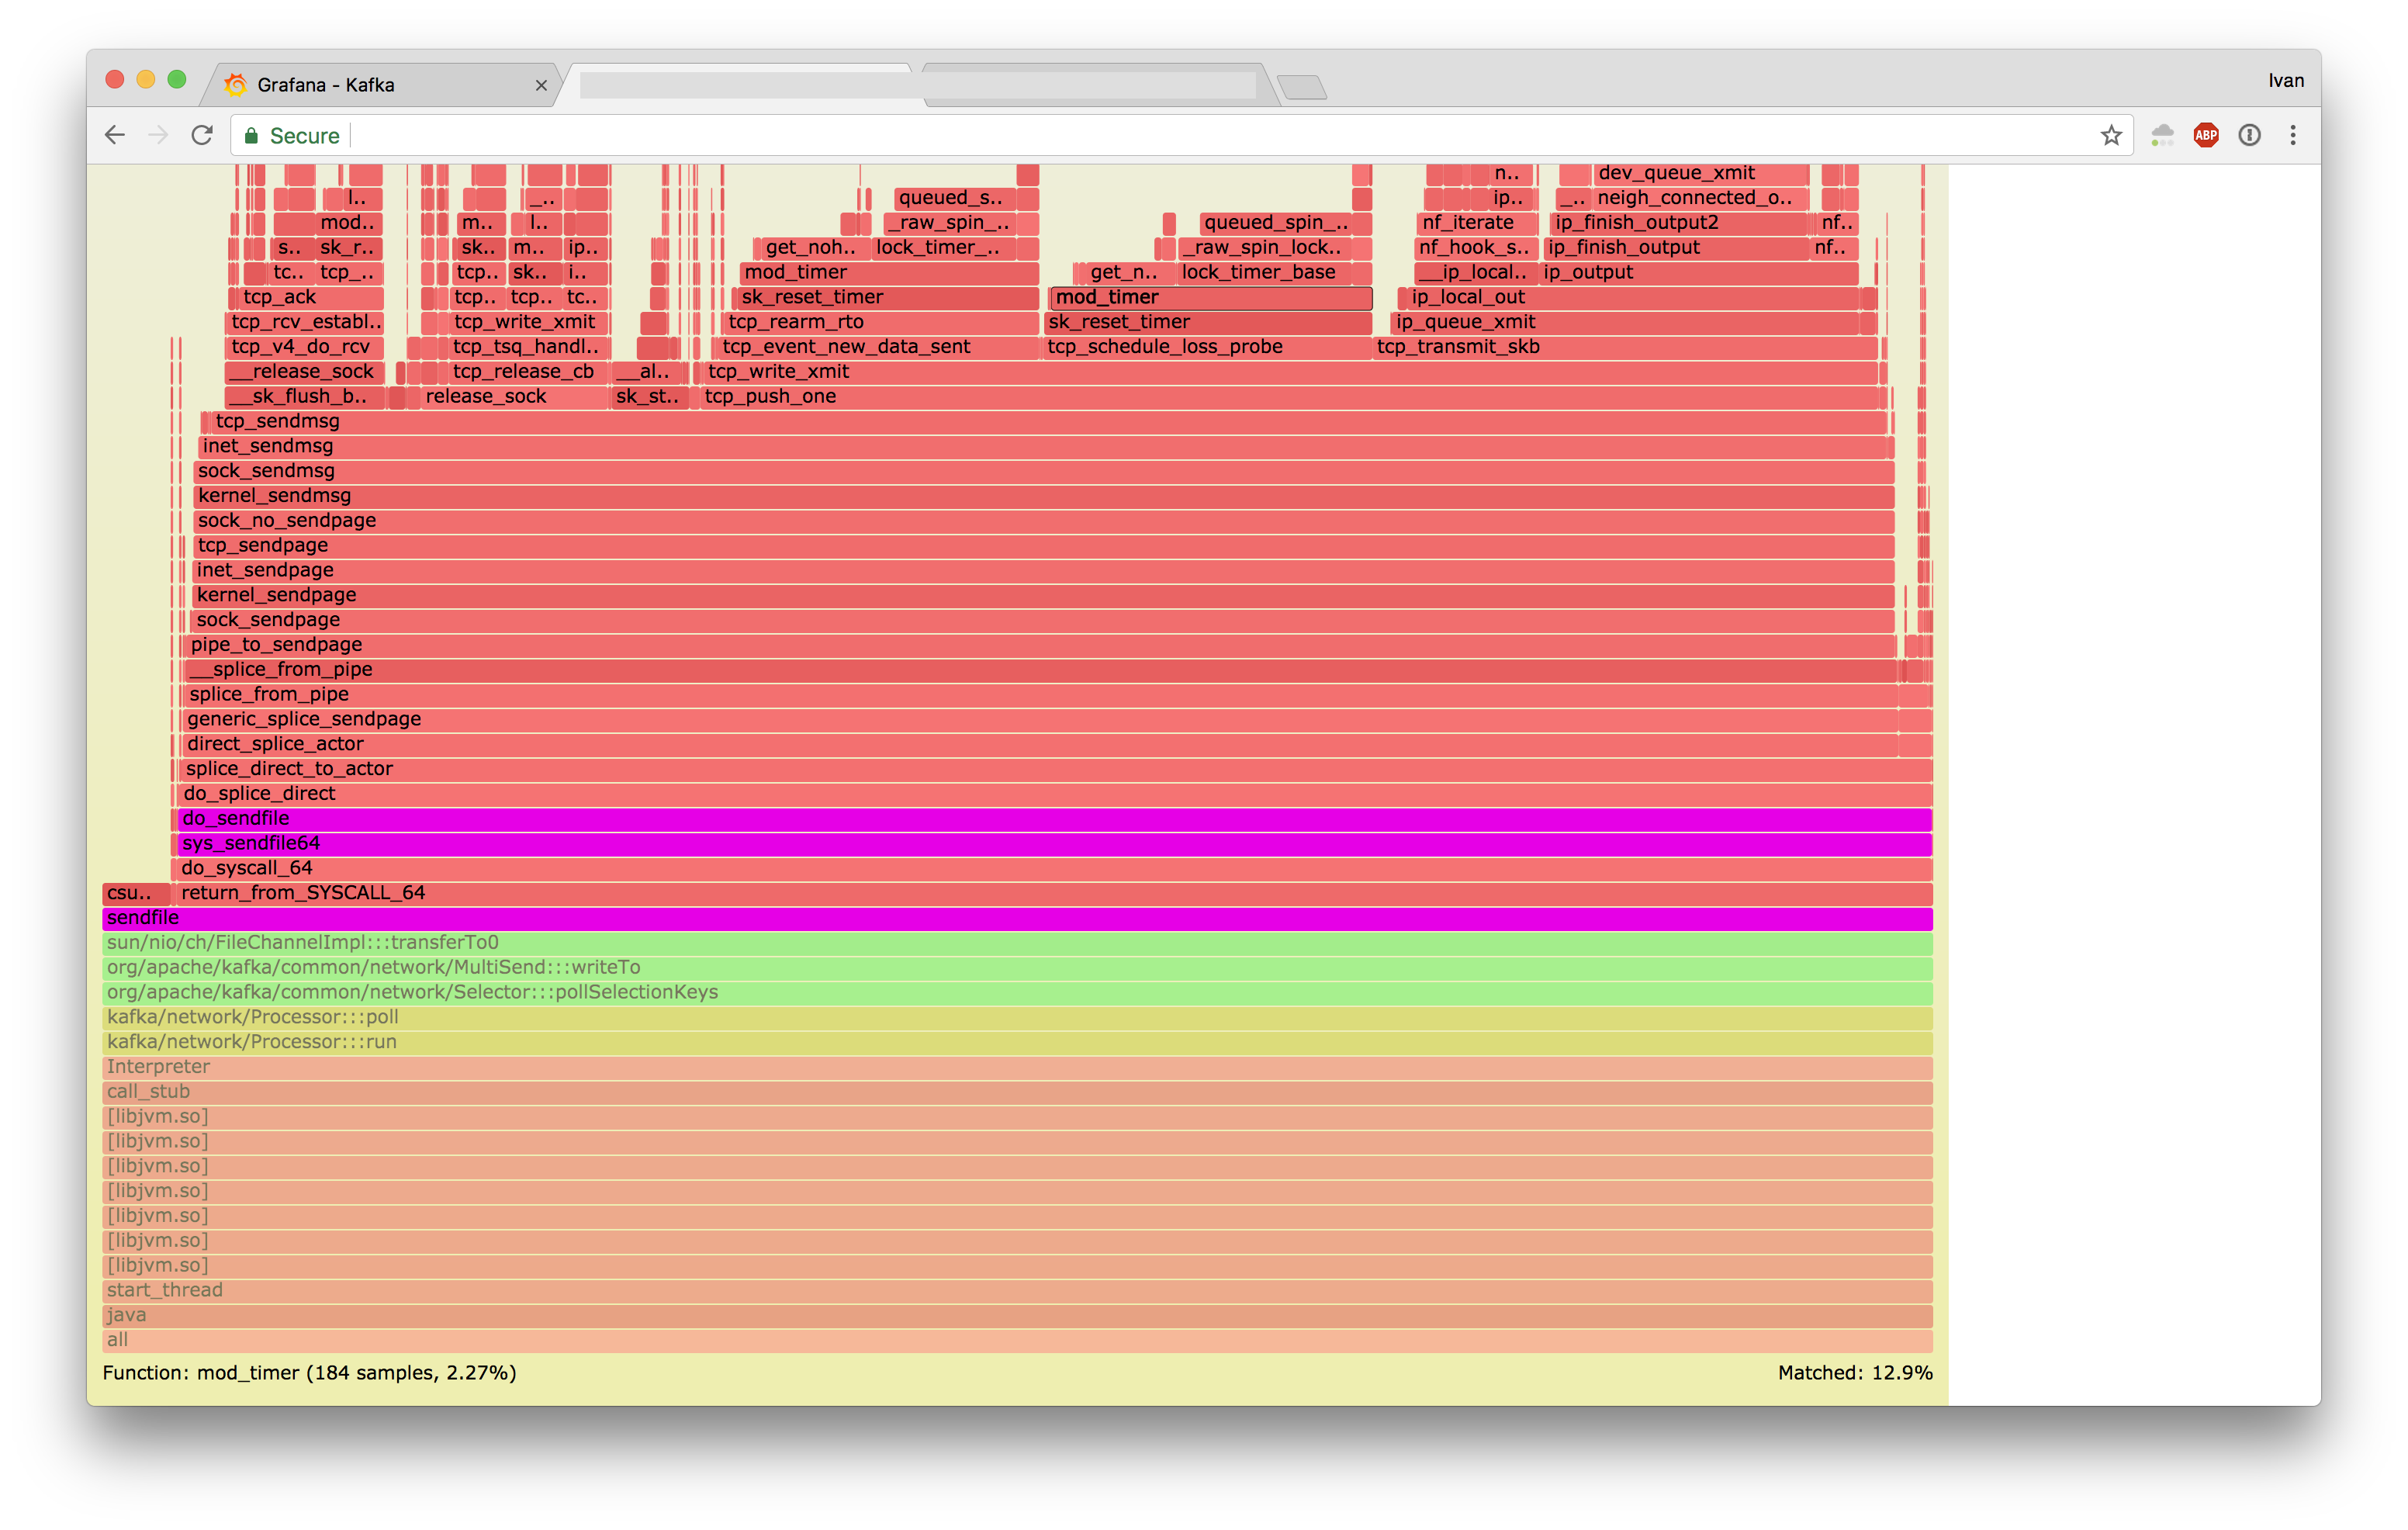
These two look very different.
Some colleagues suggested that the differences in the graphs may be due to TCP offload being disabled, but upon checking our NIC settings, we found that the feature flags were identical.
We'll dive into the differences in the next section.
And deeper
To trace latency distributions of sendfile syscalls between Jessie and Stretch, we used funclatency from bcc-tools:
- Jessie
$ sudo /usr/share/bcc/tools/funclatency -uTi 1 do_sendfile
Tracing 1 functions for "do_sendfile"... Hit Ctrl-C to end.
23:27:25
     usecs               : count     distribution
         0 -> 1          : 9        |                                        |
         2 -> 3          : 47       |****                                    |
         4 -> 7          : 53       |*****                                   |
         8 -> 15         : 379      |****************************************|
        16 -> 31         : 329      |**********************************      |
        32 -> 63         : 101      |**********                              |
        64 -> 127        : 23       |**                                      |
       128 -> 255        : 50       |*****                                   |
       256 -> 511        : 7        |                                        |
- Stretch
$ sudo /usr/share/bcc/tools/funclatency -uTi 1 do_sendfile
Tracing 1 functions for "do_sendfile"... Hit Ctrl-C to end.
23:27:28
     usecs               : count     distribution
         0 -> 1          : 1        |                                        |
         2 -> 3          : 20       |***                                     |
         4 -> 7          : 46       |*******                                 |
         8 -> 15         : 56       |********                                |
        16 -> 31         : 65       |**********                              |
        32 -> 63         : 75       |***********                             |
        64 -> 127        : 75       |***********                             |
       128 -> 255        : 258      |****************************************|
       256 -> 511        : 144      |**********************                  |
       512 -> 1023       : 24       |***                                     |
      1024 -> 2047       : 27       |****                                    |
      2048 -> 4095       : 28       |****                                    |
      4096 -> 8191       : 35       |*****                                   |
      8192 -> 16383      : 1        |                                        |
In the flamegraphs, you can see timers being set at the tip (mod_timer function), with these timers taking locks. On Stretch we installed 3x more timers, resulting in 10x the amount of contention:
- Jessie
$ sudo /usr/share/bcc/tools/funccount -T -i 1 mod_timer
Tracing 1 functions for "mod_timer"... Hit Ctrl-C to end.
00:33:36
FUNC                                    COUNT
mod_timer                               60482
00:33:37
FUNC                                    COUNT
mod_timer                               58263
00:33:38
FUNC                                    COUNT
mod_timer                               54626
$ sudo /usr/share/bcc/tools/funccount -T -i 1 lock_timer_base
Tracing 1 functions for "lock_timer_base"... Hit Ctrl-C to end.
00:32:36
FUNC                                    COUNT
lock_timer_base                         15962
00:32:37
FUNC                                    COUNT
lock_timer_base                         16261
00:32:38
FUNC                                    COUNT
lock_timer_base                         15806
- Stretch
$ sudo /usr/share/bcc/tools/funccount -T -i 1 mod_timer
Tracing 1 functions for "mod_timer"... Hit Ctrl-C to end.
00:33:28
FUNC                                    COUNT
mod_timer                              149068
00:33:29
FUNC                                    COUNT
mod_timer                              155994
00:33:30
FUNC                                    COUNT
mod_timer                              160688
$ sudo /usr/share/bcc/tools/funccount -T -i 1 lock_timer_base
Tracing 1 functions for "lock_timer_base"... Hit Ctrl-C to end.
00:32:32
FUNC                                    COUNT
lock_timer_base                        119189
00:32:33
FUNC                                    COUNT
lock_timer_base                        196895
00:32:34
FUNC                                    COUNT
lock_timer_base                        140085
The Linux kernel includes debugging facilities for timers, which call the timer:timer_start tracepoint on every timer start. This allowed us to pull up timer names:
- Jessie
$ sudo perf record -e timer:timer_start -p 23485 -- sleep 10 && sudo perf script | sed 's/.* function=//g' | awk '{ print $1 }' | sort | uniq -c
[ perf record: Woken up 54 times to write data ]
[ perf record: Captured and wrote 17.778 MB perf.data (173520 samples) ]
      6 blk_rq_timed_out_timer
      2 clocksource_watchdog
      5 commit_timeout
      5 cursor_timer_handler
      2 dev_watchdog
     10 garp_join_timer
      2 ixgbe_service_timer
     36 reqsk_timer_handler
   4769 tcp_delack_timer
    171 tcp_keepalive_timer
 168512 tcp_write_timer
- Stretch
$ sudo perf record -e timer:timer_start -p 3416 -- sleep 10 && sudo perf script | sed 's/.* function=//g' | awk '{ print $1 }' | sort | uniq -c
[ perf record: Woken up 671 times to write data ]
[ perf record: Captured and wrote 198.273 MB perf.data (1988650 samples) ]
      6 clocksource_watchdog
      4 commit_timeout
     12 cursor_timer_handler
      2 dev_watchdog
     18 garp_join_timer
      4 ixgbe_service_timer
      1 neigh_timer_handler
      1 reqsk_timer_handler
   4622 tcp_delack_timer
      1 tcp_keepalive_timer
1983978 tcp_write_timer
      1 writeout_period
So basically we install 12x more tcp_write_timer timers, resulting in higher kernel CPU usage.
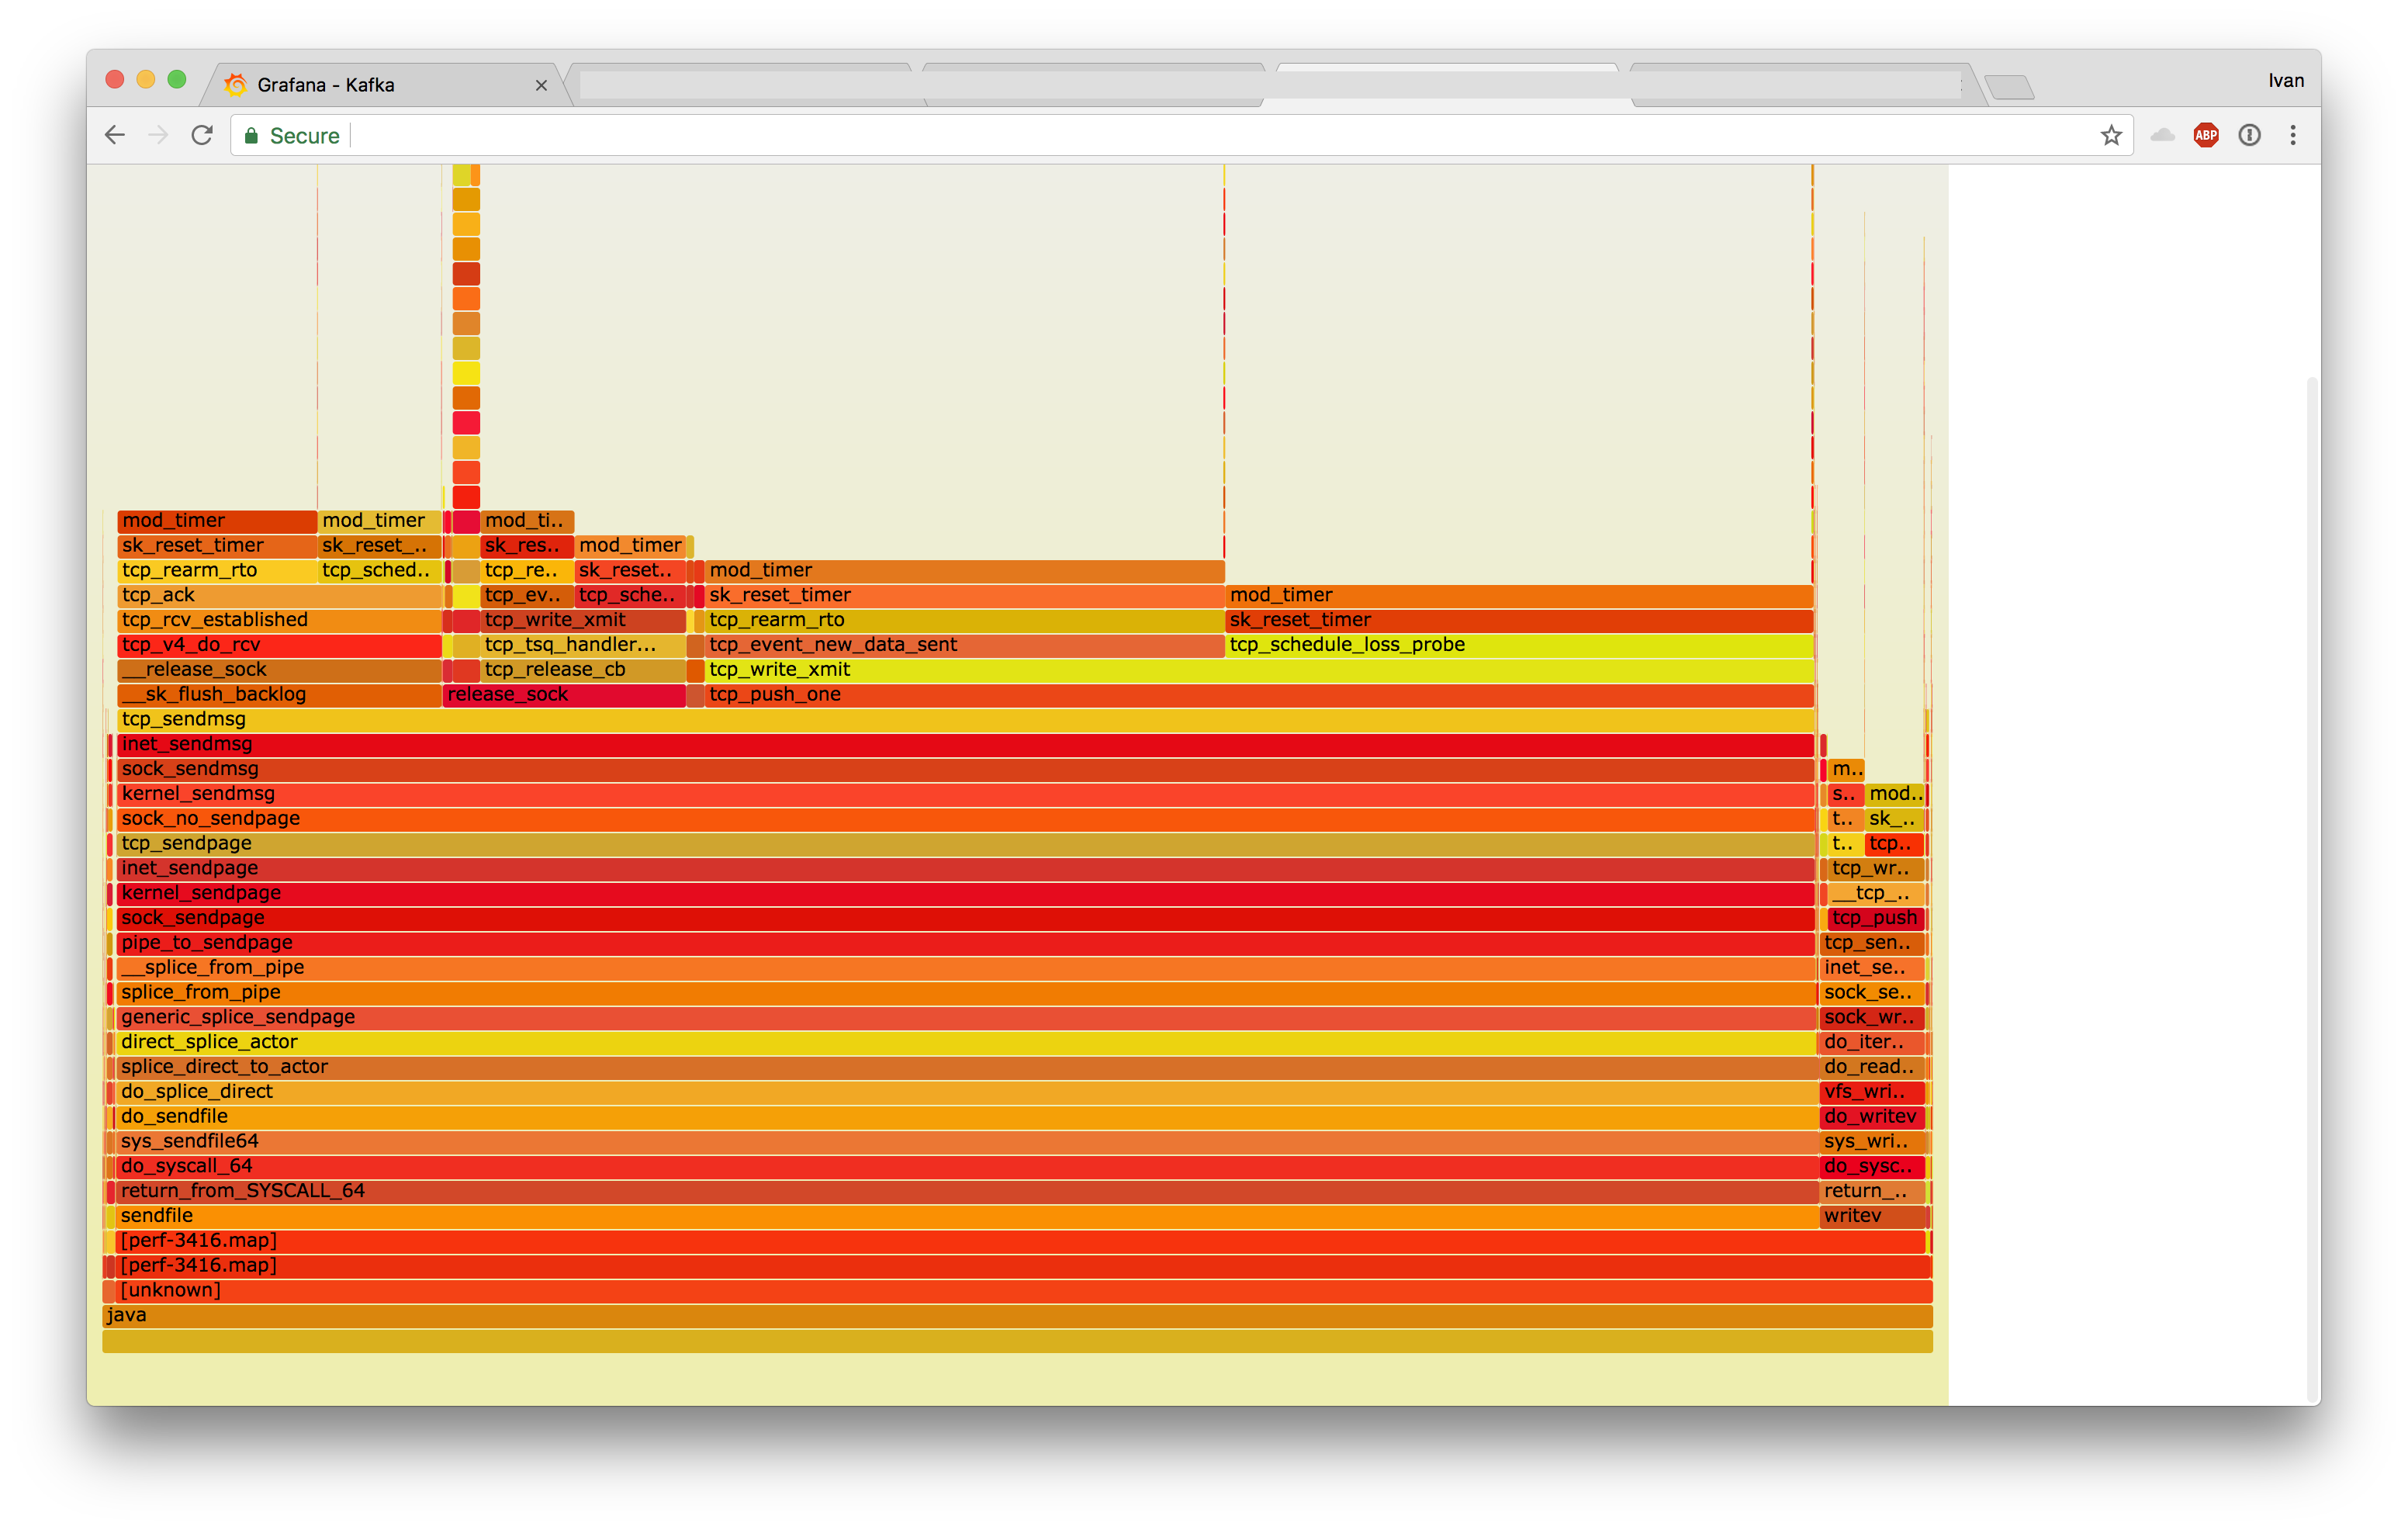
Taking specific flamegraphs of the timers revealed the differences in their operation:
- Jessie
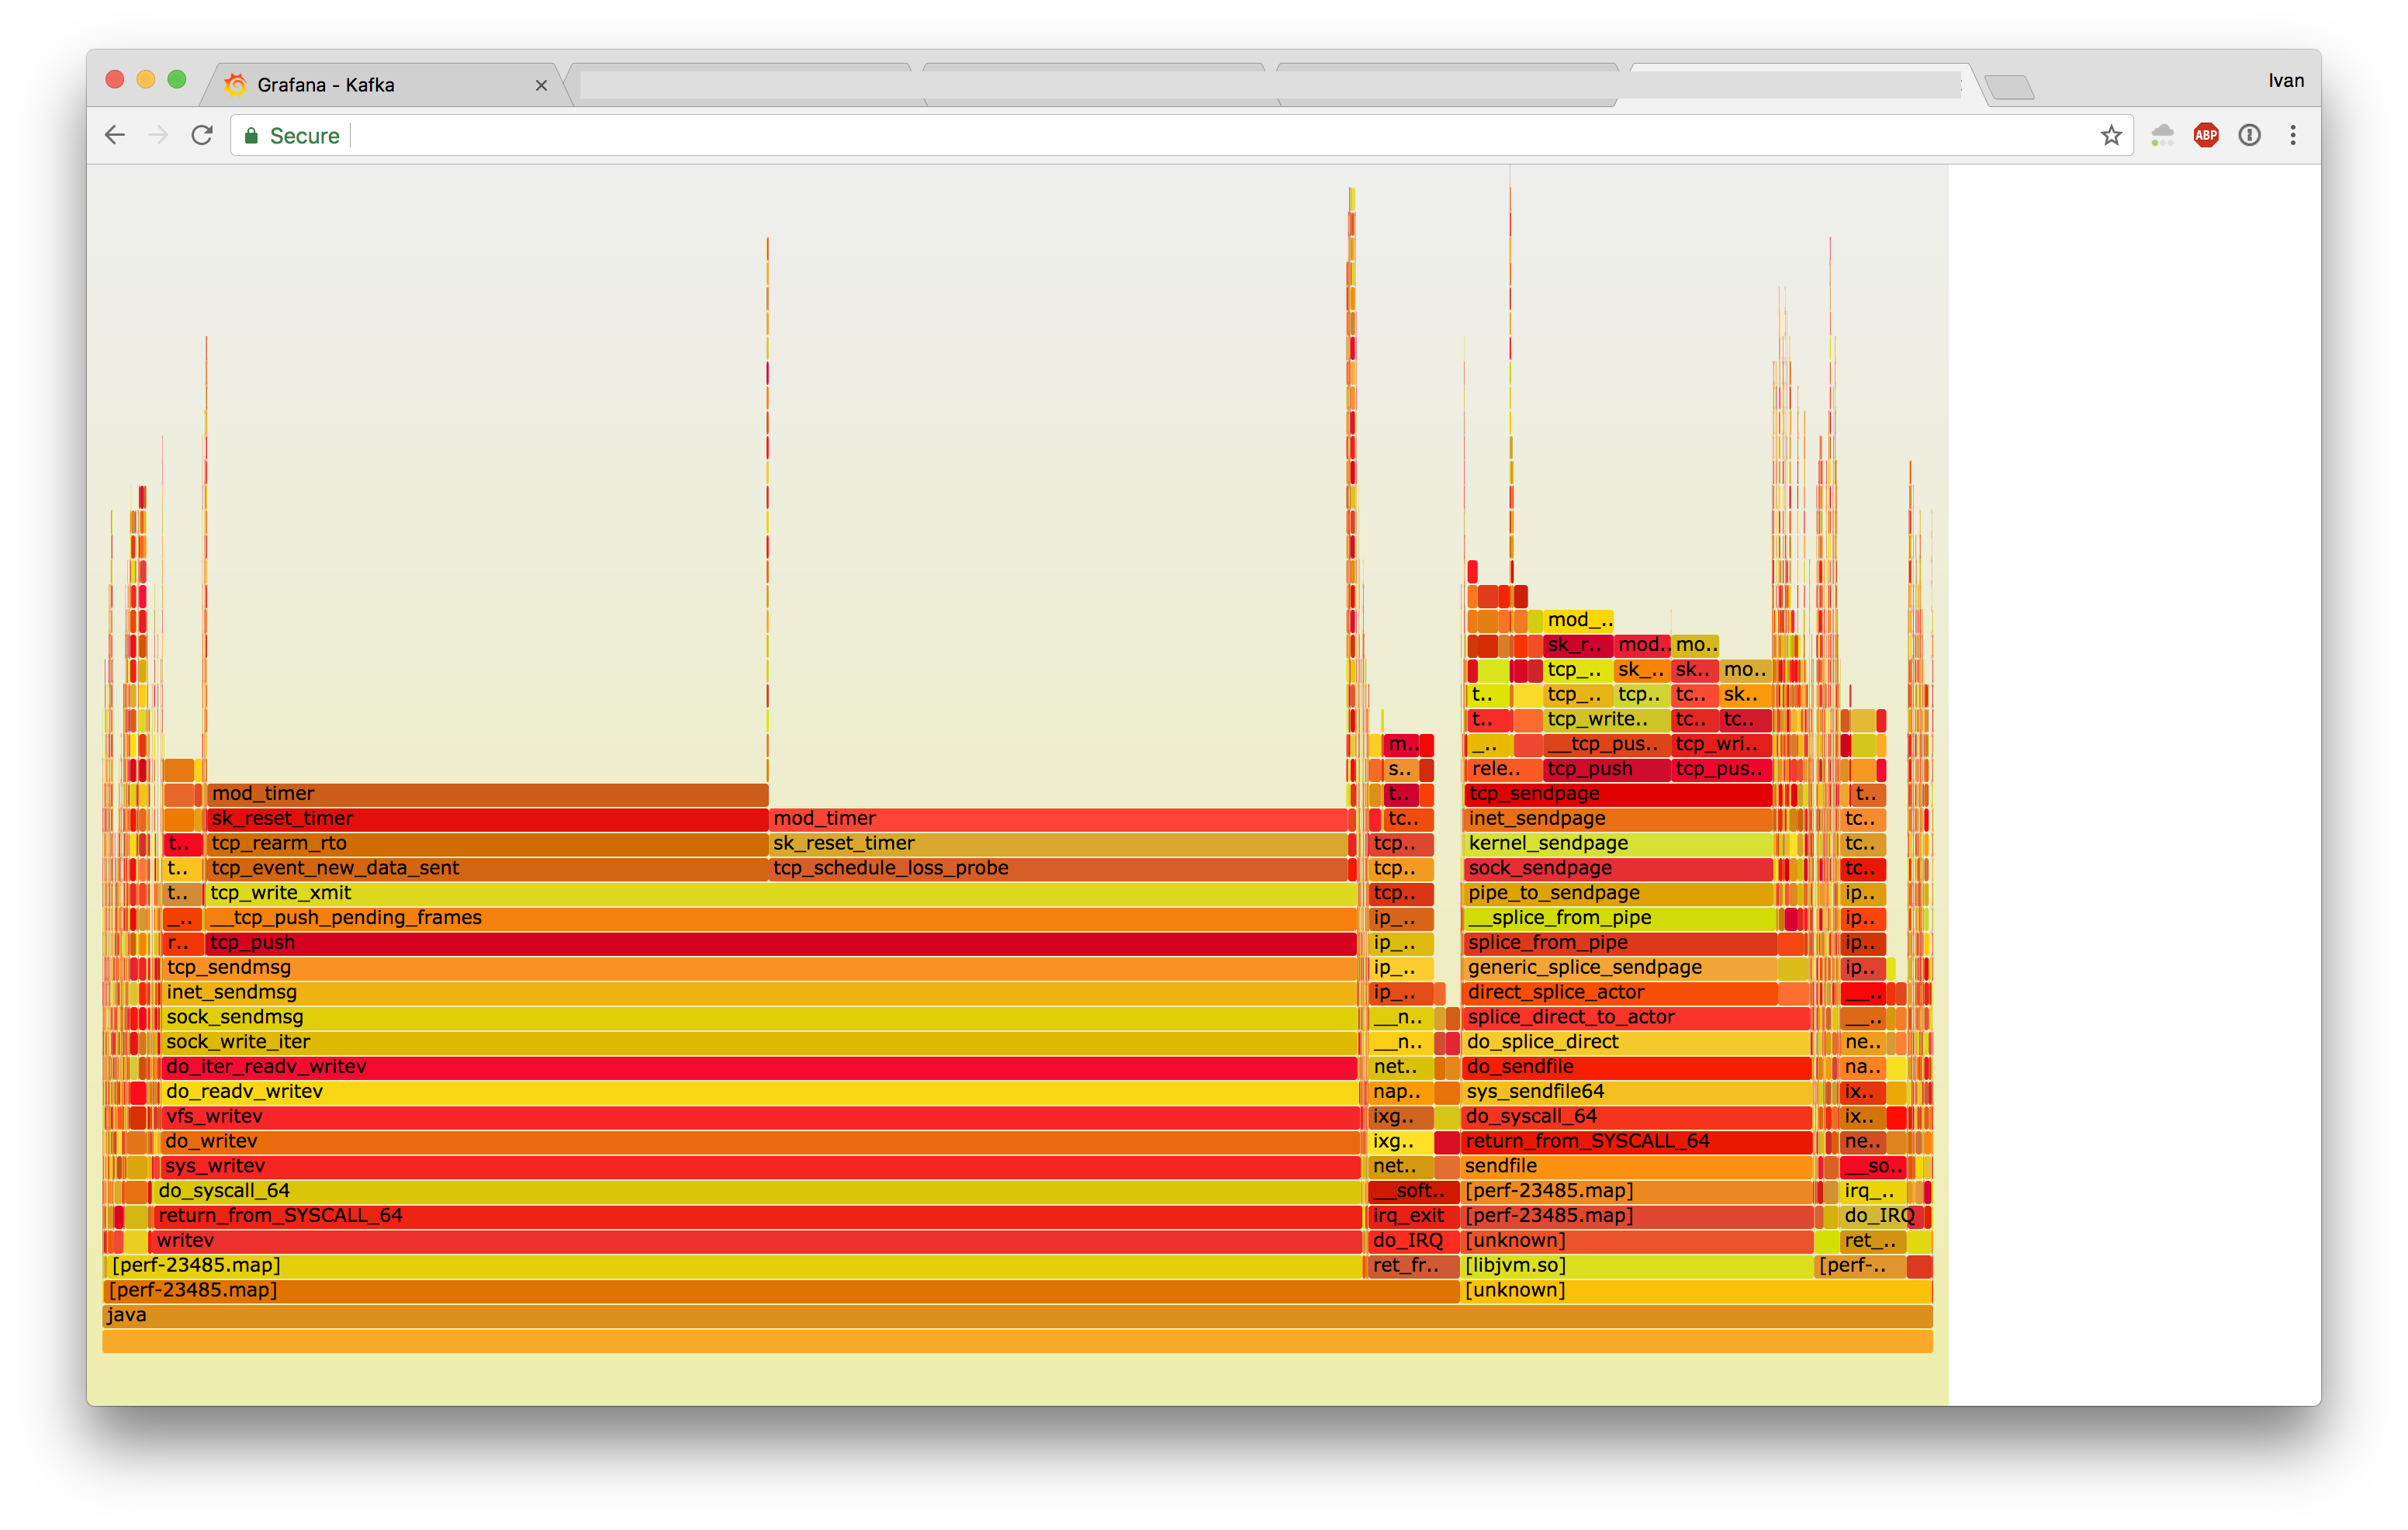
- Stretch
We then traced the functions that were different:
- Jessie
$ sudo /usr/share/bcc/tools/funccount -T -i 1 tcp_sendmsg
Tracing 1 functions for "tcp_sendmsg"... Hit Ctrl-C to end.
03:33:33
FUNC                                    COUNT
tcp_sendmsg                             21166
03:33:34
FUNC                                    COUNT
tcp_sendmsg                             21768
03:33:35
FUNC                                    COUNT
tcp_sendmsg                             21712
$ sudo /usr/share/bcc/tools/funccount -T -i 1 tcp_push_one
Tracing 1 functions for "tcp_push_one"... Hit Ctrl-C to end.
03:37:14
FUNC                                    COUNT
tcp_push_one                              496
03:37:15
FUNC                                    COUNT
tcp_push_one                              432
03:37:16
FUNC                                    COUNT
tcp_push_one                              495
$ sudo /usr/share/bcc/tools/trace -p 23485 'tcp_sendmsg "%d", arg3' -T -M 100000 | awk '{ print $NF }' | sort | uniq -c | sort -n | tail
   1583 4
   2043 54
   3546 18
   4016 59
   4423 50
   5349 8
   6154 40
   6620 38
  17121 51
  39528 44
- Stretch
$ sudo /usr/share/bcc/tools/funccount -T -i 1 tcp_sendmsg
Tracing 1 functions for "tcp_sendmsg"... Hit Ctrl-C to end.
03:33:30
FUNC                                    COUNT
tcp_sendmsg                             53834
03:33:31
FUNC                                    COUNT
tcp_sendmsg                             49472
03:33:32
FUNC                                    COUNT
tcp_sendmsg                             51221
$ sudo /usr/share/bcc/tools/funccount -T -i 1 tcp_push_one
Tracing 1 functions for "tcp_push_one"... Hit Ctrl-C to end.
03:37:10
FUNC                                    COUNT
tcp_push_one                            64483
03:37:11
FUNC                                    COUNT
tcp_push_one                            65058
03:37:12
FUNC                                    COUNT
tcp_push_one                            72394
$ sudo /usr/share/bcc/tools/trace -p 3416 'tcp_sendmsg "%d", arg3' -T -M 100000 | awk '{ print $NF }' | sort | uniq -c | sort -n | tail
    396 46
    409 4
   1124 50
   1305 18
   1547 40
   1672 59
   1729 8
   2181 38
  19052 44
  64504 4096
The traces showed huge variations of tcp_sendmsg and tcp_push_one within sendfile.
To further introspect, we leveraged a kernel feature available since 4.9: the ability to count stacks. This led us to measuring what hits tcp_push_one:
- Jessie
$ sudo /usr/share/bcc/tools/stackcount -i 10 tcp_push_one
Tracing 1 functions for "tcp_push_one"... Hit Ctrl-C to end.
  tcp_push_one
  inet_sendmsg
  sock_sendmsg
  sock_write_iter
  do_iter_readv_writev
  do_readv_writev
  vfs_writev
  do_writev
  SyS_writev
  do_syscall_64
  return_from_SYSCALL_64
    1
  tcp_push_one
  inet_sendpage
  kernel_sendpage
  sock_sendpage
  pipe_to_sendpage
  __splice_from_pipe
  splice_from_pipe
  generic_splice_sendpage
  direct_splice_actor
  splice_direct_to_actor
  do_splice_direct
  do_sendfile
  sys_sendfile64
  do_syscall_64
  return_from_SYSCALL_64
    4950
- Stretch
$ sudo /usr/share/bcc/tools/stackcount -i 10 tcp_push_one
Tracing 1 functions for "tcp_push_one"... Hit Ctrl-C to end.
  tcp_push_one
  inet_sendmsg
  sock_sendmsg
  sock_write_iter
  do_iter_readv_writev
  do_readv_writev
  vfs_writev
  do_writev
  SyS_writev
  do_syscall_64
  return_from_SYSCALL_64
    123
  tcp_push_one
  inet_sendmsg
  sock_sendmsg
  sock_write_iter
  __vfs_write
  vfs_write
  SyS_write
  do_syscall_64
  return_from_SYSCALL_64
    172
  tcp_push_one
  inet_sendmsg
  sock_sendmsg
  kernel_sendmsg
  sock_no_sendpage
  tcp_sendpage
  inet_sendpage
  kernel_sendpage
  sock_sendpage
  pipe_to_sendpage
  __splice_from_pipe
  splice_from_pipe
  generic_splice_sendpage
  direct_splice_actor
  splice_direct_to_actor
  do_splice_direct
  do_sendfile
  sys_sendfile64
  do_syscall_64
  return_from_SYSCALL_64
    735110
If you diff the most popular stacks, you'll get:
--- jessie.txt  2017-08-16 21:14:13.000000000 -0700
+++ stretch.txt 2017-08-16 21:14:20.000000000 -0700
@@ -1,4 +1,9 @@
 tcp_push_one
+inet_sendmsg
+sock_sendmsg
+kernel_sendmsg
+sock_no_sendpage
+tcp_sendpage
 inet_sendpage
 kernel_sendpage
 sock_sendpage
Let's look closer at tcp_sendpage:
int tcp_sendpage(struct sock *sk, struct page *page, int offset,
         size_t size, int flags)
{
    ssize_t res;

    if (!(sk->sk_route_caps & NETIF_F_SG) ||
        !sk_check_csum_caps(sk))
        return sock_no_sendpage(sk->sk_socket, page, offset, size,
                    flags);

    lock_sock(sk);

    tcp_rate_check_app_limited(sk);  /* is sending application-limited? */

    res = do_tcp_sendpages(sk, page, offset, size, flags);
    release_sock(sk);
    return res;
}
It looks like we don't enter the if body. We looked up what NET_F_SG does: segmentation offload. This difference is peculiar, since both OS'es should have this enabled.
Even deeper, to the crux
It turned out that we had segmentation offload enabled for only a few of our NICs: eth2, eth3, and bond0. Our network setup can be described as follows:
eth2 -->|              |--> vlan10
        |---> bond0 -->|
eth3 -->|              |--> vlan100
The missing piece was that we were missing segmentation offload on VLAN interfaces, where the actual IPs live.
Here's the diff from ethtook -k vlan10:
$ diff -rup <(ssh jessie sudo ethtool -k vlan10) <(ssh stretch sudo ethtool -k vlan10)
--- /dev/fd/63  2017-08-16 21:21:12.000000000 -0700
+++ /dev/fd/62  2017-08-16 21:21:12.000000000 -0700
@@ -1,21 +1,21 @@
 Features for vlan10:
 rx-checksumming: off [fixed]
-tx-checksumming: off
+tx-checksumming: on
        tx-checksum-ipv4: off [fixed]
-       tx-checksum-ip-generic: off
+       tx-checksum-ip-generic: on
        tx-checksum-ipv6: off [fixed]
        tx-checksum-fcoe-crc: off
        tx-checksum-sctp: off
-scatter-gather: off
-       tx-scatter-gather: off
+scatter-gather: on
+       tx-scatter-gather: on
        tx-scatter-gather-fraglist: off
-tcp-segmentation-offload: off
-       tx-tcp-segmentation: off [requested on]
-       tx-tcp-ecn-segmentation: off [requested on]
-       tx-tcp-mangleid-segmentation: off [requested on]
-       tx-tcp6-segmentation: off [requested on]
-udp-fragmentation-offload: off [requested on]
-generic-segmentation-offload: off [requested on]
+tcp-segmentation-offload: on
+       tx-tcp-segmentation: on
+       tx-tcp-ecn-segmentation: on
+       tx-tcp-mangleid-segmentation: on
+       tx-tcp6-segmentation: on
+udp-fragmentation-offload: on
+generic-segmentation-offload: on
 generic-receive-offload: on
 large-receive-offload: off [fixed]
 rx-vlan-offload: off [fixed]
So we entusiastically enabled segmentation offload:
$ sudo ethtool -K vlan10 sg on
And it didn't help! Will the suffering ever end? Let's also enable TCP transmission checksumming offload:
$ sudo ethtool -K vlan10 tx on
Actual changes:
tx-checksumming: on
        tx-checksum-ip-generic: on
tcp-segmentation-offload: on
        tx-tcp-segmentation: on
        tx-tcp-ecn-segmentation: on
        tx-tcp-mangleid-segmentation: on
        tx-tcp6-segmentation: on
udp-fragmentation-offload: on
Nothing. The diff is essentially empty now:
$ diff -rup <(ssh jessie sudo ethtool -k vlan10) <(ssh stretch sudo ethtool -k vlan10)
--- /dev/fd/63  2017-08-16 21:31:27.000000000 -0700
+++ /dev/fd/62  2017-08-16 21:31:27.000000000 -0700
@@ -4,11 +4,11 @@ tx-checksumming: on
        tx-checksum-ipv4: off [fixed]
        tx-checksum-ip-generic: on
        tx-checksum-ipv6: off [fixed]
-       tx-checksum-fcoe-crc: off [requested on]
-       tx-checksum-sctp: off [requested on]
+       tx-checksum-fcoe-crc: off
+       tx-checksum-sctp: off
 scatter-gather: on
        tx-scatter-gather: on
-       tx-scatter-gather-fraglist: off [requested on]
+       tx-scatter-gather-fraglist: off
 tcp-segmentation-offload: on
        tx-tcp-segmentation: on
        tx-tcp-ecn-segmentation: on
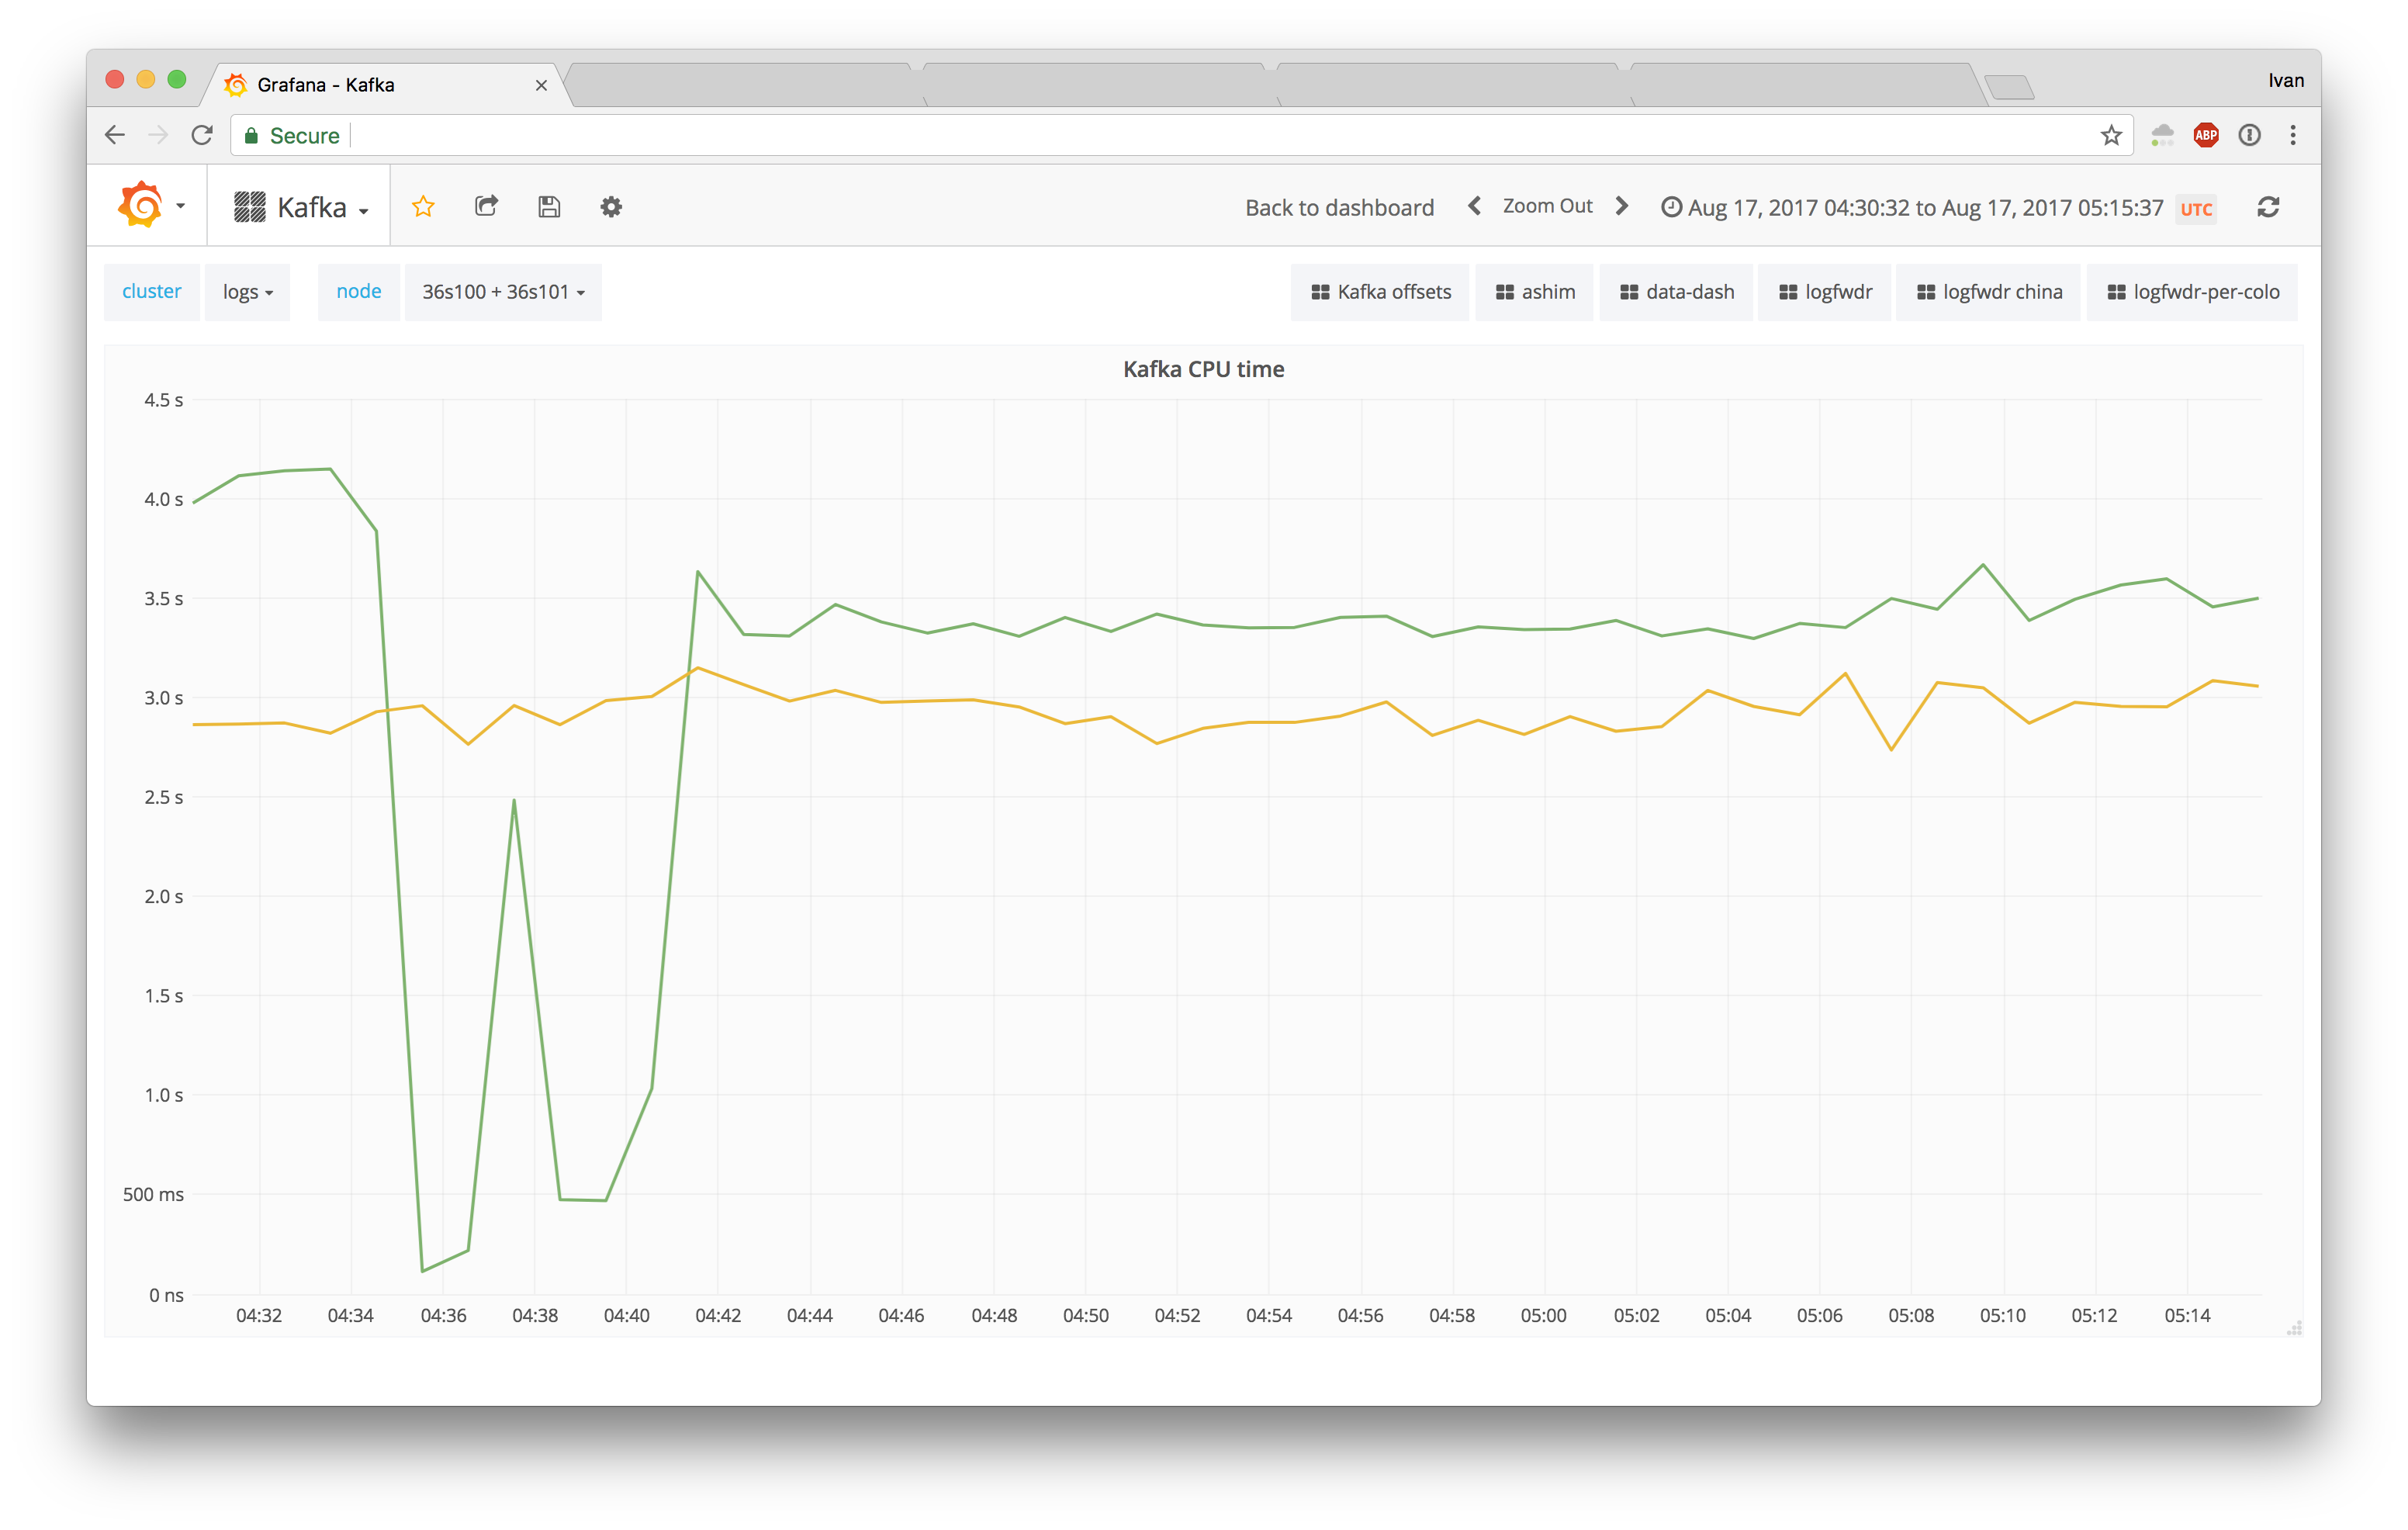
The last missing piece we found was that offload changes are applied only during connection initiation, so we restarted Kafka, and we immediately saw a performance improvement (green line):
Not enabling offload features when possible seems like a pretty bad regression, so we filed a ticket for systemd:
In the meantime, we work around our upstream issue by enabling offload features automatically on boot if they are disabled on VLAN interfaces.
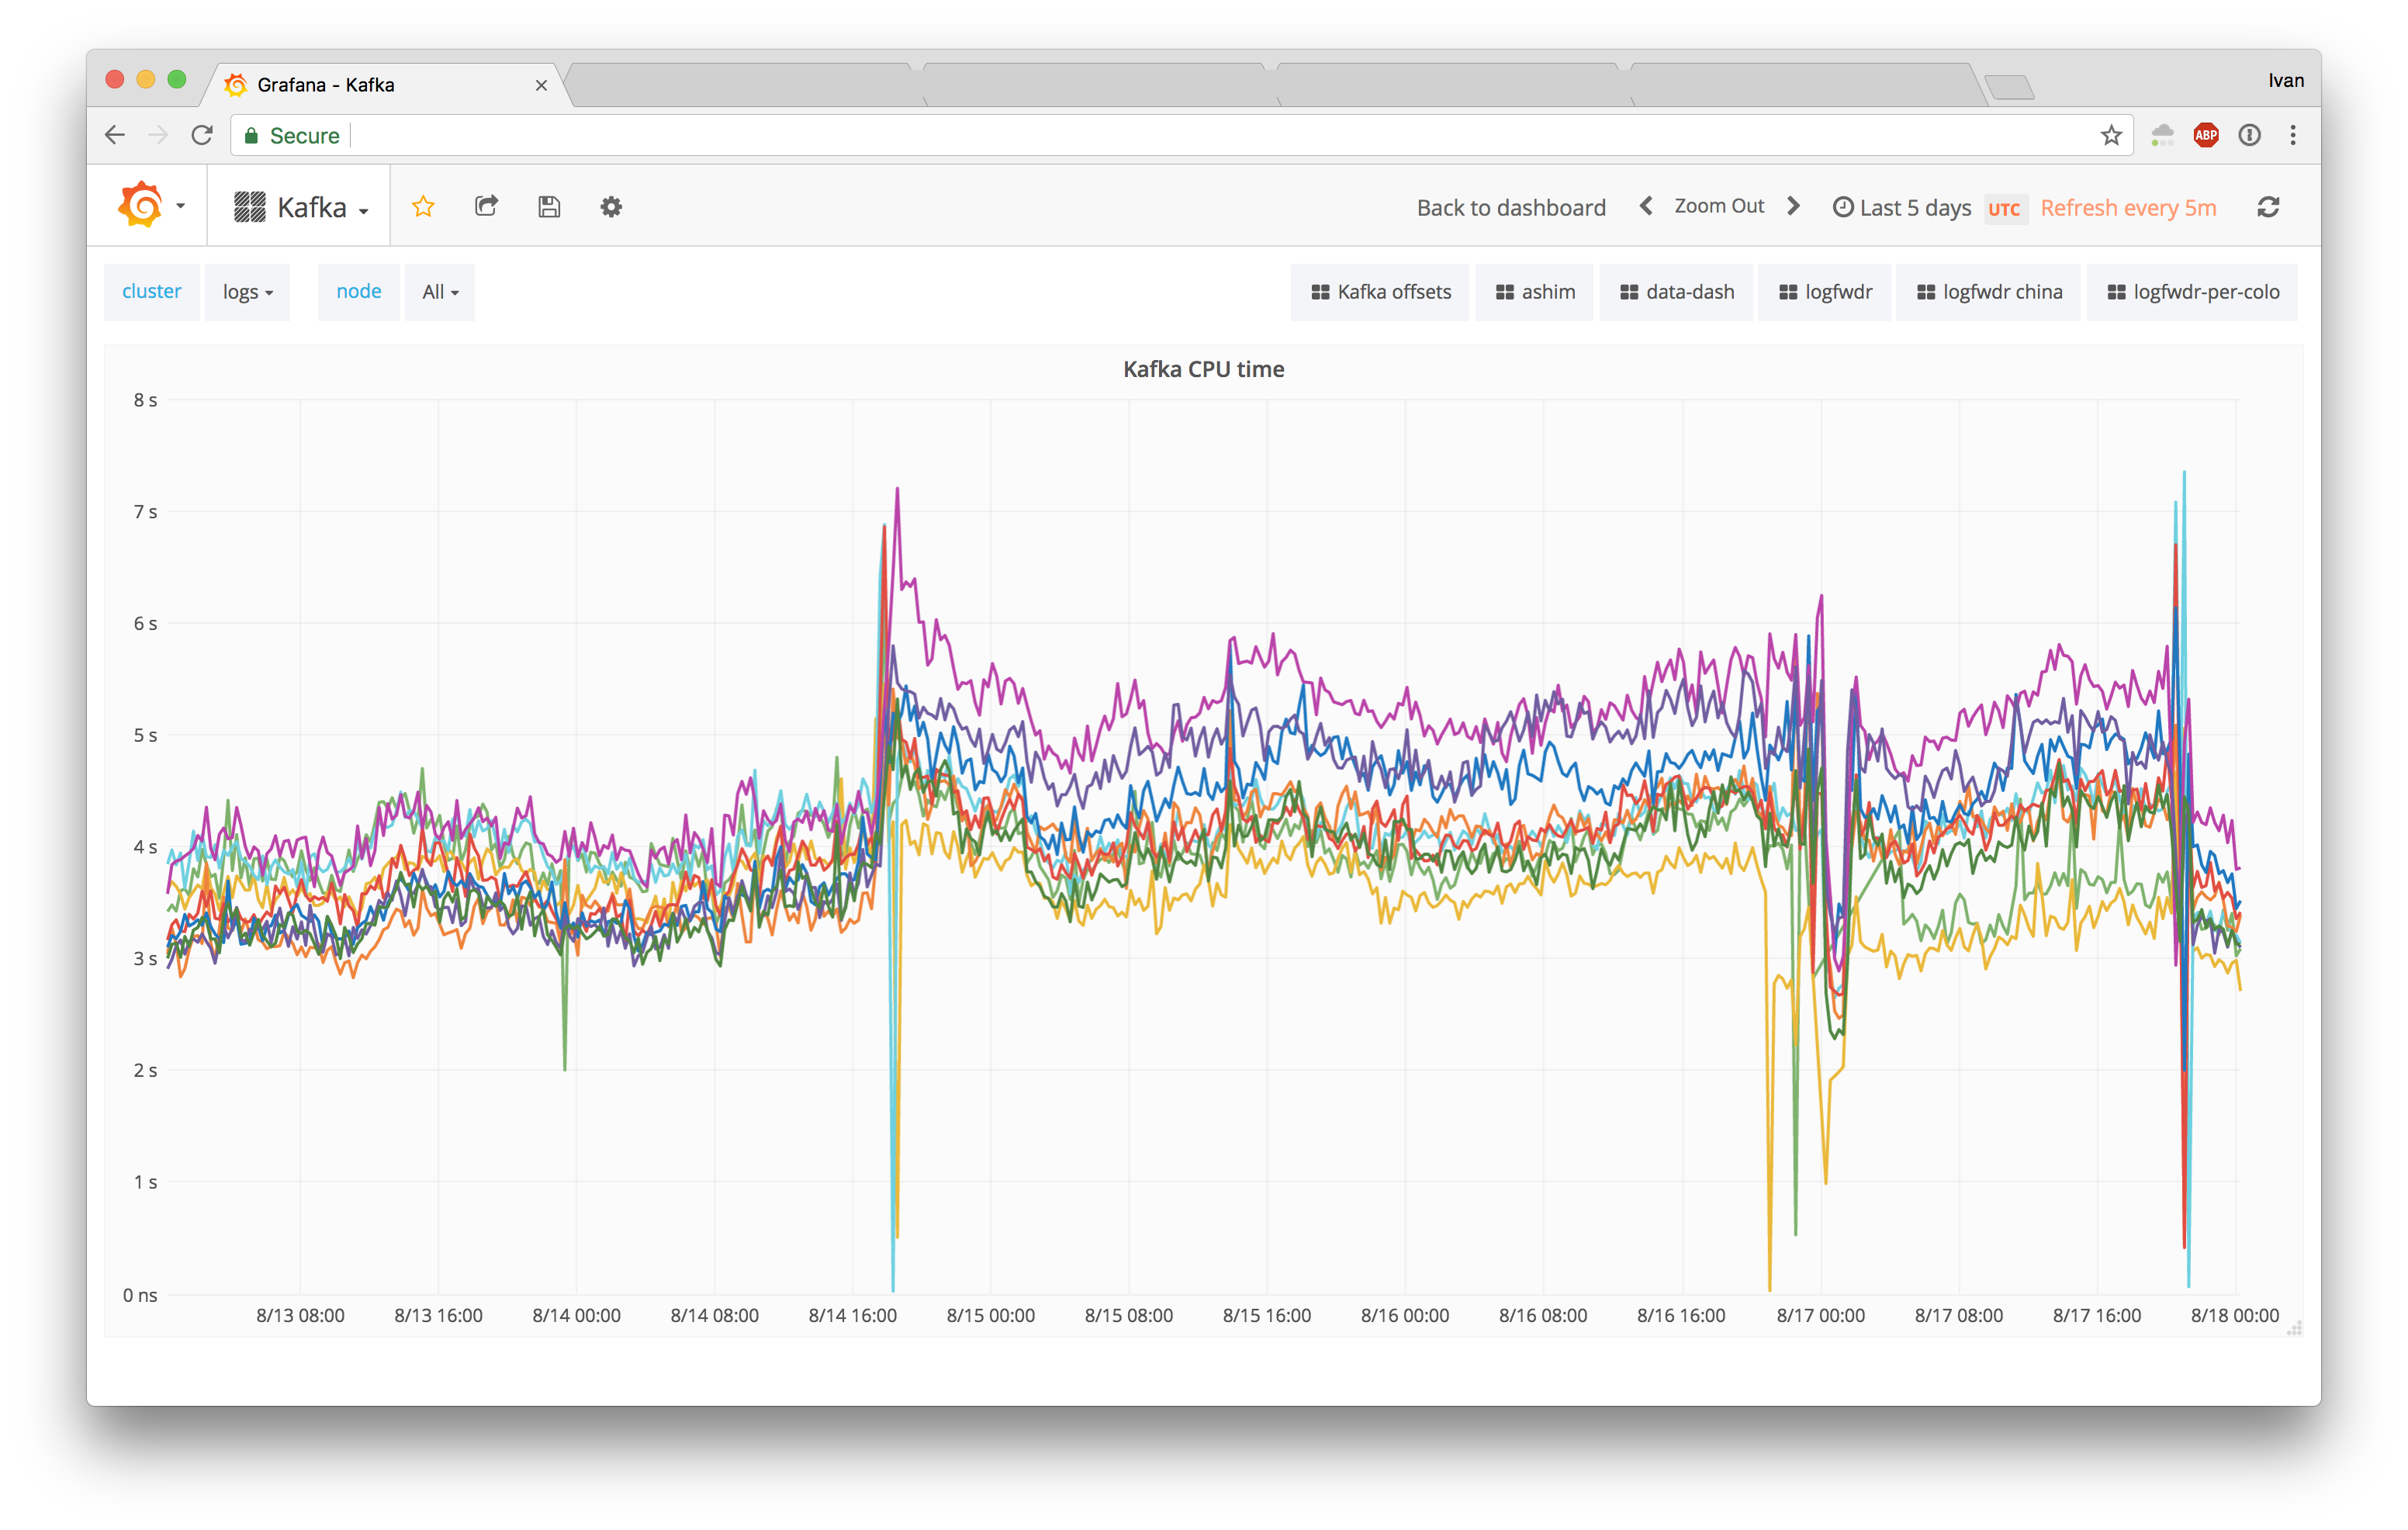
Having a fix enabled, we rebooted our logs Kafka cluster to upgrade to the latest kernel, and our 5 day CPU usage history yielded positive results:
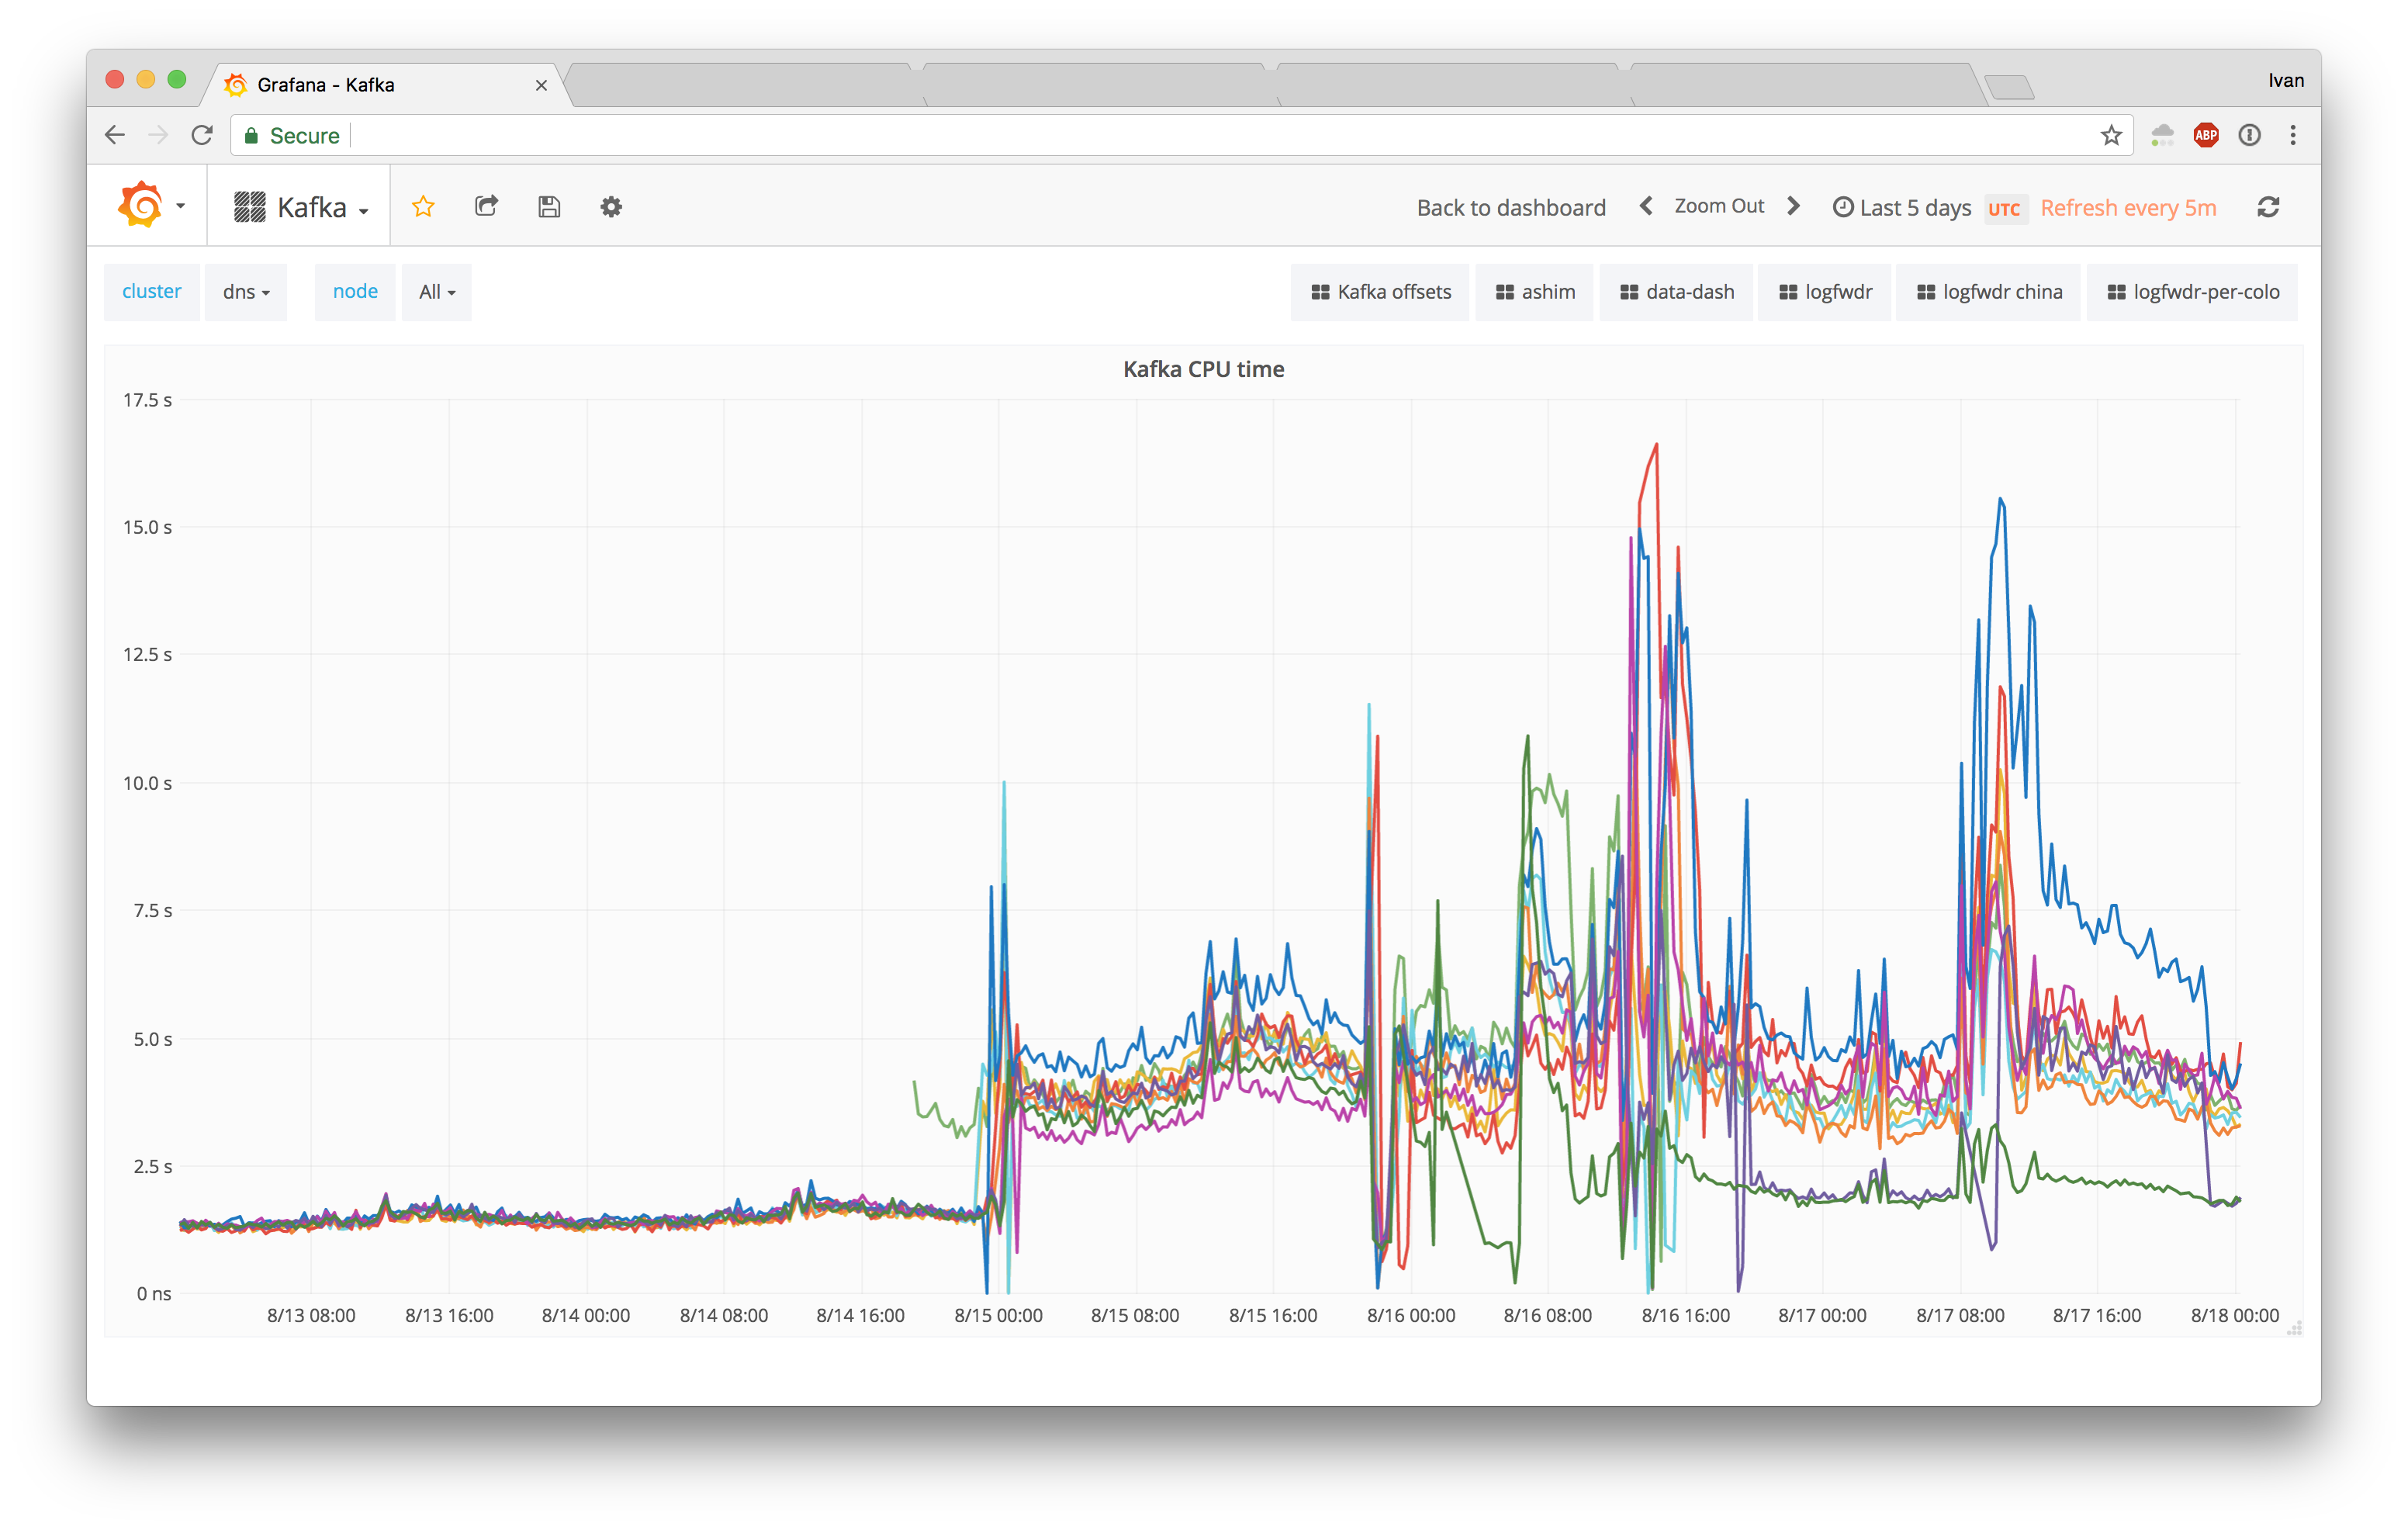
The DNS cluster also yielded positive results, with just 2 nodes rebooted (purple line going down):
Conclusion
It was an error on our part to hit performance degradation without a good regression framework in place to catch the issue. Luckily, due to our heavy use of version control, we managed to bisect the issue rather quickly, and had a temp rollback in place while root causing the problem.
In the end, enabling offload also removed RCU stalls. It's not really clear whether it was the cause or just a catalyst, but the end result speaks for itself.
On the bright side, we dug pretty deep into Linux kernel internals, and although there were fleeting moments of giving up, moving to the woods to become a park ranger, we persevered and came out of the forest successful.
If deep diving from high level symptoms to kernel/OS issues makes you excited, drop us a line.