

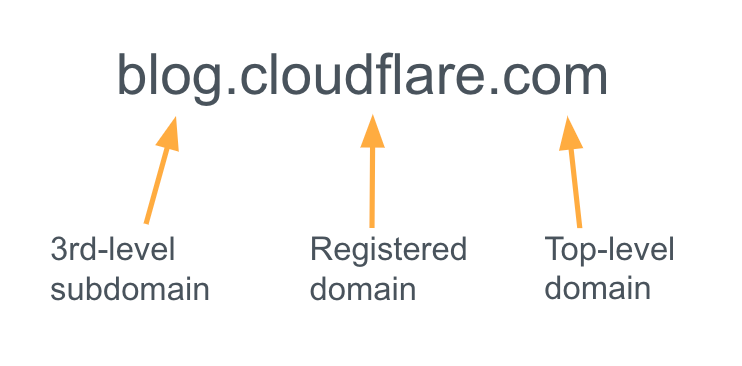
You're browsing your inbox and spot an email that looks like it's from a brand you trust. Yet, something feels off. This might be a phishing attempt, a common tactic where cybercriminals impersonate reputable entities — we've written about the top 50 most impersonated brands used in phishing attacks. One factor that can be used to help evaluate the email's legitimacy is its Top-Level Domain (TLD) — the part of the email address that comes after the dot.
In this analysis, we focus on the TLDs responsible for a significant share of malicious or spam emails since January 2023. For the purposes of this blog post, we are considering malicious email messages to be equivalent to phishing attempts. With an average of 9% of 2023's emails processed by Cloudflare’s Cloud Email Security service marked as spam and 3% as malicious, rising to 4% by year-end, we aim to identify trends and signal which TLDs have become more dubious over time. Keep in mind that our measurements represent where we observe data across the email delivery flow. In some cases, we may be observing after initial filtering has taken place, at a point where missed classifications are likely to cause more damage. This information derived from this analysis could serve as a guide for Internet users, corporations, and geeks like us, searching for clues, as Internet detectives, in identifying potential threats. To make this data readily accessible, Cloudflare Radar, our tool for Internet insights, now includes a new section dedicated to email security trends.
Cyber attacks often leverage the guise of authenticity, a tactic Cloudflare thwarted following a phishing scheme similar to the one that compromised Twilio in 2022. The US Cybersecurity and Infrastructure Security Agency (CISA) notes that 90% of cyber attacks start with phishing, and fabricating trust is a key component of successful malicious attacks. We see there are two forms of authenticity that attackers can choose to leverage when crafting phishing messages, visual and organizational. Attacks that leverage visual authenticity rely on attackers using branding elements, like logos or images, to build credibility. Organizationally authentic campaigns rely on attackers using previously established relationships and business dynamics to establish trust and be successful.
Our findings from 2023 reveal that recently introduced generic TLDs (gTLDs), including several linked to the beauty industry, are predominantly used both for spam and malicious attacks. These TLDs, such as .uno, .sbs, and .beauty, all introduced since 2014, have seen over 95% of their emails flagged as spam or malicious. Also, it's important to note that in terms of volume, “.com” accounts for 67% of all spam and malicious emails (more on that below).
Email and Top-Level Domains history
In 1971, Ray Tomlinson sent the first networked email over ARPANET, using the @ character in the address. Five decades later, email remains relevant but also a key entry point for attackers.
Before the advent of the World Wide Web, email standardization and growth in the 1980s, especially within academia and military communities, led to interoperability. Fast forward 40 years, and this interoperability is once again a hot topic, with platforms like Threads, Mastodon, and other social media services aiming for the open communication that Jack Dorsey envisioned for Twitter. So, in 2024, it's clear that social media, messaging apps like Slack, Teams, Google Chat, and others haven't killed email, just as “video didn’t kill the radio star.”
The domain name system, managed by ICANN, encompasses a variety of TLDs, from the classic “.com” (1985) to the newer generic options. There are also the country-specific (ccTLDs), where the Internet Assigned Numbers Authority (IANA) is responsible for determining an appropriate trustee for each ccTLD. An extensive 2014 expansion by ICANN was designed to "increase competition and choice in the domain name space," introducing numerous new options for specific professional, business, and informational purposes, which in turn, also opened up new possibilities for phishing attempts.
3.4 billion unwanted emails
Cloudflare’s Cloud Email Security service is helping protect our customers, and that also comes with insights. In 2022, Cloudflare blocked 2.4 billion unwanted emails, and in 2023 that number rose to over 3.4 billion unwanted emails, 26% of all messages processed. This total includes spam, malicious, and "bulk" (practice of sending a single email message, unsolicited or solicited, to a large number of recipients simultaneously) emails. That means an average of 9.3 million per day, 6500 per minute, 108 per second.
Bear in mind that new customers also make the numbers grow — in this case, driving a 42% increase in unwanted emails from 2022 to 2023. But this gives a sense of scale in this email area. Those unwanted emails can include malicious attacks that are difficult to detect, becoming more frequent, and can have devastating consequences for individuals and businesses that fall victim to them. Below, we’ll give more details on email threats, where malicious messages account for almost 3% of emails averaged across all of 2023 and it shows a growth tendency during the year, with higher percentages in the last months of the year. Let's take a closer look.
Top phishing TLDs (and types of TLDs)
First, let’s start with an 2023 overview of top level domains with a high percentage of spam and malicious messages. Despite excluding TLDs with fewer than 20,000 emails, our analysis covers unwanted emails considered to be spam and malicious from more than 350 different TLDs (and yes, there are many more).
A quick overview highlights the TLDs with the highest rates of spam and malicious attacks as a proportion of their outbound email, those with the largest volume share of spam or malicious emails, and those with the highest rates of just-malicious and just-spam TLD senders. It reveals that newer TLDs, especially those associated with the beauty industry (generally available since 2021 and serving a booming industry), have the highest rates as a proportion of their emails. However, it's relevant to recognize that “.com” accounts for 67% of all spam and malicious emails. Malicious emails often originate from recently created generic TLDs like “.bar”, “.makeup”, or “.cyou”, as well as certain country-code TLDs (ccTLDs) employed beyond their geographical implications.
Focusing on volume share, “.com” dominates the spam + malicious list at 67%, and is joined in the top 3 by another “classic” gTLD, “.net”, at 4%. They also lead by volume when we look separately at the malicious (68% of all malicious emails are “.com” and “.net”) and spam (71%) categories, as shown below. All of the generic TLDs introduced since 2014 represent 13.4% of spam and malicious and over 14% of only malicious emails. These new TLDs (most of them are only available since 2016) are notable sources of both spam and malicious messages. Meanwhile, country-code TLDs contribute to more than 12% of both categories of unwanted emails.
This breakdown highlights the critical role of both established and new generic TLDs, which surpass older ccTLDs in terms of malicious emails, pointing to the changing dynamics of email-based threats.
That said, “.shop” deserves a highlight of its own. The TLD, which has been available since 2016, is #2 by volume of spam and malicious emails, accounting for 5% of all of those emails. It also represents, when we separate those two categories, 5% of all malicious emails, and 5% of all spam emails. As we’re going to see below, its influence is growing.
Full 2023 top 50 spam & malicious TLDs list
For a more detailed perspective, below we present the top 50 TLDs with the highest percentages of spam and malicious emails during 2023. We also include a breakdown of those two categories.
It’s noticeable that even outside the top 10, other recent generic TLDs are also higher in the ranking, such as “.autos” (the #1 in the spam list), “.today”, “.bid” or “.cam”. TLDs that seem to promise entertainment or fun or are just leisure or recreational related (including “.fun” itself), occupy a position in our top 50 ranking.
Change in spam & malicious TLD patterns
Let's look at TLDs where spam + malicious emails comprised the largest share of total messages from that TLD, and how that list of TLDs changed from the first half of 2023 to the second half. This shows which TLDs were most problematic at different times during the year.
Highlighted in bold in the following table are those TLDs that climbed in the rankings for the percentage of spam and malicious emails from July to December 2023, compared with January to June. Generic TLDs “.uno”, “.makeup” and “.directory” appeared in the top list and in higher positions for the first time in the last six months of the year.
From the rankings, it's clear that the recent generic TLDs have the highest spam and malicious percentage of all emails. The top 10 TLDs in both halves of 2023 are all recent and generic, with several introduced since 2021.
Reasons for the prominence of these gTLDs include the availability of domain names that can seem legitimate or mimic well-known brands, as we explain in this blog post. Cybercriminals often use popular or catchy words. Some gTLDs allow anonymous registration. Their low cost and the delay in updated security systems to recognize new gTLDs as spam and malicious sources also play a role — note that, as we’ve seen, cyber criminals also like to change TLDs and methods.
The impact of a lawsuit?
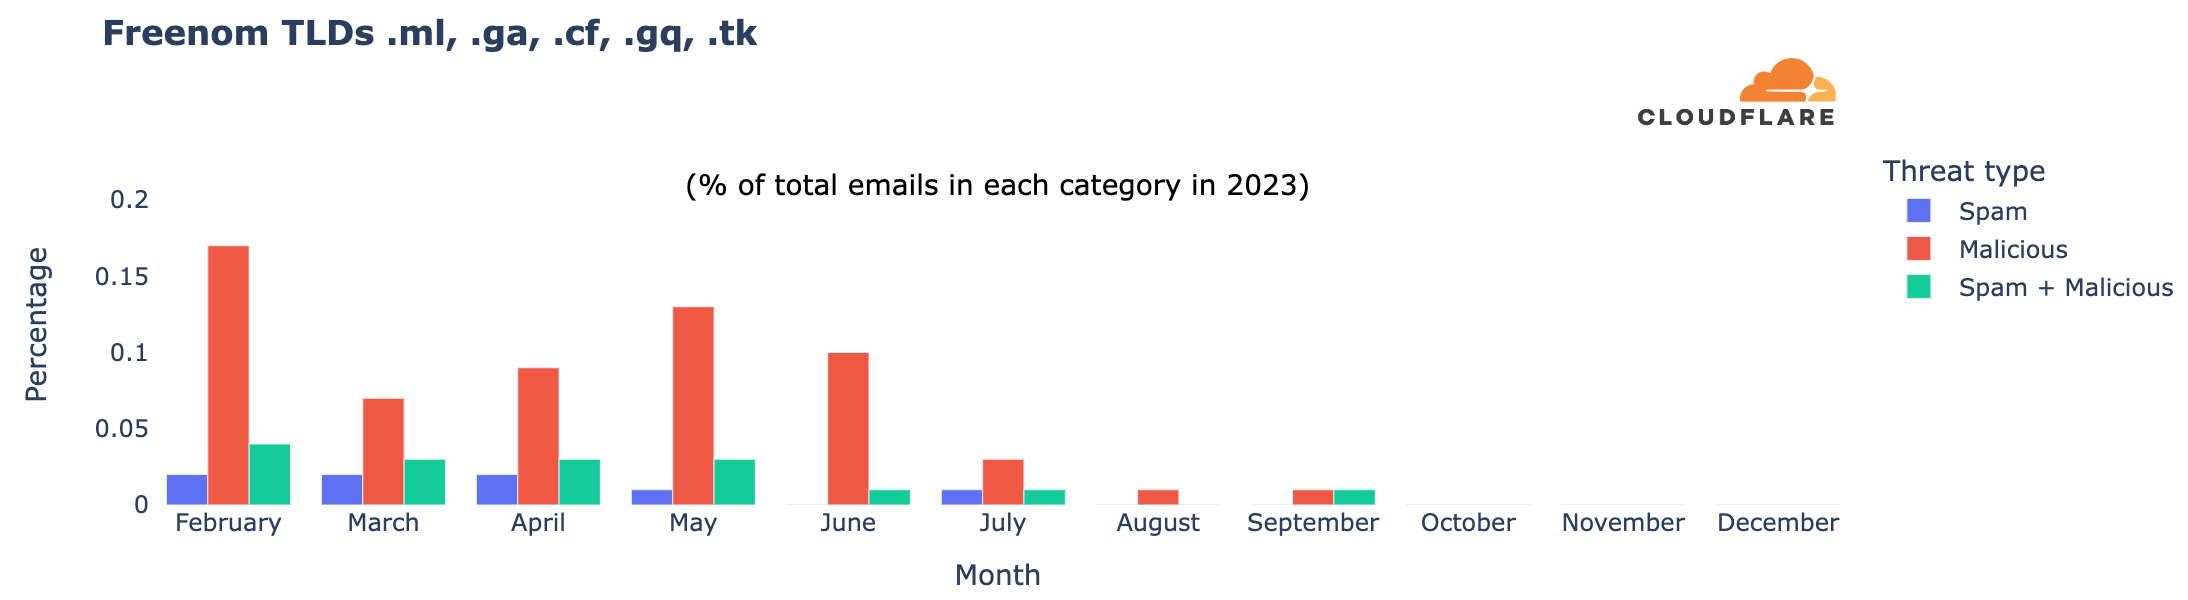
There's also been a change in the types of domains with the highest malicious percentage in 2023, possibly due to Meta's lawsuit against Freenom, filed in December 2022 and refiled in March 2023. Freenom provided domain name registry services for free in five ccTLDs, which wound up being used for purposes beyond local businesses or content: “.cf” (Central African Republic), “.ga” (Gabon), “.gq” (Equatorial Guinea), “.ml” (Mali), and “.tk” (Tokelau). However, Freenom stopped new registrations during 2023 following the lawsuit, and in February 2024, announced its decision to exit the domain name business.
Focusing on Freenom TLDs, which appeared in our top 50 ranking only in the first half of 2023, we see a clear shift. Since October, these TLDs have become less relevant in terms of all emails, including malicious and spam percentages. In February 2023, they accounted for 0.17% of all malicious emails we tracked, and 0.04% of all spam and malicious. Their presence has decreased since then, becoming almost non-existent in email volume in September and October, similar to other analyses.
TLDs ordered by volume of spam + malicious
In addition to looking at their share, another way to examine the data is to identify the TLDs that have a higher volume of spam and malicious emails — the next table is ordered that way. This means that we are able to show more familiar (and much older) TLDs, such as “.com”. We've included here the percentage of all emails in any given TLD that are classified as spam or malicious, and also spam + malicious to spotlight those that may require more caution. For instance, with high volume “.shop”, “.no”, “.click”, “.beauty”, “.top”, “.monster”, “.autos”, and “.today” stand out with a higher spam and malicious percentage (and also only malicious email percentage).
In the realm of country-code TLDs, Norway’s “.no” leads in spam, followed by China’s “.cn”, Russia’s “.ru”, Ukraine’s “.ua”, and Anguilla’s “.ai”, which recently has been used more for artificial intelligence-related domains than for the country itself.
In bold and red, we’ve highlighted the TLDs where spam + malicious represents more than 20% of all emails in that TLD — already what we consider a high number for domains with a lot of emails.
The curious case of “.gov” email spoofing
When we concentrate our research on message volume to identify TLDs with more malicious emails blocked by our Cloud Email Security service, we discover a trend related to “.gov”.
The first three domains, ".com" (63%), ".net" (5%), and ".shop" (5%), were previously seen in our rankings and are not surprising. However, in fourth place is ".org", known for being used by non-profit and other similar organizations, but it has an open registration policy. In fifth place is ".gov", used only by the US government and administered by CISA. Our investigation suggests that it appears in the ranking because of typical attacks where cybercriminals pretend to be a legitimate address (email spoofing, creation of email messages with a forged sender address). In this case, they use ".gov" when launching attacks.
The spoofing behavior linked to ".gov" is similar to that of other TLDs. It includes fake senders failing SPF validation and other DNS-based authentication methods, along with various other types of attacks. An email failing SPF, DKIM, and DMARC checks typically indicates that a malicious sender is using an unauthorized IP, domain, or both. So, there are more straightforward ways to block spoofed emails without examining their content for malicious elements.
Ranking TLDs by proportions of malicious and spam email in 2023
In this section, we have included two lists: one ranks TLDs by the highest percentage of malicious emails — those you should exercise greater caution with; the second ranks TLDs by just their spam percentage. These contrast with the previous top 50 list ordered by combined spam and malicious percentages. In the case of malicious emails, the top 3 with the highest percentage are all generic TLDs. The #1 was “.bar”, with 70% of all emails being categorized as malicious, followed by “.makeup”, and “.cyou” — marketed as the phrase "see you”.
The malicious list also includes some country-code TLDs (ccTLDs) not primarily used for country-related topics, like .ml (Mali), .om (Oman), and .pw (Palau). The list also includes other ccTLDs such as .ir (Iran) and .kg (Kyrgyzstan), .lk (Sri Lanka).
In the spam realm, it’s “autos”, with 93%, and other generic TLDs such as “.today”, and “.directory” that take the first three spots, also seeing shares over 90%.
How it stands in 2024: new higher-risk TLDs
2024 has seen new players enter the high-risk zone for unwanted emails. In this list we have only included the new TLDs that weren’t in the top 50 during 2023, and joined the list in January. New entrants include Samoa's “.ws”, Indonesia's “.id” (also used because of its “identification” meaning), and the Cocos Islands' “.cc”. These ccTLDs, often used for more than just country-related purposes, have shown high percentages of malicious emails, ranging from 20% (.cc) to 95% (.ws) of all emails.
Overview of email threat trends since 2023
With Cloudflare's Cloud Email Security, we gain insight into the broader email landscape over the past months. The spam percentage of all emails stood at 8.58% in 2023. As mentioned before, keep in mind with these percentages that our protection typically kicks in after other email providers’ filters have already removed some spam and malicious emails.
How about malicious emails? Almost 3% of all emails were flagged as malicious during 2023, with the highest percentages occurring in Q4. Here’s the “malicious” evolution, where we’re also including the January and February 2024 perspective:
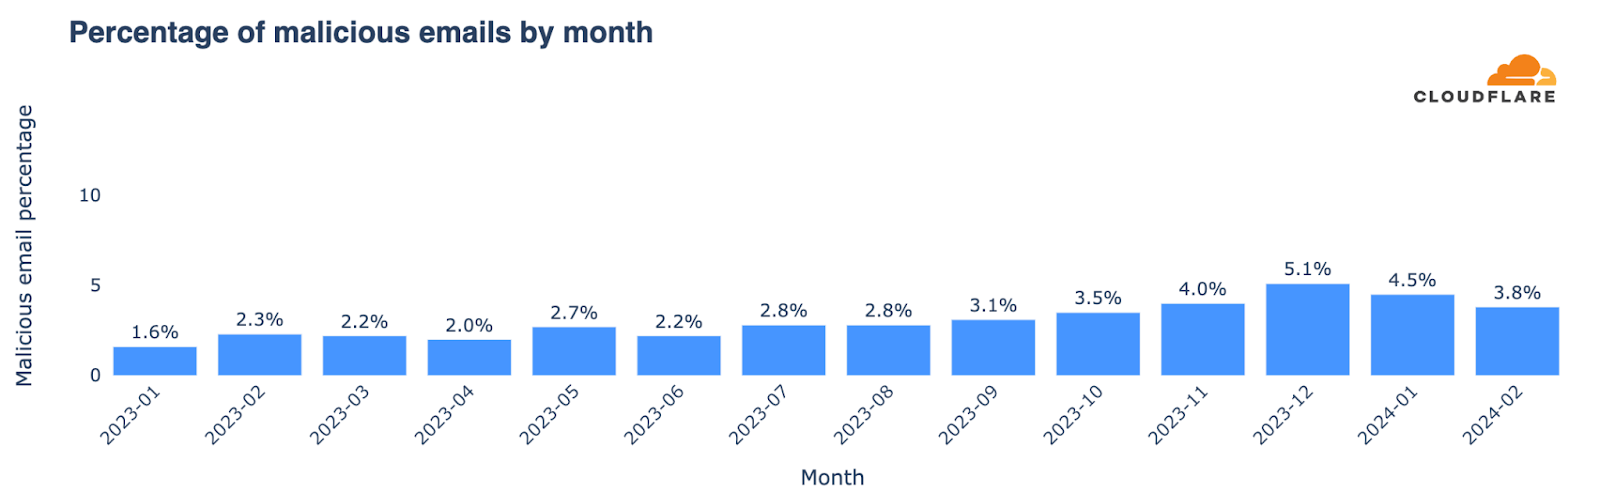
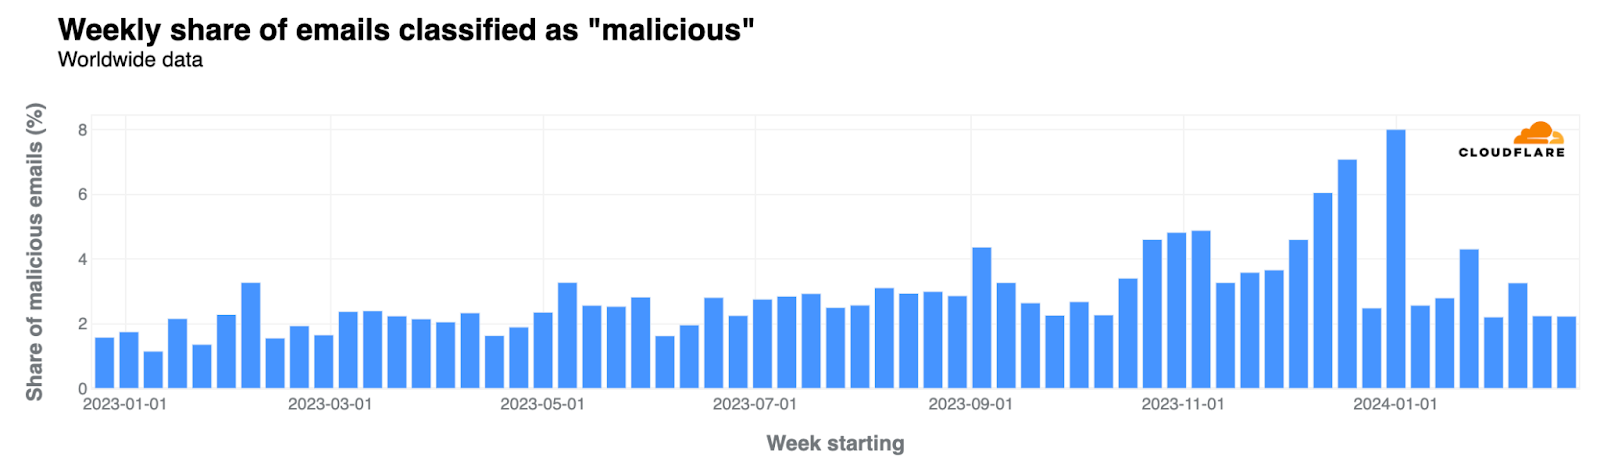
The week before Christmas and the first week of 2024 experienced a significant spike in malicious emails, reaching an average of 7% and 8% across the weeks, respectively. Not surprisingly, there was a noticeable decrease during Christmas week, when it dropped to 3%. Other significant increases in the percentage of malicious emails were observed the week before Valentine's Day, the first week of September (coinciding with returns to work and school in the Northern Hemisphere), and late October.
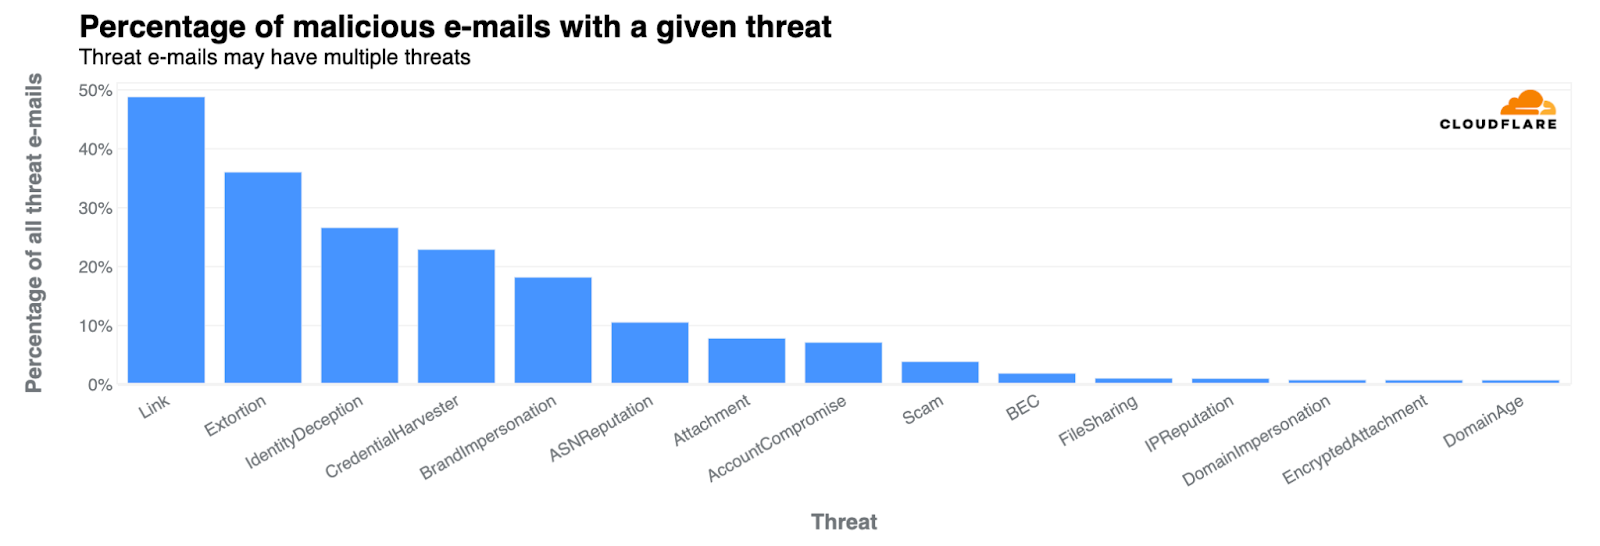
Threat categories in 2023
We can also look to different types of threats in 2023. Links were present in 49% of all threats. Other categories included extortion (36%), identity deception (27%), credential harvesting (23%), and brand impersonation (18%). These categories are defined and explored in detail in Cloudflare's 2023 phishing threats report. Extortion saw the most growth in Q4, especially in November and December reaching 38% from 7% of all threats in Q1 2023.
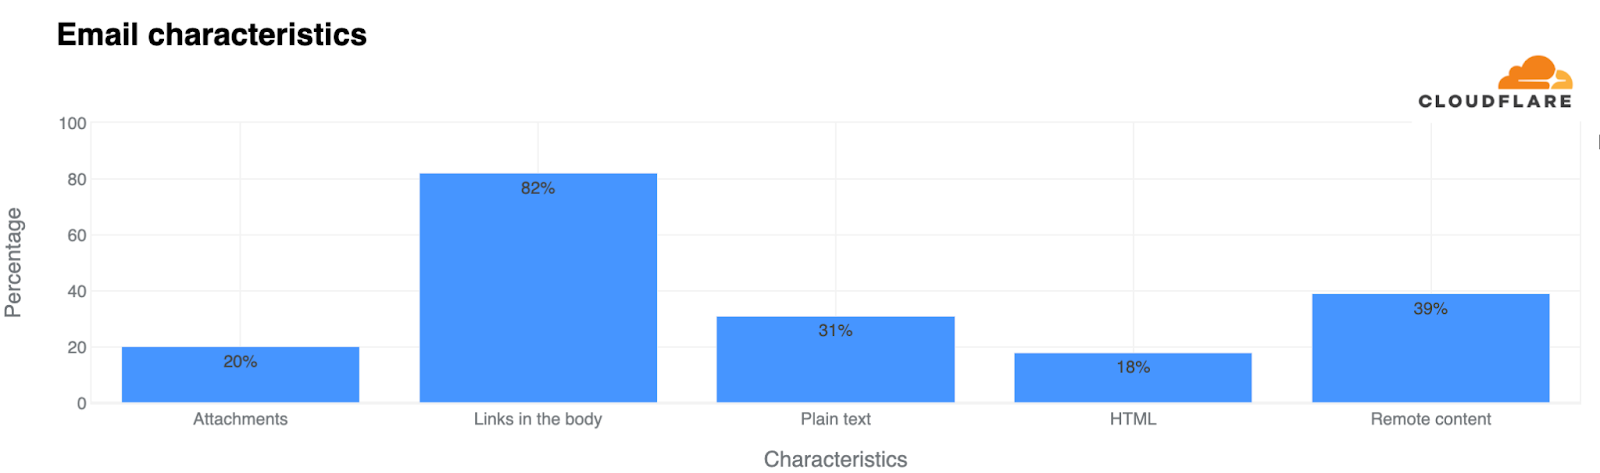
Other trends: Attachments are still popular
Other less “threatening” trends show that 20% of all emails included attachments (as the next chart shows), while 82% contained links in the body. Additionally, 31% were composed in plain text, and 18% featured HTML, which allows for enhanced formatting and visuals. 39% of all emails used remote content.
Conclusion: Be cautious, prepared, safe
The landscape of spam and malicious (or phishing) emails constantly evolves alongside technology, the Internet, user behaviors, use cases, and cybercriminals. As we’ve seen through Cloudflare’s Cloud Email Security insights, new generic TLDs have emerged as preferred channels for these malicious activities, highlighting the need for vigilance when dealing with emails from unfamiliar domains.
There's no shortage of advice on staying safe from phishing. Email remains a ubiquitous yet highly exploited tool in daily business operations. Cybercriminals often bait users into clicking malicious links within emails, a tactic used by both sophisticated criminal organizations and novice attackers. So, always exercise caution online.
Cloudflare's Cloud Email Security provides insights that underscore the importance of robust cybersecurity infrastructure in fighting the dynamic tactics of phishing attacks.
If you want to learn more about email security, you can check Cloudflare Radar’s new email section, visit our Learning Center or reach out for a complimentary phishing risk assessment for your organization.
(Contributors to this blog post include Jeremy Eckman, Phil Syme, and Oren Falkowitz.)