
This post is also available in 简体中文, 繁體中文, 日本語 and 한국어.

Cloudflare’s Bot Management is used by organizations around the world to proactively detect and mitigate automated bot traffic. To do this, Cloudflare leverages machine learning models that help predict whether a particular HTTP request is coming from a bot or not, and further distinguishes between benign and malicious bots. Cloudflare serves over 55 million HTTP requests per second — so our machine learning models need to run at Cloudflare scale.
We are constantly making improvements to the models that power Bot Management to ensure they are incorporating the latest threat intelligence. This process of iteration is an important part of ensuring our customers stay a step ahead of malicious actors, and it requires a rigorous process for experimentation, deployment, and ongoing observation.
We recently shared an introduction to Cloudflare’s approach to MLOps, which provides a holistic overview of model training and deployment processes at Cloudflare. In this post, we will dig deeper into monitoring, and how we continuously evaluate the models that power Bot Management.
Why monitoring matters
Before bot detection models are released, we undergo an extensive model testing/validation process to ensure our detections perform as expected. Model performance is validated across a wide number of web traffic segments, by browser, HTTP protocol, and other dimensions to get a fine-grained view into how we expect the model to perform once deployed. If everything checks out, the model is gradually released into production, and we get a level up in our bot detections.
After models are deployed to production, it can be challenging to get visibility into performance on a granular level. Sure, we can look at outcomes-based metrics — like bot score distributions, or challenge solve rates. These are informative, but with any change in bot scoring or challenge solve rates, we're still left asking, "Which segments of web traffic are most impacted by this change? Was that expected?".
To train a model for the Internet is to train a model against a moving target. Anyone can train a model on static data and achieve great results — so long as the input does not change. Building a model that generalizes into the future, with new threats, browsers, and bots is a more difficult task. Machine learning monitoring is an important part of the story because it provides confidence that our models continue to generalize, using a rigorous and repeatable process.
In the days before machine learning monitoring, the team would analyze web traffic patterns and model scoring results to track the proportion of web requests scored as bot or human. This high-level metric is helpful for evaluating performance of the model in the aggregate, but didn’t provide granular detail into how the model was behaving with particular types of traffic. For a deeper analysis, we’d be left with the additional work of investigating performance on individual traffic segments like traffic from Chrome browser or clients using iOS.
With machine learning monitoring, we get insights into how the model behaves not just at a high level, but in a much more granular way — without having to do a lot of manual investigation. The monitoring closes the feedback loop by answering the critical question: "How are our bot detection models performing in production?" Monitoring gives us the same level of confidence derived from pre-deployment model validation/testing, except applied to all models in production.
The use cases for which monitoring has proven invaluable include:
- Investigating bot score anomalies: If a customer reports machine learning scoring false positives/negatives, and we suspect broader issues across a subset of detections, monitoring can help zero-in on the answer. Engineers can find insights from our global monitoring dashboard, or focus on performance for a specific dataset.
- Monitoring any model predictions or request field: The monitoring service is flexible and can add an observability layer over any request artifact stored in our web requests databases. If model predictions or outcomes of interest are stored with our request logs, then they can be monitored. We can work across engineering teams to enable monitoring for any outcome.
- Deploying new models: We gradually deploy new model versions, eventually ramping up to running across Cloudflare’s global web traffic. Along the way, we have a series of checks before a new model can be deployed to the next release step. Monitoring allows us to compare the latest model with the previous version against granular traffic segments at each deployment stage — giving us confidence when proceeding forward with the rollout.
How does machine learning monitoring work?
The process begins with a ground-truth dataset — a set of traffic data known to be either human or bot-generated, labeled accordingly and accurately. If our model identifies a particular request as bot traffic, when our ground-truth label indicates it originated from a human, then we know the model has miscategorized the request, and vice versa. This kind of labeled data, where we flag traffic as being from a bot or a human, is what our model is trained on to learn to make detections in the first place.
Datasets gathered at training time allow us to evaluate the performance of a trained model for that snapshot in time. Since we want to continuously evaluate model performance in production, we need to likewise get real-time labeled data to compare against our bot score. We can generate a labeled dataset for this purpose when we’re certain that web requests come from a certain actor. For example, our heuristics engine is one source of high-confidence labeled data. Other sources of reliable, labeled data include customer feedback and attack pattern research.
We can directly compare our model’s bot scores on web requests against recently-labeled datasets to judge model performance. To ensure that we are making an apples-to-apples comparison as we evaluate the model’s score over time, consistency is paramount: the data itself will be different, but we want the methodology, conditions, and filters to remain the same between sampling windows. We have automated this process, allowing us to generate labeled datasets in real-time that give us an up-to-the-minute view of model performance.
Getting granular performance metrics
Let's say we detect a sudden drop in accuracy on a given dataset labeled as bot traffic, meaning our detection is incorrectly scoring bots as human traffic. We would be keen to determine the exact subset of traffic responsible for the scoring miss. Is it coming from the latest Chrome browser or maybe a certain ASN?
To answer this, performance monitoring uses specializations, which are filters applied against our dataset that focus on a dimension of interest (e.g. browser type, ASN). With specializations on datasets, we get both an expectation on how traffic should have been scored, and insight into the exact dimension causing the miss.
Integrating monitoring into our bots machine learning platform
The monitoring system runs on a unified platform called Endeavor, which we built to handle all aspects of bots-related machine learning, including model training and validation, model interpretability, and delivering the most up-to-date information to our servers running bot detection. We can break down monitoring into a few tasks: rendering monitoring queries to fetch datasets, computing performance metrics, and storing metrics. Endeavour uses Airflow, a workflow execution engine, making it a great place to run our monitoring tasks on top of a kubernetes cluster and GPUs, with access to Postgres and ClickHouse databases.
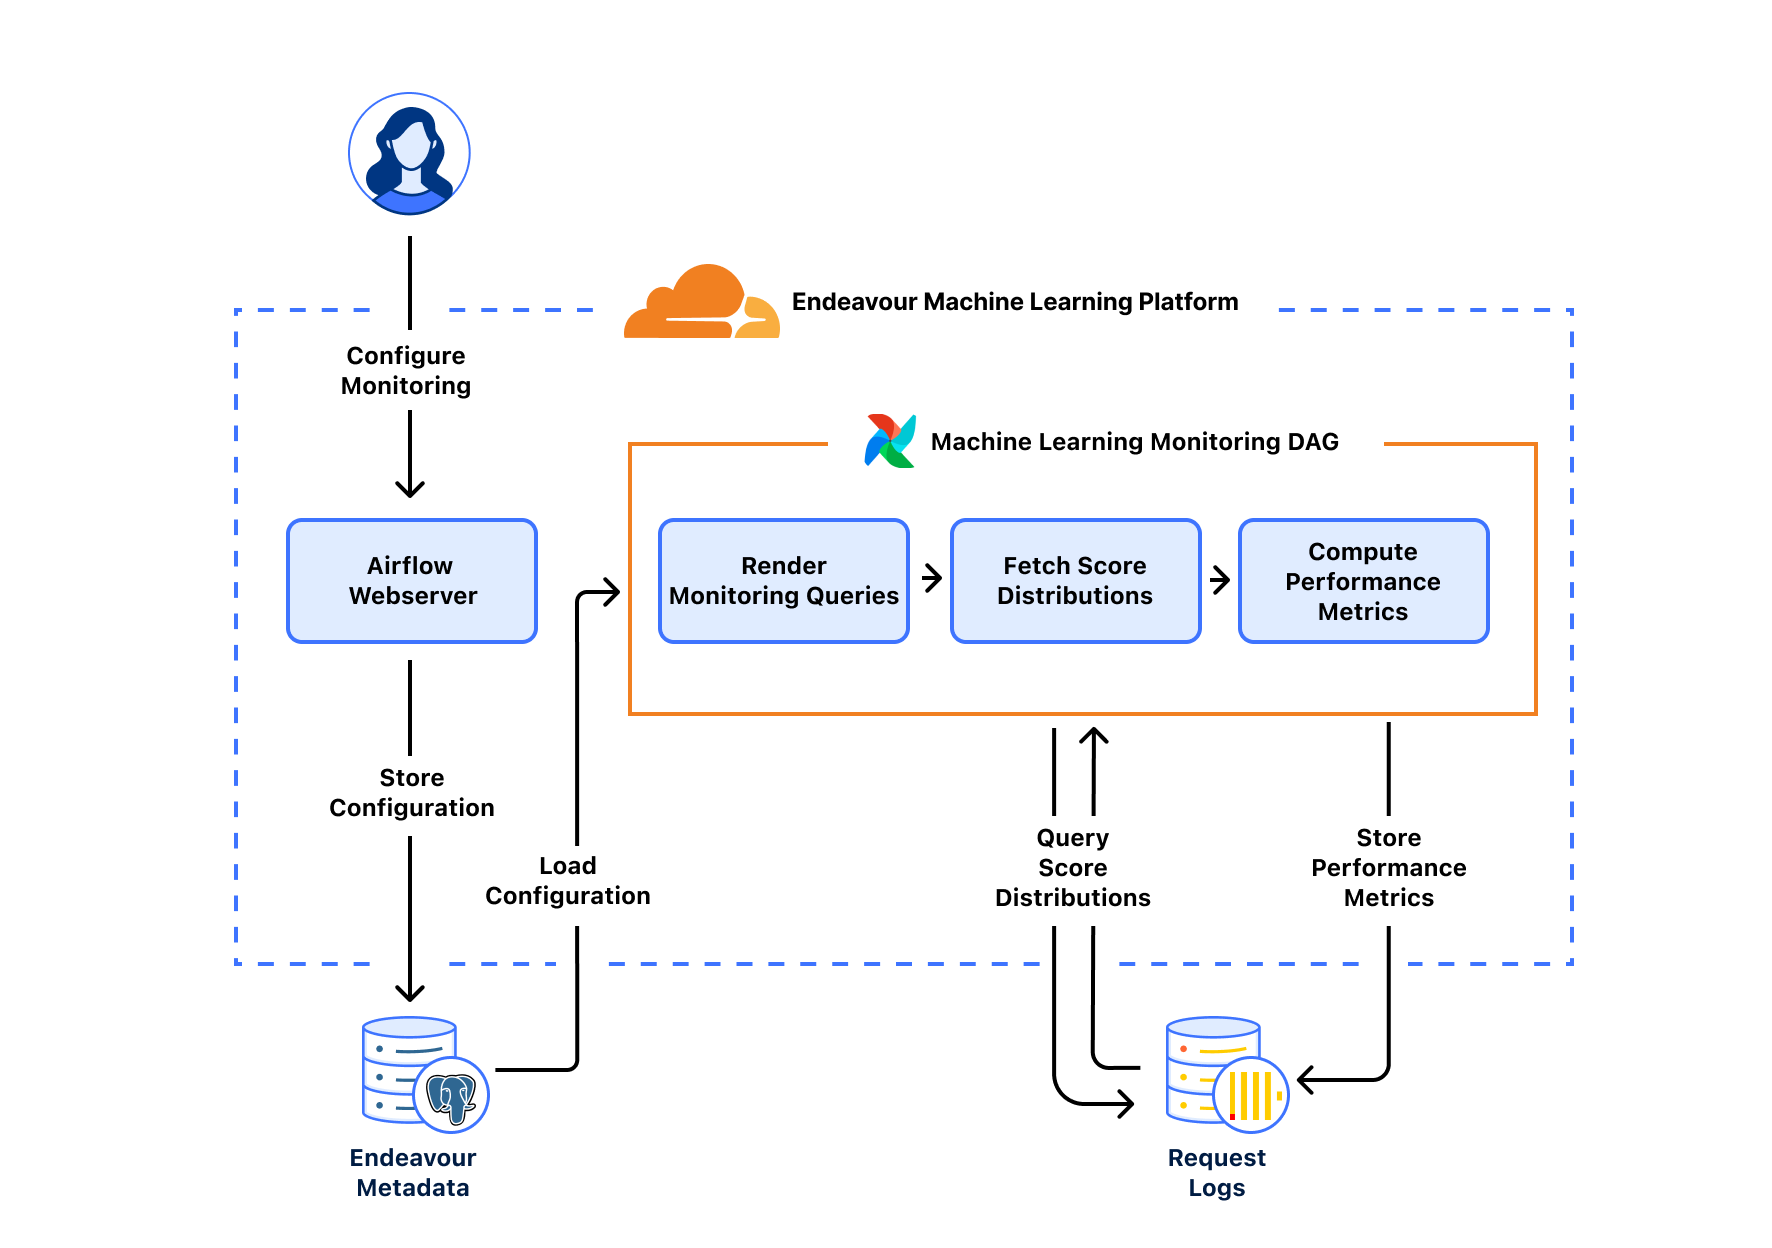
Rendering monitoring queries
A monitoring query is simply a SQL query to our ClickHouse web request database asking "How does machine learning scoring look right now?". The query gets more precise when we add in dataset and specialization conditions so that we can ask a more refined question "For this set of known (non-)automated traffic, how does machine learning scoring look along these dimensions of interest?".
In our system, datasets for training and validation are determined using SQL queries, which are tailored to capture segments of request traffic, such as traffic flagged as bots by our heuristics engine. For model monitoring, we adapt these queries to measure performance metrics like accuracy and continuously update the time range to measure the latest model performance. For each dataset used in training and validation, we can generate a monitoring query that produces real-time insight into model performance.
Computing performance metrics
With a rendered monitoring query ready, we can go ahead and fetch bot score distributions from our web request database. The MetricsComputer takes in the bot score distributions as input and produces relevant performance metrics, like accuracy, over a configurable time interval.
We can evaluate model performance along any metric of interest. The MetricInterface is a Python interface that acts as a blueprint for performance metrics. Any newly added metric would only need to implement the interface's compute_metric method, which defines how the MetricsComputer should perform the calculation.
Storing metrics
After each monitoring run, we store performance metrics by dataset, model version, and specialization value in the ml_performance ClickHouse table. Precomputing metrics enables long data retention periods, so we can review model performance by model versions or dimensions of interest over time. Importantly, newly added performance metrics can be backfilled as needed since the ml_performance table also stores the score distributions used to compute each metric.
Running tasks on GPUs
Metrics computation is load balanced across endeavour-worker instances running across GPUs. From a system perspective, the airflow-scheduler adds a monitoring task to a Redis Queue and Airflow Celery workers running on each GPU will pull tasks off the queue for processing. We benefit from having a production service constantly powered by GPUs, as opposed to only running ad hoc model training workloads. As a result, the monitoring service acts as a health-check that ensures various Endeavour components are functioning properly on GPUs. This helps ensure the GPUs are always updated and ready to run model training/validation tasks.
Machine learning monitoring in action
To better illustrate how Cloudflare uses machine learning monitoring, let’s explore some recent examples.
Improving accuracy of machine learning bot detection
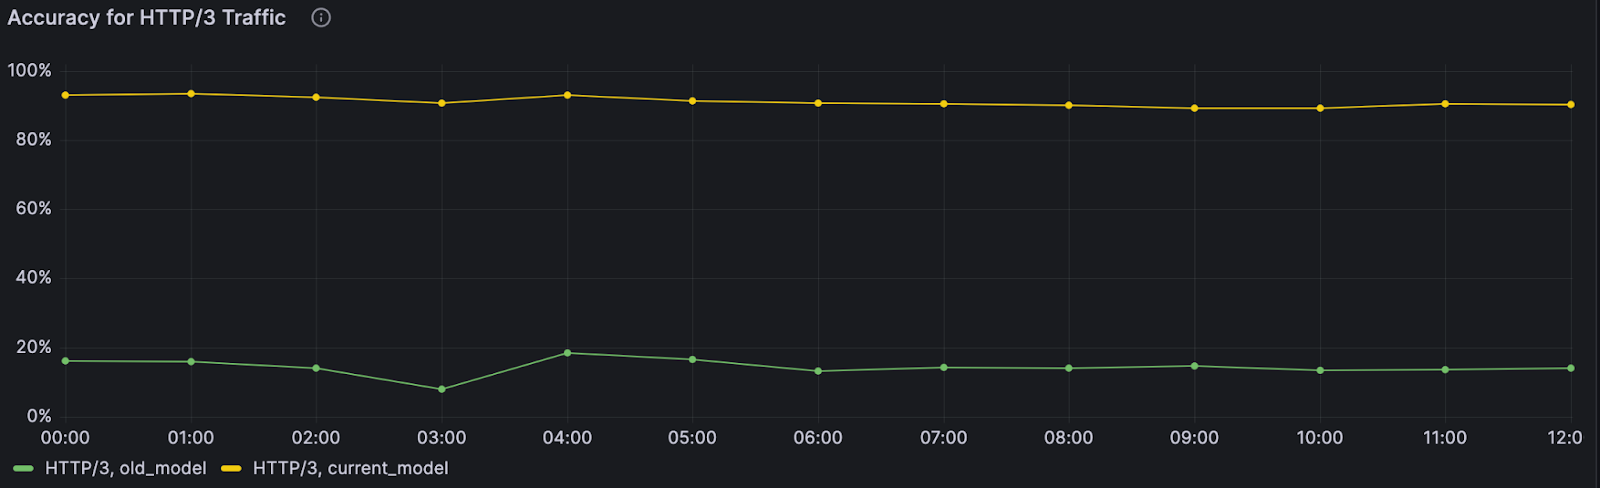
When the monitoring system was first deployed, we quickly found an anomaly: our model wasn’t performing well on web traffic using HTTP/3. At the time, HTTP/3 usage was hardly seen across the web, and the primary model in production wasn’t trained on HTTP/3 traffic, leading to inaccurate bot scores. Fortunately, another bot detection layer, our heuristics engine, was still accurately finding bots using HTTP/3 — so our customers were still covered.
Still, this finding pointed to a key area of improvement for the next model iteration. And we did improve: the next model iteration was consistently able to distinguish between bot and human initiated HTTP/3 web requests with over 3.5x higher accuracy compared to the prior model version. As we enable more datasets and specializations, we can uncover specific browsers, OSs and other dimensions where performance can be improved during model training.
Early detection, quick intervention
Deploying machine learning at a global scale, running in data centers spread over 100 countries around the world, is challenging. Things don’t always go to plan.
A couple of years ago, we deployed an update to our machine learning powered bot detections, and it led to an increase in false positive bot detections — we were incorrectly flagging some legitimate traffic as bot traffic. Our monitoring system quickly showed a drop in performance on residential ASNs where we expect mostly non-automated traffic.
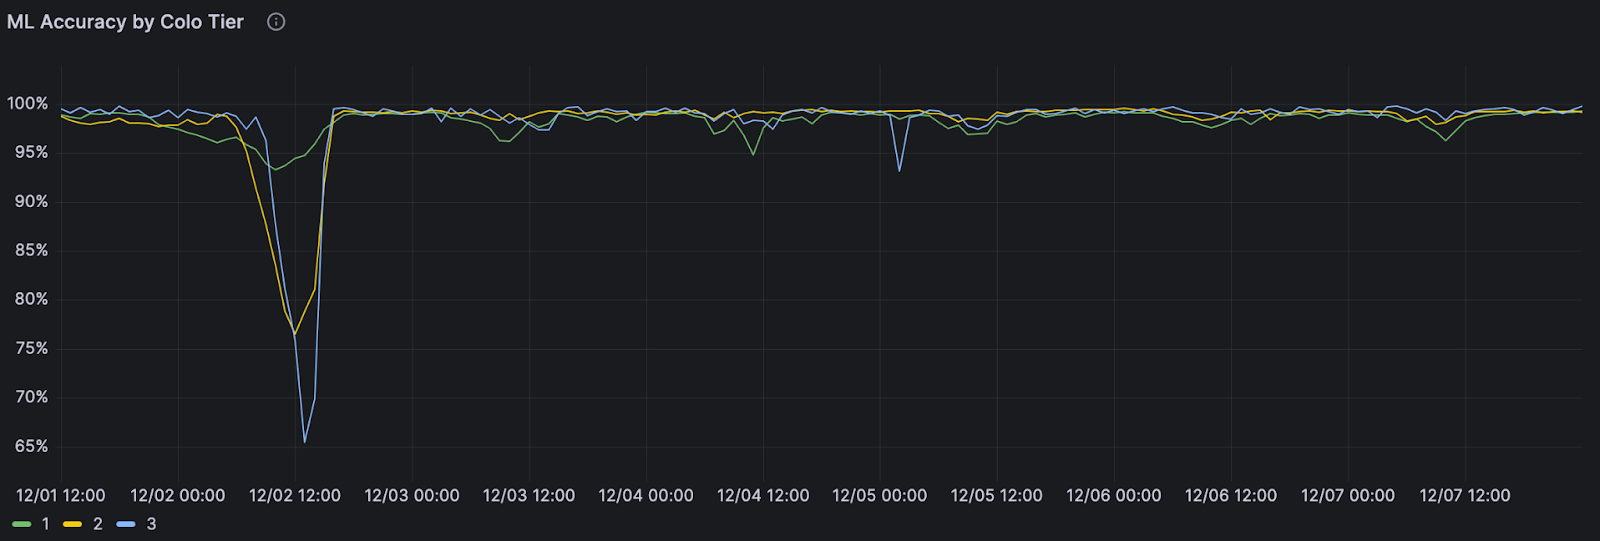
At the same time, a software release was being deployed to our global network, but we didn’t know if it was the cause of the performance drop. We do staged deployments, updating the software in one batch of datacenters at a time before reaching global traffic. Our monitoring dashboards showed a drop in performance that followed this exact deployment pattern, and the release was starting to reach our biggest datacenters.
Monitoring dashboards clearly showed the pattern followed a software update. We reverted the change before the update made it to most of our datacenters and restored normal machine learning bot detection performance. Monitoring allows us to catch performance anomalies, dig into the root cause, and take action — fast.
Model deployment monitoring for all
We’ve seen a lot of value in being able to monitor and control our models and deployments, and realized that other people must be running into the same challenges as well. Over the next few months, we'll be building out more advanced features for AI Gateway – our proxy that helps people observe and control their AI applications and models better. With AI Gateway, we can do all the same deployments, monitoring, and optimization strategies we have been doing for our Bot detection models in one unified control plane. We're excited to use these new features internally, but even more excited to release these features to the public, so that anyone is able to deploy, test, monitor and improve the way they use AI or machine learning models.
Next up
Today, machine learning monitoring helps us investigate performance issues and monitor performance as we roll out new models — and we're just getting started!
This year, we're accelerating our machine learning model iterations for bot detection to deliver improved detections faster than ever. Monitoring will be key for enabling fast and safe deployments. We’re excited to add alerting based on model performance - so that we’re automatically notified should model performance ever drift outside our expected bounds.
Alongside our Workers AI launch, we recently deployed GPUs in 100+ cities, leveling up our compute resources at a global scale. This new infrastructure will unlock our model iteration process, allowing us to explore new, cutting-edge models with even more powerful bot detection capabilities. Running models on our GPUs will bring inference closer to users for better model performance and latency, and we’re excited to leverage our new GPU compute with our bot detection models as well.