
This may sound like a weird title, but hear me out. You’d think keepalives would always be helpful, but turns out reality isn’t always what you expect it to be. It really helps if you read Why does one NGINX worker take all the load? first. This post is an adaptation of a rather old post on Cloudflare’s internal blog, so not all details are exactly as they are in production today but the lessons are still valid.
This is a story about how we were seeing some complaints about sporadic latency spikes, made some unconventional changes, and were able to slash the 99.9th latency percentile by 4x!
Request flow on Cloudflare edge
I'm going to focus only on two parts of our edge stack: FL and SSL.
- FL accepts plain HTTP connections and does the main request logic, including our WAF
- SSL terminates SSL and passes connections to FL over local Unix socket:
Here’s a diagram:
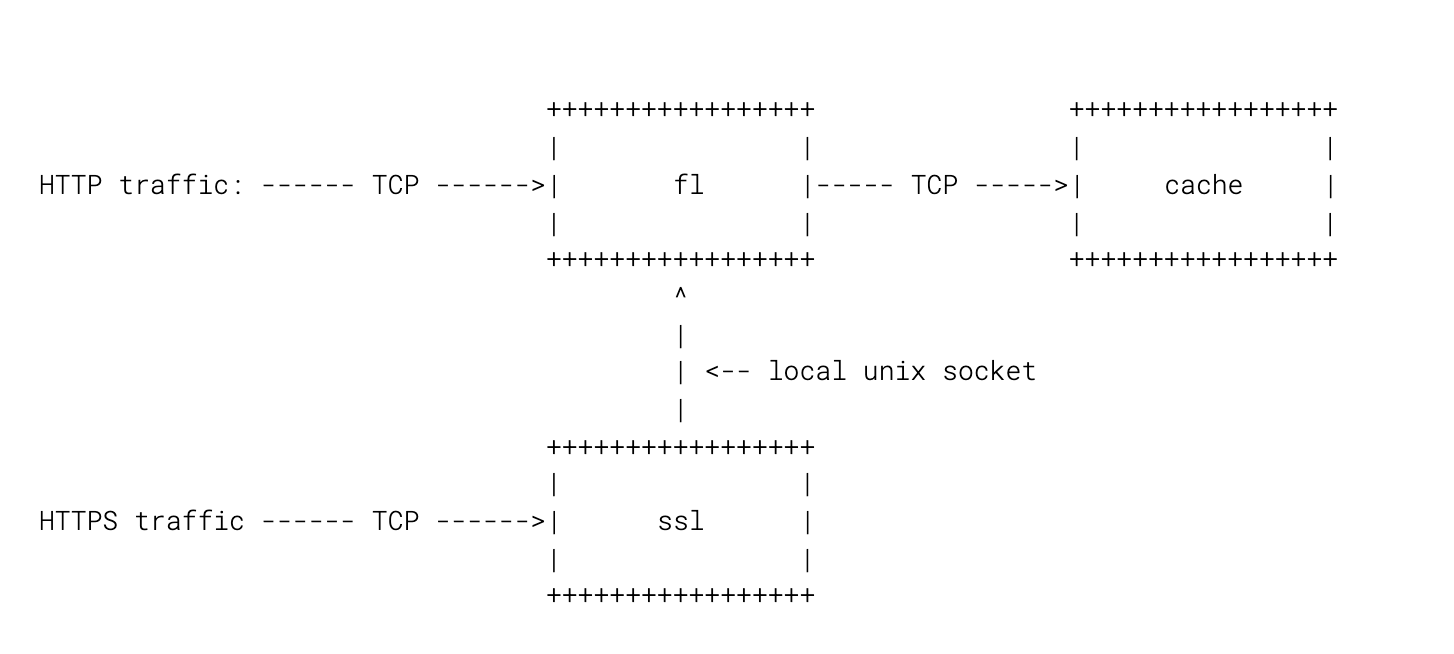
These days we route all traffic through SSL for simplicity, but in the grand scheme of things it’s not going to matter much.
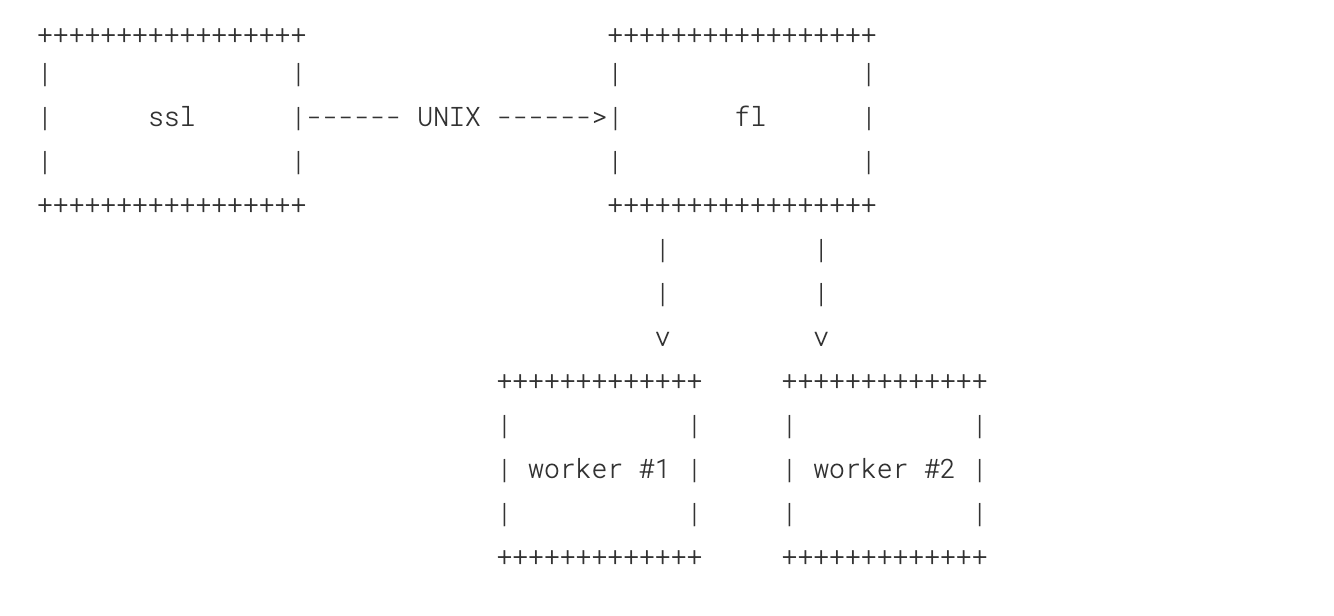
Each of these processes is not itself a single process, but rather a main process and a collection of workers that do actual processing. Another diagram for you to make this more visual:
Keepalives
Requests come over connections that are reused for performance reasons, which is sometimes referred to as “keepalive”. It's generally expensive for a client to open a new TCP connection and our servers keep some memory pools associated with connections that need to be recycled. In fact, one of the range of mitigations we use for attack traffic is disabling keepalives for abusive clients, forcing them to reopen connections, which slows them down considerably.
To illustrate the usefulness of keepalives, here's me requesting http://example.com/ from curl over the same connection:
$ curl -s -w "Time to connect: %{time_connect} Time to first byte: %{time_starttransfer}\n" -o /dev/null http://example.com/ -o /dev/null http://example.com/

Time to connect: 0.012108 Time to first byte: 0.018724
Time to connect: 0.000019 Time to first byte: 0.007391
The first request took 18.7ms and out of them 12.1ms were used to establish a new connection, which is not even a TLS one. When I sent another request over the same connection, I didn't need to pay extra and it took just 7.3ms to service my request. That's a big win, which gets even bigger if you need to establish a brand new connection (especially if it’s not TLSv1.3 or QUIC). DNS was also cached in the example above, but it may be another negative factor for domains with low TTL.
Keepalives tend to be used extensively, because they seem beneficial. Generally keepalives are enabled by default for this exact reason.
Taking all the load
Due to how Linux works (see the first link in this blog post), most of the load goes to a few workers out of the pool. When that worker is not able to accept() a pending connection because it's busy processing requests, that connection spills to another worker. The process cascades until some worker is ready to pick up.
This leaves us with a ladder of load spread between workers:
               CPU%                                       Runtime
nobody    4254 51.2  0.8 5655600 1093848 ?     R    Aug23 3938:34 nginx: worker process
nobody    4257 47.9  0.8 5615848 1071612 ?     S    Aug23 3682:05 nginx: worker process
nobody    4253 43.8  0.8 5594124 1069424 ?     R    Aug23 3368:27 nginx: worker process
nobody    4255 39.4  0.8 5573888 1070272 ?     S    Aug23 3030:01 nginx: worker process
nobody    4256 36.2  0.7 5556700 1052560 ?     R    Aug23 2784:23 nginx: worker process
nobody    4251 33.1  0.8 5563276 1063700 ?     S    Aug23 2545:07 nginx: worker process
nobody    4252 29.2  0.8 5561232 1058748 ?     S    Aug23 2245:59 nginx: worker process
nobody    4248 26.7  0.8 5554652 1057288 ?     S    Aug23 2056:19 nginx: worker process
nobody    4249 24.5  0.7 5537276 1043568 ?     S    Aug23 1883:18 nginx: worker process
nobody    4245 22.5  0.7 5552340 1048592 ?     S    Aug23 1736:37 nginx: worker process
nobody    4250 20.7  0.7 5533728 1038676 ?     R    Aug23 1598:16 nginx: worker process
nobody    4247 19.6  0.7 5547548 1044480 ?     S    Aug23 1507:27 nginx: worker process
nobody    4246 18.4  0.7 5538104 1043452 ?     S    Aug23 1421:23 nginx: worker process
nobody    4244 17.5  0.7 5530480 1035264 ?     S    Aug23 1345:39 nginx: worker process
nobody    4243 16.6  0.7 5529232 1024268 ?     S    Aug23 1281:55 nginx: worker process
nobody    4242 16.6  0.7 5537956 1038408 ?     R    Aug23 1278:40 nginx: worker process
The third column is instant CPU%, the time after the date is total on-CPU time. If you look at the the same processes and count their open sockets, you'll see this (using the same order of processes as above):
4254 2357
4257 1833
4253 2180
4255 1609
4256 1565
4251 1519
4252 1175
4248 1065
4249 1056
4245 1201
4250 886
4247 908
4246 968
4244 1180
4243 867
4242 884
More load corresponds to more open sockets. More open sockets generate more load to serve these connections. It’s a vicious circle.
The twist
Now that we have all these workers holding onto this connections, requests over these connections are also in a way pinned to workers:
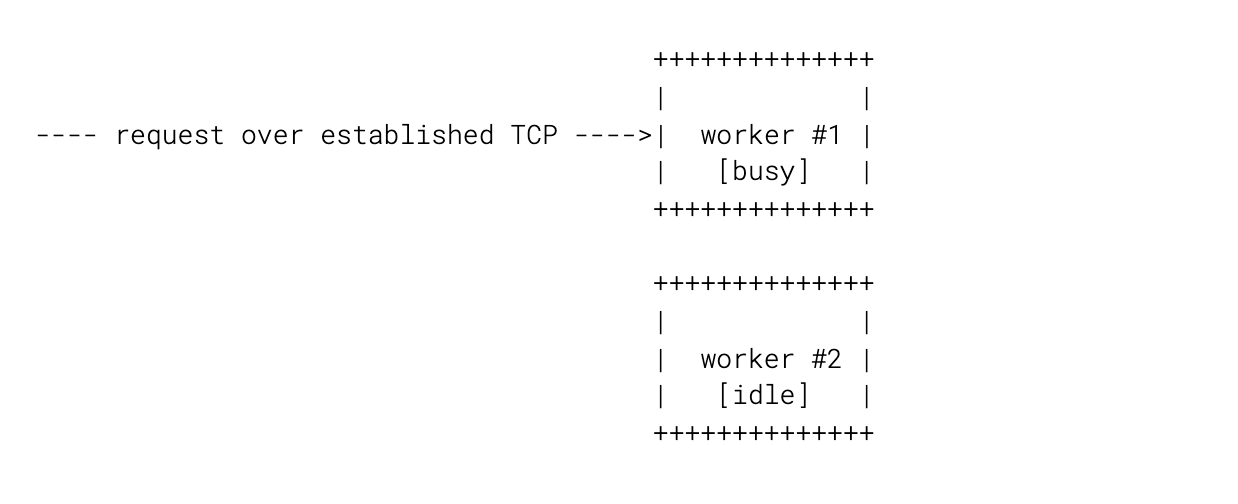
In FL we're doing some things that are somewhat compute intensive, which means that some workers can be busy for a somewhat prolonged period of time, while other workers will be sitting idle, increasing latency for requests. Ideally we want to always hand over a request to a worker that's idle, because that maximizes our chances of not being blocked, even if it takes a few event loop iterations to serve a request (meaning that we may still block down the road).
One part of dealing with the issue is offloading some of the compute intensive parts of the request processing into a thread pool, but that was something that hadn’t happened at that point. We had to do something else in the meantime.
Clients have no way of knowing that their worker is busy and they should probably ask another worker to serve the connection. For clients over a real network this doesn't even make sense, since by the time their request comes to NGINX up to tens of milliseconds later, the situation will probably be different.
But our clients are not over a long haul network! They are local and they are SSL connecting over a Unix socket. It's not exactly that expensive to reopen a new connection for each request and what it gives is the ability to pass a fully formed request that's buffered in SSL into FL:
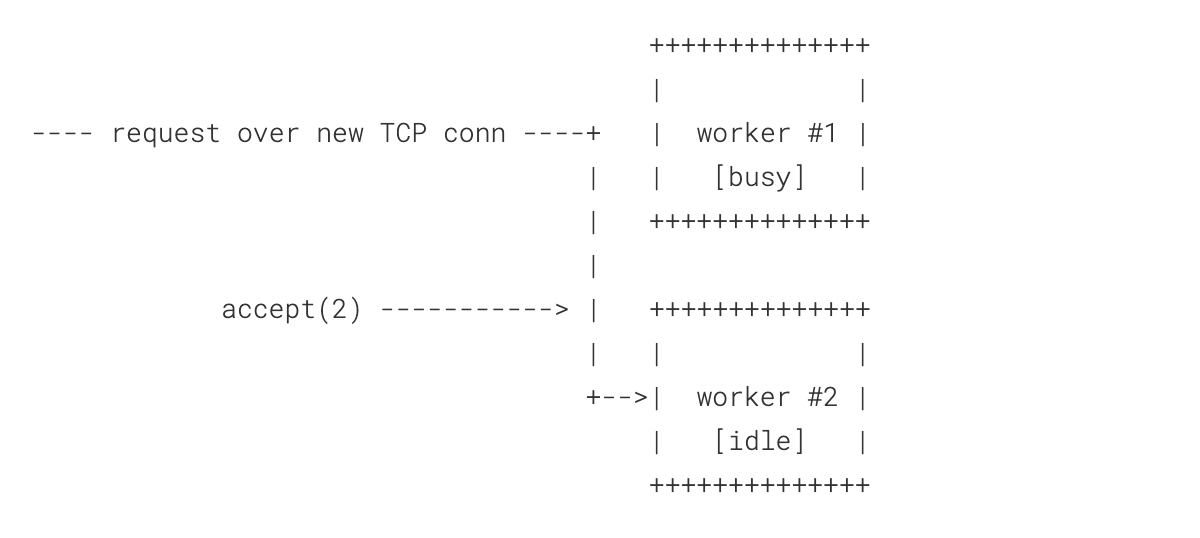
Two key points here:
- The request is always picked up by an idle worker
- The request is readily available for potentially compute intensive processing
The former is the most important part.
Validating the hypothesis
To validate this assumption, I wrote the following program:
package main

import (
    "flag"
    "io/ioutil"
    "log"
    "net/http"
    "os"
    "time"
)

func main() {
    u := flag.String("url", "", "url to request")
    p := flag.Duration("pause", 0, "pause between requests")
    t := flag.Duration("threshold", 0, "threshold for reporting")
    c := flag.Int("count", 10000, "number of requests to send")
    n := flag.Int("close", 1, "close connection after every that many requests")

    flag.Parse()

    if *u == "" {
        flag.PrintDefaults()
        os.Exit(1)
    }

    client := http.Client{}

    for i := 0; i < *c; i++ {
        started := time.Now()

        request, err := http.NewRequest("GET", *u, nil)
        if err != nil {
            log.Fatalf("Error constructing request: %s", err)
        }

        if i%*n == 0 {
            request.Header.Set("Connection", "Close")
        }

        response, err := client.Do(request)
        if err != nil {
            log.Fatalf("Error performing request: %s", err)
        }

        _, err = ioutil.ReadAll(response.Body)
        if err != nil {
            log.Fatalf("Error reading request body: %s", err)
        }

        response.Body.Close()

        elapsed := time.Since(started)
        if elapsed > *t {
            log.Printf("Request %d took %dms", i, int(elapsed.Seconds()*1000))
        }

        time.Sleep(*p)
    }
}
The program connects to a requested URL and recycles the connection after X requests have completed. We also pause for a short time between requests.
If we close a connection after every request:
$ go run /tmp/main.go -url http://test.domain/cdn-cgi/trace -count 10000 -pause 5ms -threshold 20ms -close 1
2018/08/24 23:42:34 Request 453 took 32ms
2018/08/24 23:42:38 Request 1044 took 24ms
2018/08/24 23:43:00 Request 4106 took 83ms
2018/08/24 23:43:12 Request 5778 took 27ms
2018/08/24 23:43:16 Request 6292 took 27ms
2018/08/24 23:43:20 Request 6856 took 21ms
2018/08/24 23:43:32 Request 8578 took 45ms
2018/08/24 23:43:42 Request 9938 took 22ms
We request an endpoint that's served in FL by Lua, so seeing any slow requests is unfortunate. There's an element of luck in this game and our program sees no cooperation from eyeballs or SSL, so it's somewhat expected.
Now, if we start closing the connection only after every other request, the situation immediately gets a lot worse:
$ go run /tmp/main.go -url http://teste1.cfperf.net/cdn-cgi/trace -count 10000 -pause 5ms -threshold 20ms -close 2
2018/08/24 23:43:51 Request 162 took 22ms
2018/08/24 23:43:51 Request 220 took 21ms
2018/08/24 23:43:53 Request 452 took 23ms
2018/08/24 23:43:54 Request 540 took 41ms
2018/08/24 23:43:54 Request 614 took 23ms
2018/08/24 23:43:56 Request 900 took 40ms
2018/08/24 23:44:02 Request 1705 took 21ms
2018/08/24 23:44:03 Request 1850 took 27ms
2018/08/24 23:44:03 Request 1878 took 36ms
2018/08/24 23:44:08 Request 2470 took 21ms
2018/08/24 23:44:11 Request 2926 took 22ms
2018/08/24 23:44:14 Request 3350 took 37ms
2018/08/24 23:44:14 Request 3404 took 21ms
2018/08/24 23:44:16 Request 3598 took 32ms
2018/08/24 23:44:16 Request 3606 took 22ms
2018/08/24 23:44:19 Request 4026 took 33ms
2018/08/24 23:44:20 Request 4250 took 74ms
2018/08/24 23:44:22 Request 4483 took 20ms
2018/08/24 23:44:23 Request 4572 took 21ms
2018/08/24 23:44:23 Request 4644 took 23ms
2018/08/24 23:44:24 Request 4758 took 63ms
2018/08/24 23:44:25 Request 4808 took 39ms
2018/08/24 23:44:30 Request 5496 took 28ms
2018/08/24 23:44:31 Request 5736 took 88ms
2018/08/24 23:44:32 Request 5845 took 43ms
2018/08/24 23:44:33 Request 5988 took 52ms
2018/08/24 23:44:34 Request 6042 took 26ms
2018/08/24 23:44:34 Request 6049 took 23ms
2018/08/24 23:44:40 Request 6872 took 86ms
2018/08/24 23:44:40 Request 6940 took 23ms
2018/08/24 23:44:40 Request 6964 took 23ms
2018/08/24 23:44:44 Request 7532 took 32ms
2018/08/24 23:44:49 Request 8224 took 22ms
2018/08/24 23:44:49 Request 8234 took 29ms
2018/08/24 23:44:51 Request 8536 took 24ms
2018/08/24 23:44:55 Request 9028 took 22ms
2018/08/24 23:44:55 Request 9050 took 23ms
2018/08/24 23:44:55 Request 9092 took 26ms
2018/08/24 23:44:57 Request 9330 took 25ms
2018/08/24 23:45:01 Request 9962 took 48ms
If we close after every 5 requests, the number of slow responses almost doubles. This is counter-intuitive, keepalives are supposed to help with latency, not make it worse!
Trying this in the wild
To see how this works out in the real world, we disabled keepalives between SSL and FL in one location, forcing SSL to send every request over a separate connection (remember: cheap local Unix socket). Here’s how our probes toward that location reacted to this:
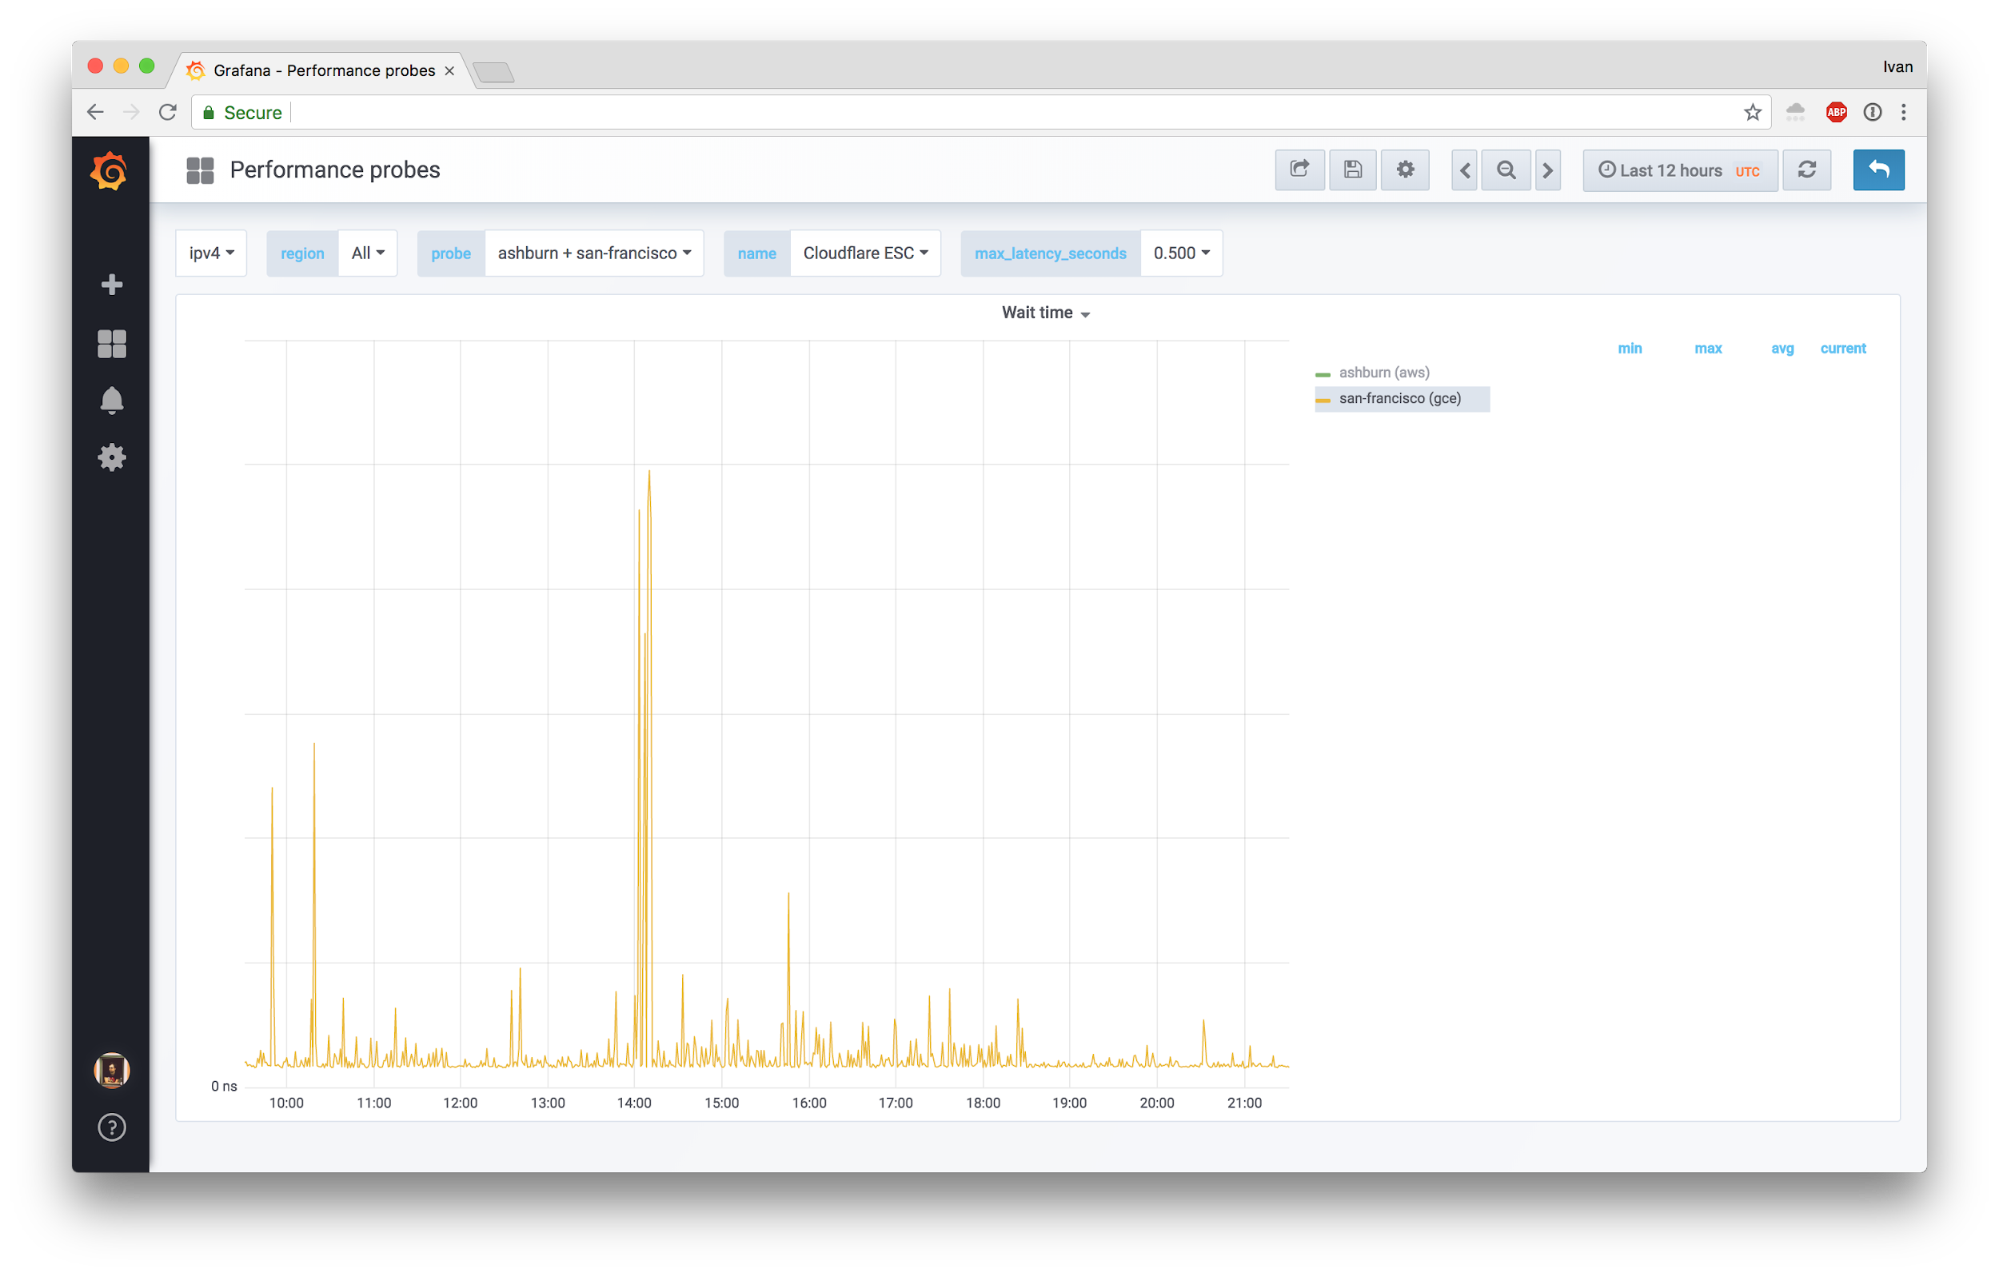
Here’s cumulative wait time between SSL and FL:
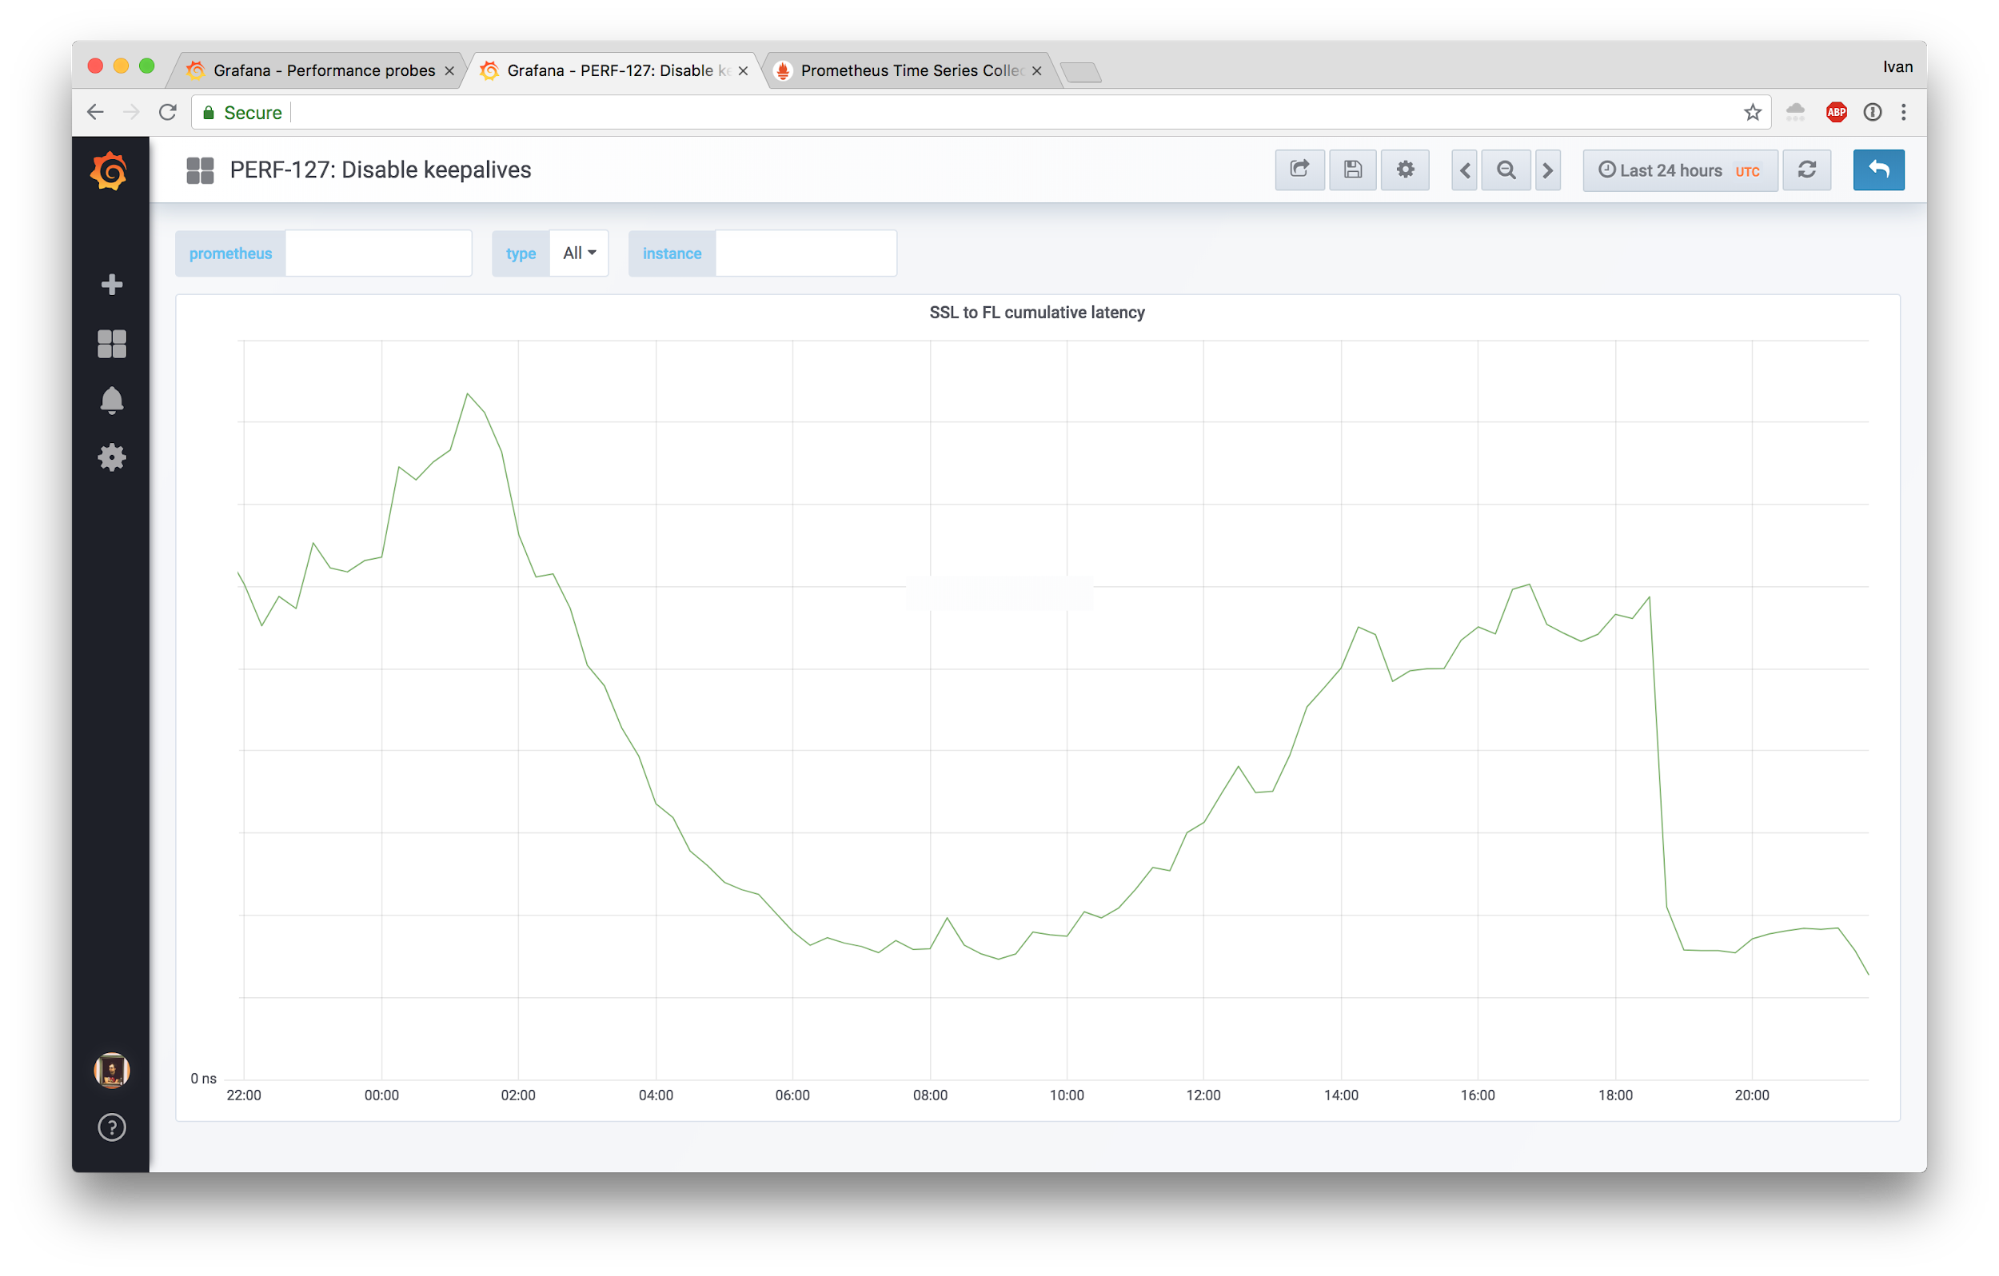
And finally 99.9th percentile of the same measurement:

This is a huge win.
Another telling graph is comparing our average “edge processing time” (which includes WAF) in a test location to a global value:
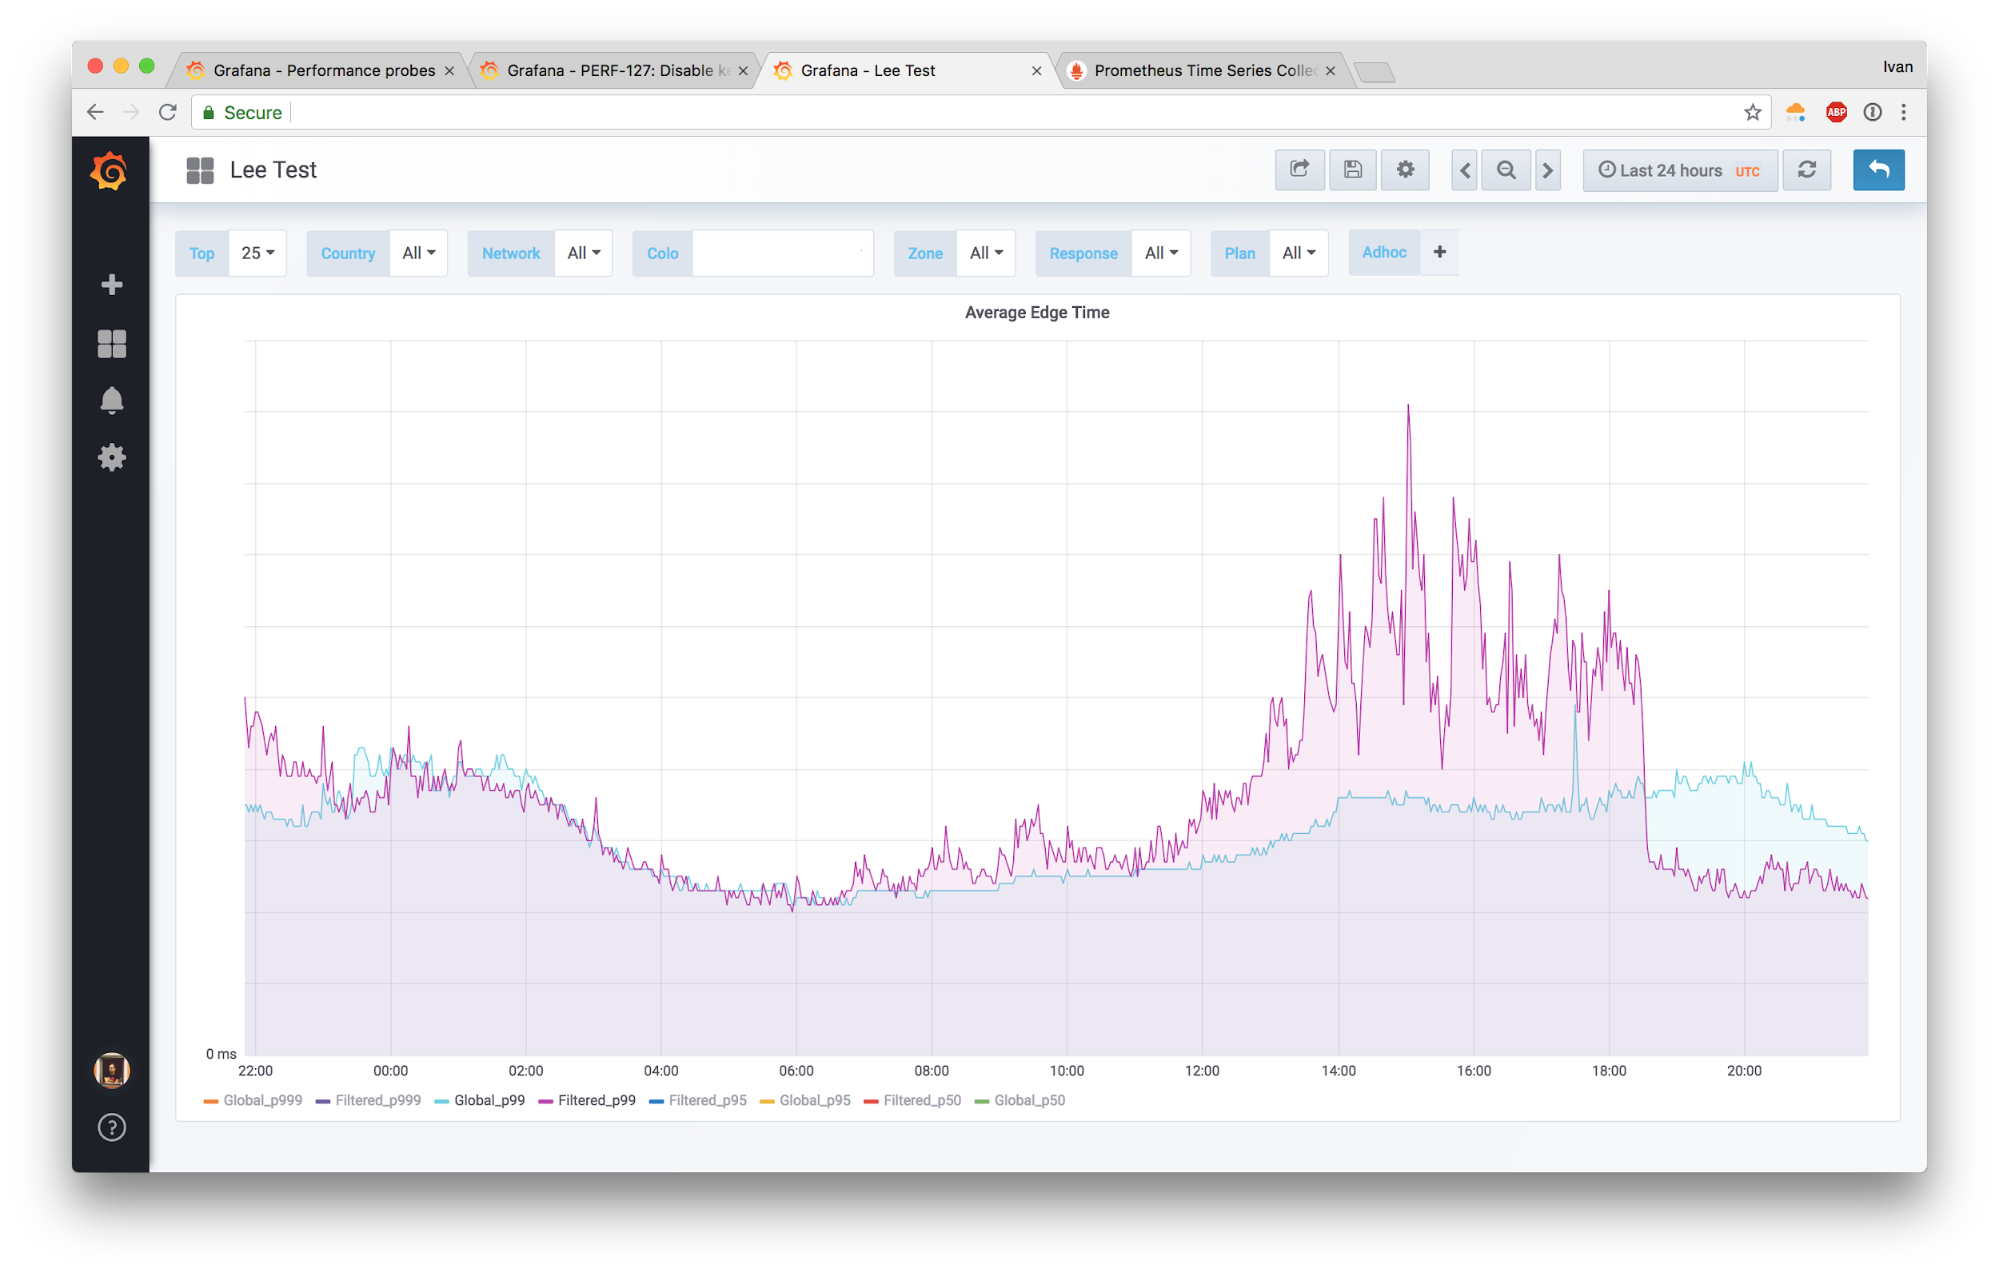
We reduced unnecessary wait time due to an imbalance without increasing the CPU load, which directly translates into improved user experience and lower resource consumption for us.
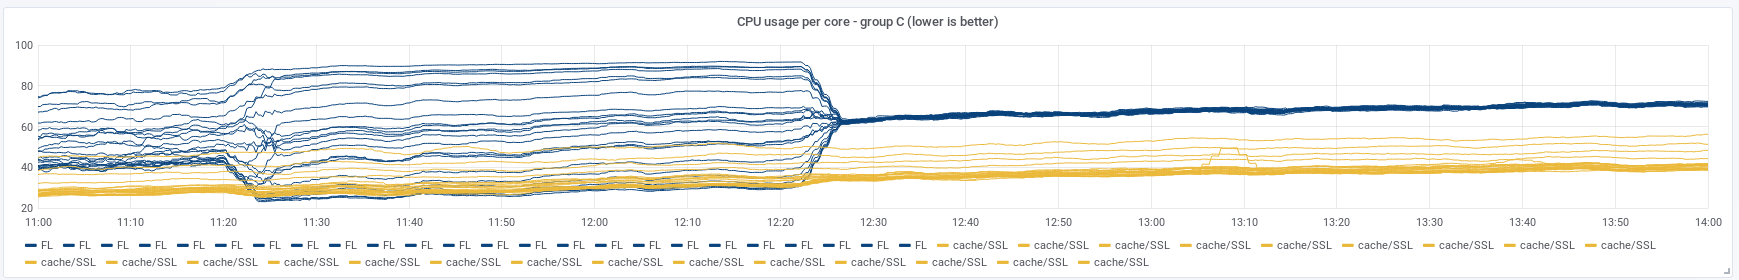
The downsides
There has to be a downside from this, right? The problem we introduced is that CPU imbalance between individual CPU cores went up:
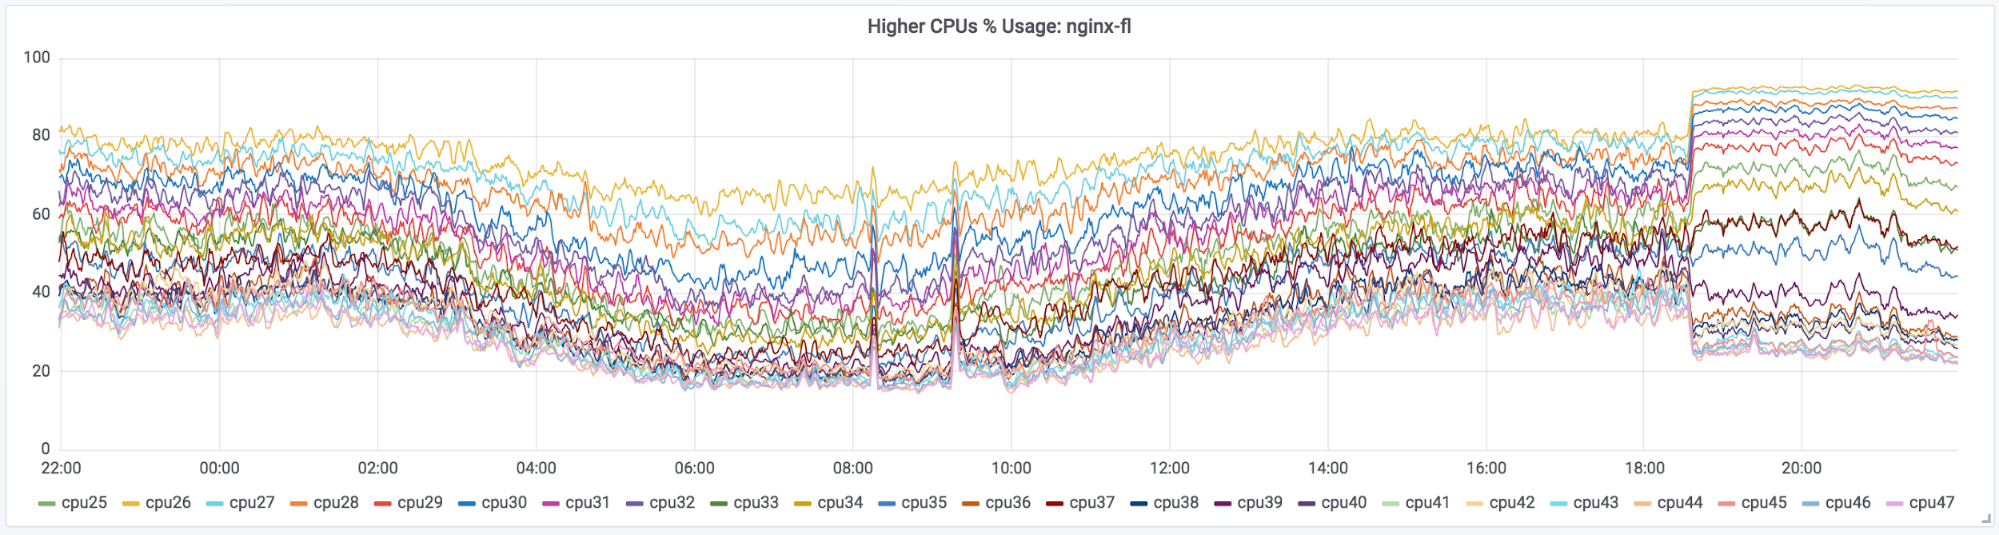
Overall CPU usage did not change, just the distribution of it. We already know of a way of dealing with this: SO_REUSEPORT. Either that or EPOLLROUNDROBIN, which doesn’t have some of the drawbacks of SO_REUSEPORT (which does not work for a Unix socket, for example), but requires a patched kernel. If we combine both disabled keepalives and EPOLLROUNDROBIN changes, we can see CPUs allocated to FL converge in their utilization nicely:
We’ve tried different combinations and having both EPOLLROUNDROBIN with disabled keepalives worked best. Having just one of them is not as beneficial to lower latency.
Conclusions
We disabled keepalives between SSL and FL running on the same box and this greatly improved our tail latency caused by requests landing on non-optimal FL workers. This was an unexpected fix, but it worked and we are able to explain it.
This doesn’t mean that you should go and disable keepalives everywhere. Generally keepalives are great and should stay enabled, but in our case the latency of local connection establishment is much lower than the delay we can get from landing on a busy worker.
In reality this means that we can run our machines hotter and not see latency rise as much as it did before. Imagine moving the CPU cap from 50% to 80% with no effect on latency. The numbers are arbitrary, but the idea holds. Running hotter allows for fewer machines able to serve the same amount of traffic, reducing our overall footprint. ?