


Today, we are thrilled to announce new Cloudflare Zero Trust dashboards on Elastic. Shared customers using Elastic can now use these pre-built dashboards to store, search, and analyze their Zero Trust logs.
When organizations look to adopt a Zero Trust architecture, there are many components to get right. If products are configured incorrectly, used maliciously, or security is somehow breached during the process, it can open your organization to underlying security risks without the ability to get insight from your data quickly and efficiently.
As a Cloudflare technology partner, Elastic helps Cloudflare customers find what they need faster, while keeping applications running smoothly and protecting against cyber threats. “I'm pleased to share our collaboration with Cloudflare, making it even easier to deploy log and analytics dashboards. This partnership combines Elastic's open approach with Cloudflare's practical solutions, offering straightforward tools for enterprise search, observability, and security deployment,” explained Mark Dodds, Chief Revenue Officer at Elastic.
Value of Zero Trust logs in Elastic
With this joint solution, we’ve made it easy for customers to seamlessly forward their Zero Trust logs to Elastic via Logpush jobs. This can be achieved directly via a Restful API or through an intermediary storage solution like AWS S3 or Google Cloud. Additionally, Cloudflare's integration with Elastic has undergone improvements to encompass all categories of Zero Trust logs generated by Cloudflare.
Here are detailed some highlights of what the integration offers:
- Comprehensive Visibility: Integrating Cloudflare Logpush into Elastic provides organizations with a real-time, comprehensive view of events related to Zero Trust. This enables a detailed understanding of who is accessing resources and applications, from where, and at what times. Enhanced visibility helps detect anomalous behavior and potential security threats more effectively, allowing for early response and mitigation.
- Field Normalization: By unifying data from Zero Trust logs in Elastic, it's possible to apply consistent field normalization not only for Zero Trust logs but also for other sources. This simplifies the process of search and analysis, as data is presented in a uniform format. Normalization also facilitates the creation of alerts and the identification of patterns of malicious or unusual activity.
- Efficient Search and Analysis: Elastic provides powerful data search and analysis capabilities. Having Zero Trust logs in Elastic enables quick and precise searching for specific information. This is crucial for investigating security incidents, understanding workflows, and making informed decisions.
- Correlation and Threat Detection: By combining Zero Trust data with other security events and data, Elastic enables deeper and more effective correlation. This is essential for detecting threats that might go unnoticed when analyzing each data source separately. Correlation aids in pattern identification and the detection of sophisticated attacks.
- Prebuilt Dashboards: The integration provides out-of-the-box dashboards offering a quick start to visualizing key metrics and patterns. These dashboards help security teams visualize the security landscape in a clear and concise manner. The integration not only provides the advantage of prebuilt dashboards designed for Zero Trust datasets but also empowers users to curate their own visualizations.
What’s new on the dashboards
One of the main assets of the integration is the out-of-the-box dashboards tailored specifically for each type of Zero Trust log. Let's explore some of these dashboards in more detail to find out how they can help us in terms of visibility.
Gateway HTTP
This dashboard focuses on HTTP traffic and allows for monitoring and analyzing HTTP requests passing through Cloudflare's Secure Web Gateway.
Here, patterns of traffic can be identified, potential threats detected, and a better understanding gained of how resources are being used within the network.
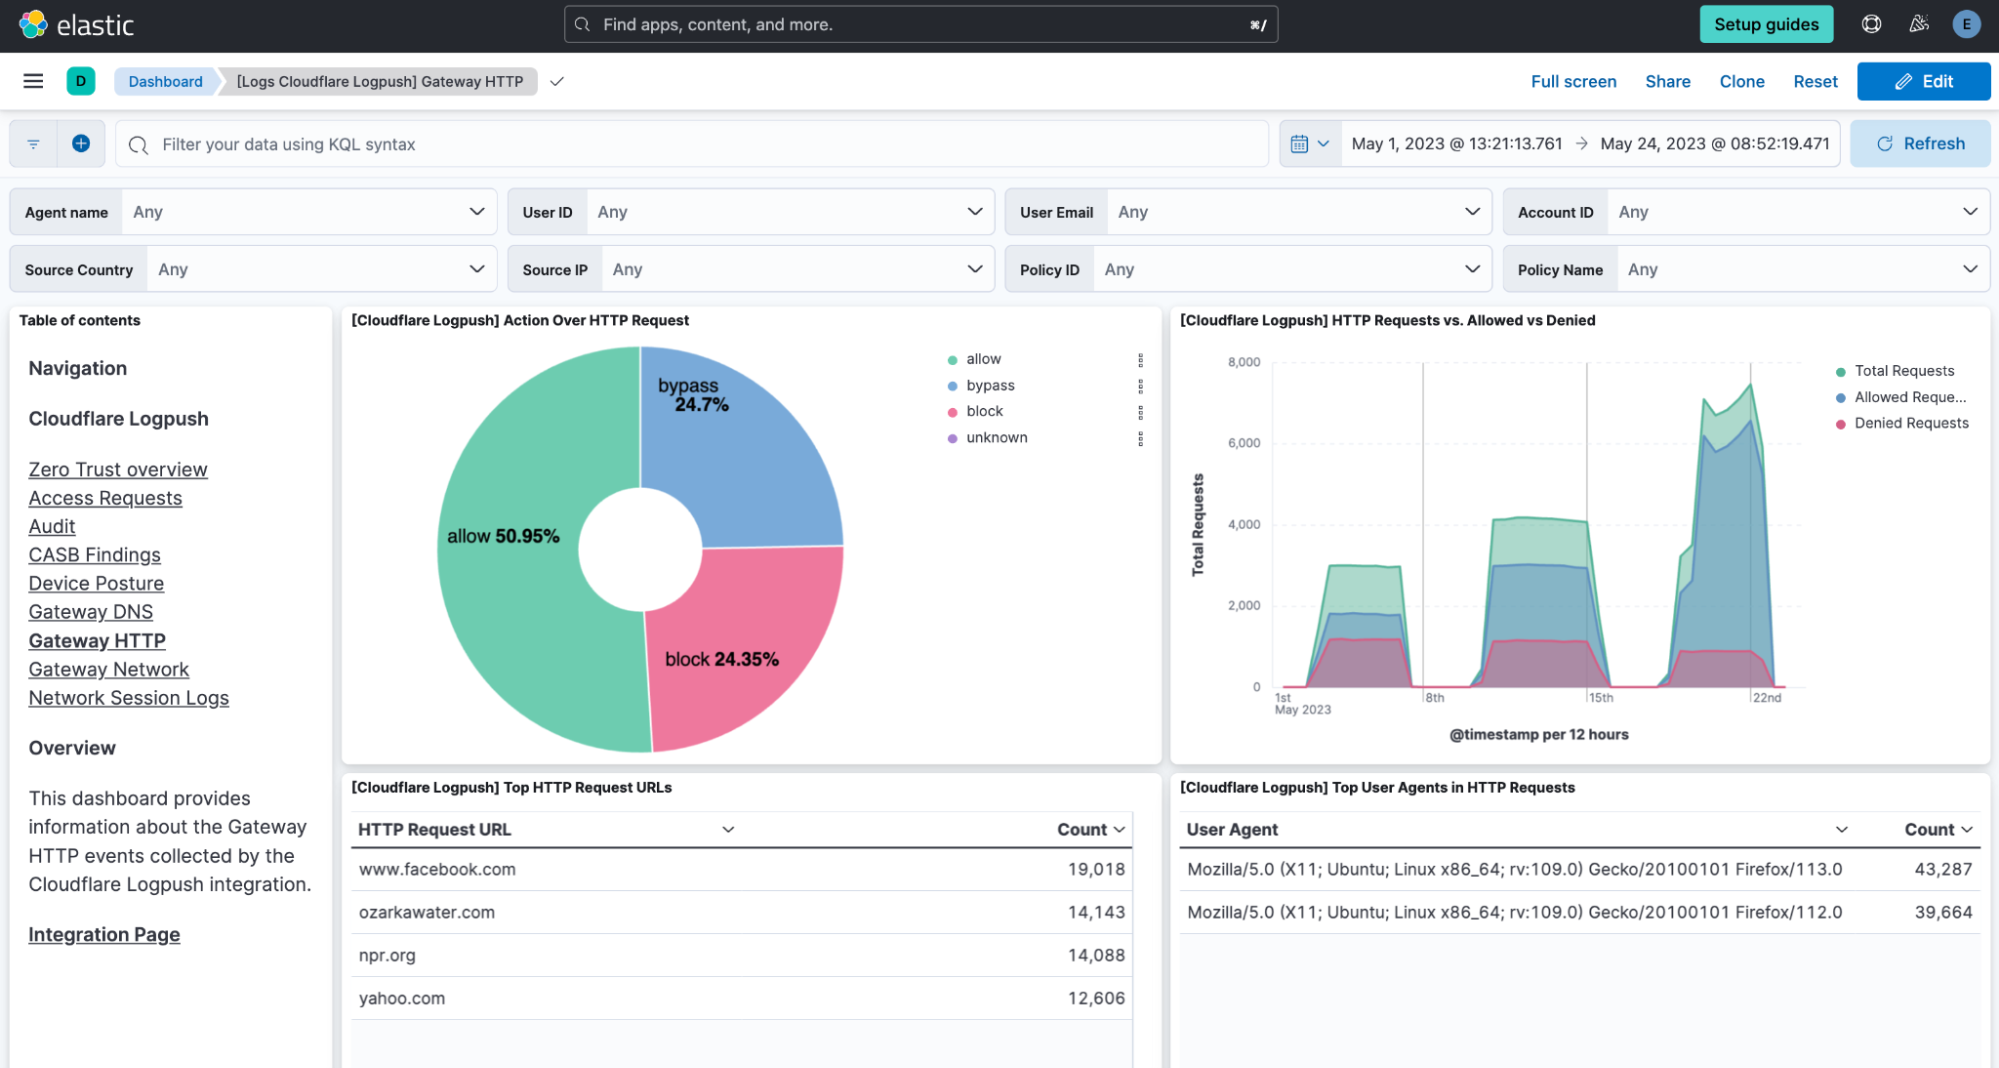
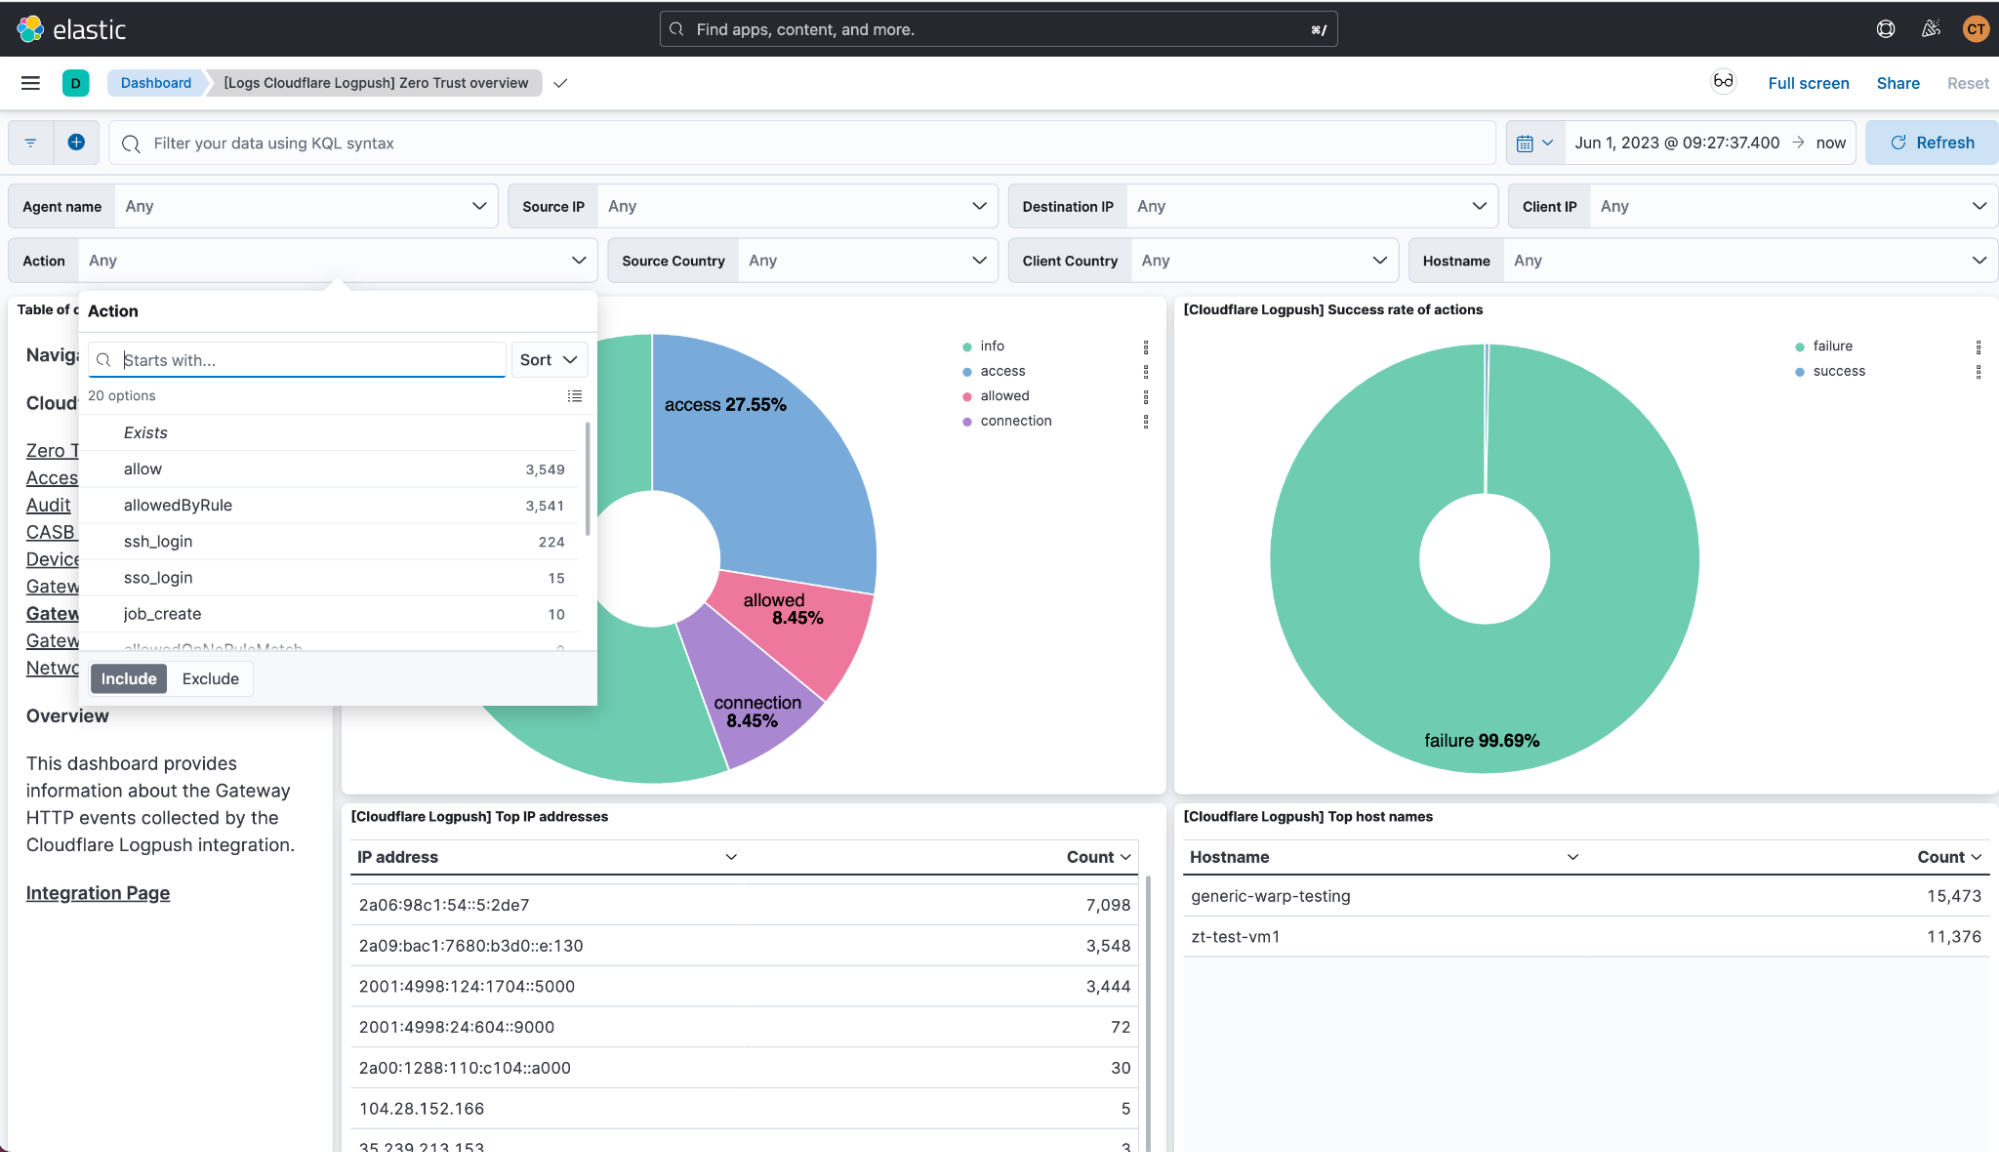
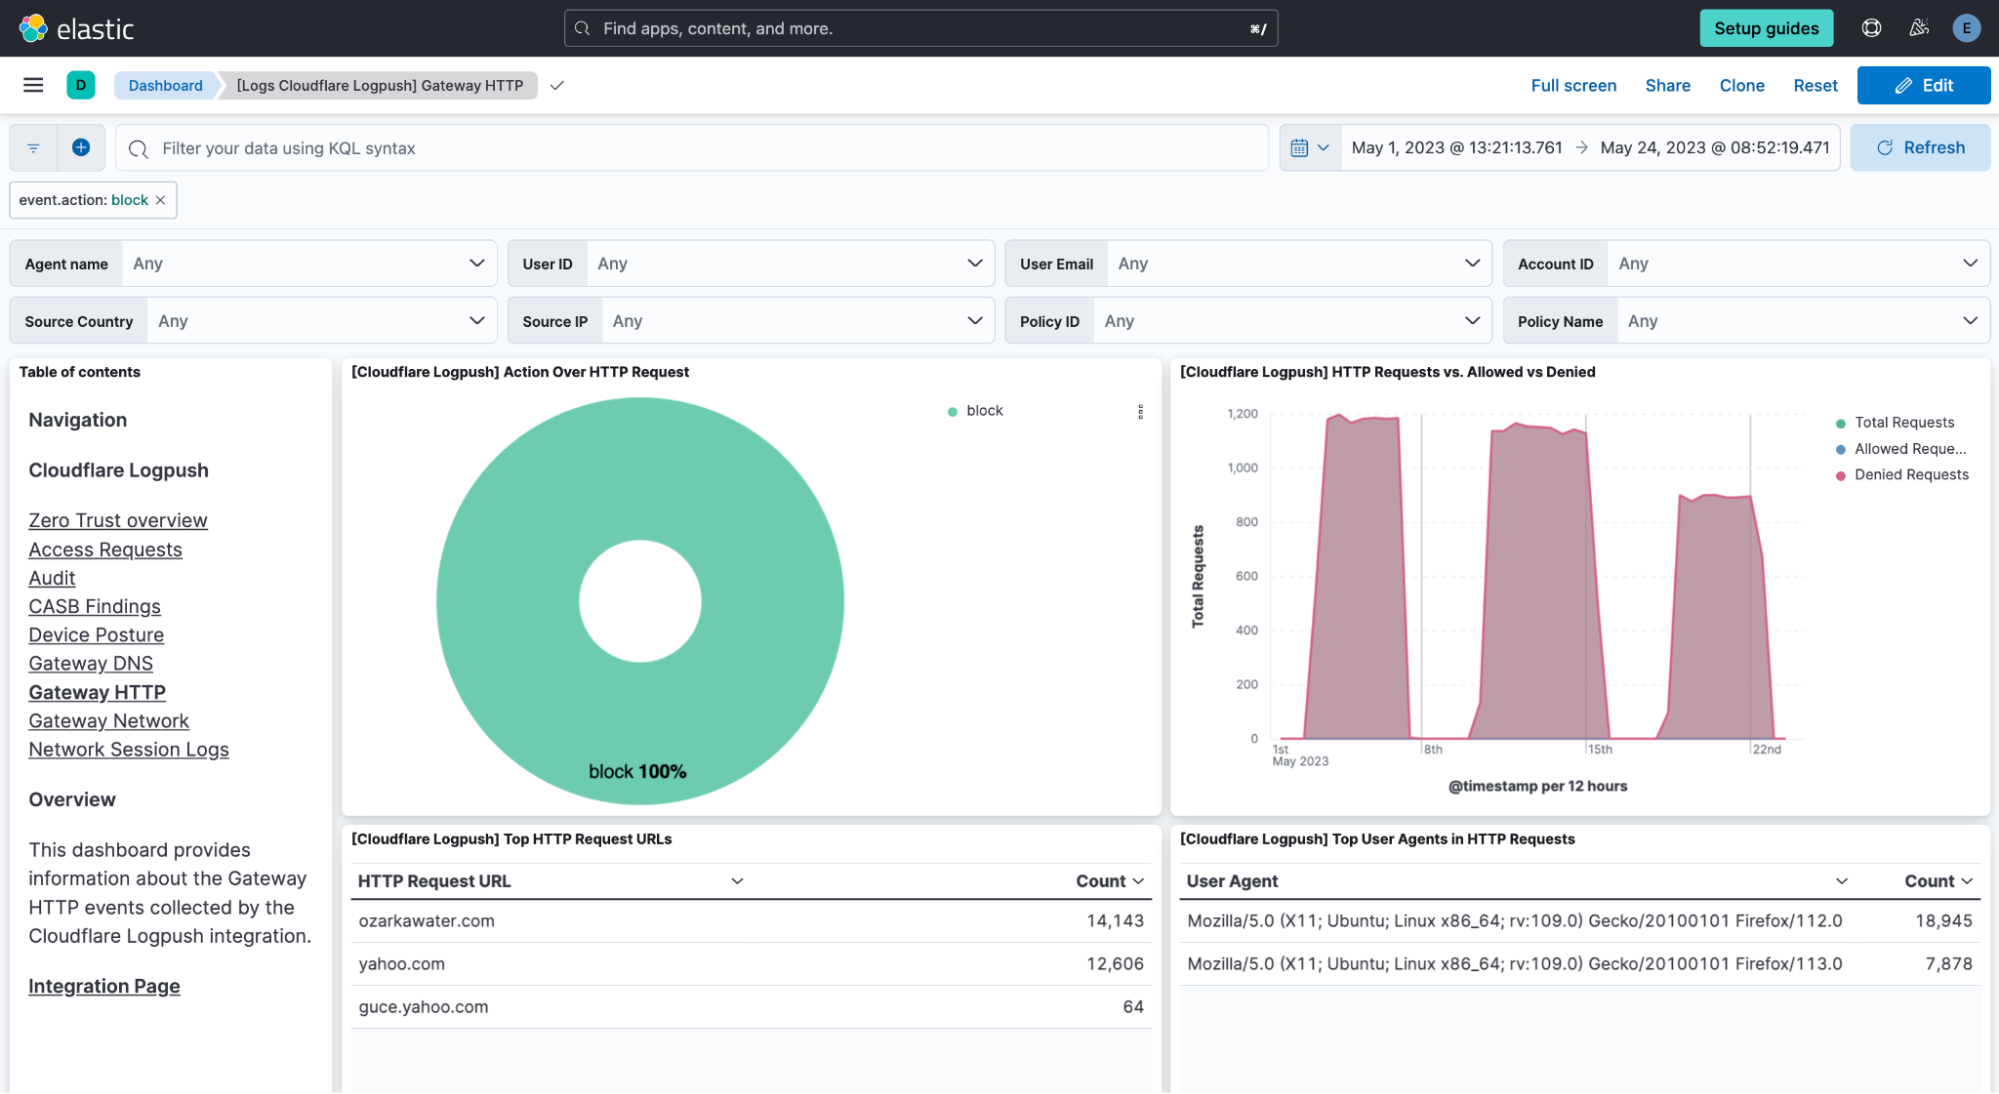
Every visualization in the stage is interactive. Therefore, the whole dashboard adapts to enabled filters, and they can be pinned across dashboards for pivoting. For instance, if clicking on one of the sections of the donut showing the different actions, a filter is automatically applied on that value and the whole dashboard is oriented around it.
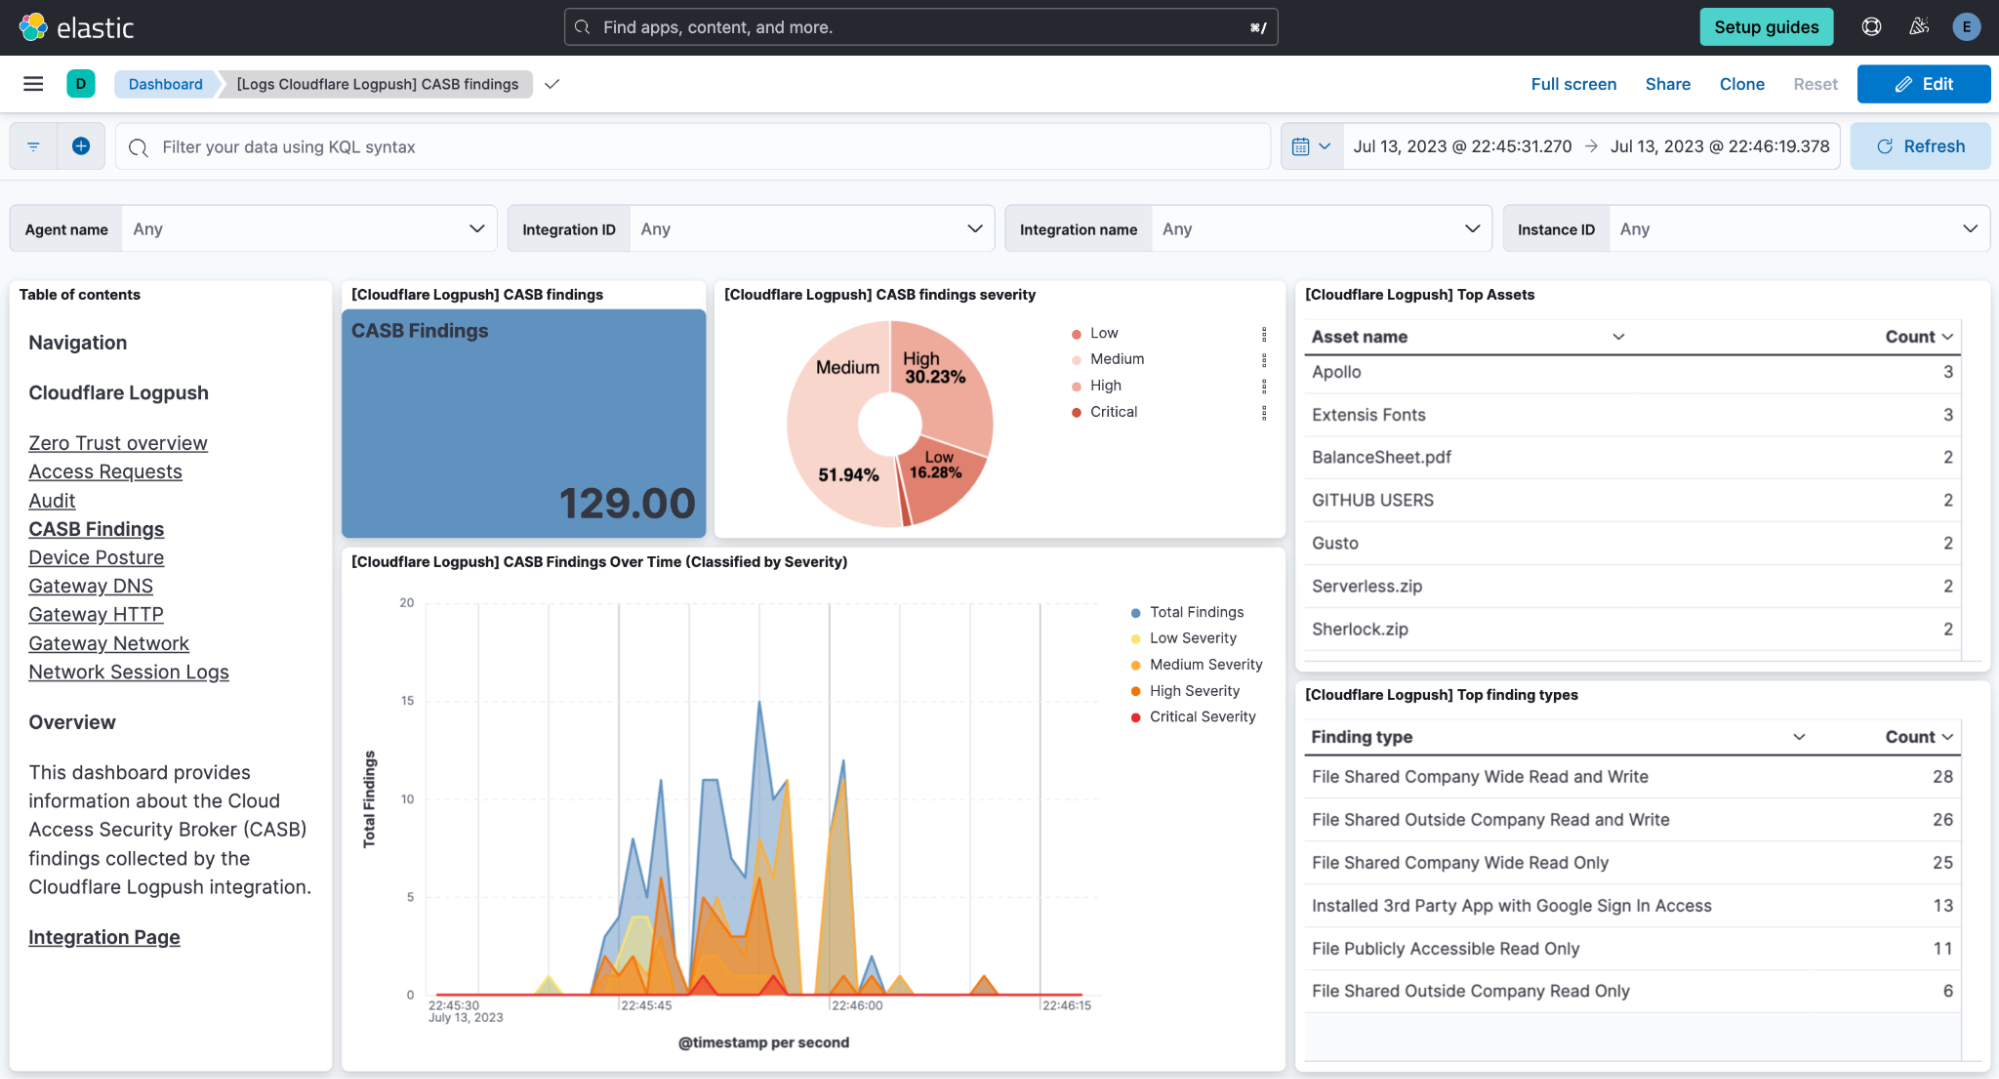
CASB
Following with a different perspective, the CASB (Cloud Access Security Broker) dashboard provides visibility over cloud applications used by users. Its visualizations are targeted to detect threats effectively, helping in the risk management and regulatory compliance.
These examples illustrate how dashboards in the integration between Cloudflare and Elastic offer practical and effective data visualization for Zero Trust. They enable us to make data-driven decisions, identify behavioral patterns, and proactively respond to threats. By providing relevant information in a visual and accessible manner, these dashboards strengthen security posture and allow for more efficient risk management in the Zero Trust environment.
How to get started
Setup and deployment is simple. Use the Cloudflare dashboard or API to create Logpush jobs with all fields enabled for each dataset you’d like to ingest on Elastic. There are eight account-scoped datasets available to use today (Access Requests, Audit logs, CASB findings, Gateway logs including DNS, Network, HTTP; Zero Trust Session Logs) that can be ingested into Elastic.
Setup Logpush jobs to your Elastic destination via one of the following methods:
- HTTP Endpoint mode - Cloudflare pushes logs directly to an HTTP endpoint hosted by your Elastic Agent.
- AWS S3 polling mode - Cloudflare writes data to S3 and Elastic Agent polls the S3 bucket by listing its contents and reading new files.
- AWS S3 SQS mode - Cloudflare writes data to S3, S3 pushes a new object notification to SQS, Elastic Agent receives the notification from SQS, and then reads the S3 object. Multiple Agents can be used in this mode.
Enabling the integration in Elastic
- In Kibana, go to Management > Integrations
- In the integrations search bar type Cloudflare Logpush.
- Click the Cloudflare Logpush integration from the search results.
- Click the Add Cloudflare Logpush button to add Cloudflare Logpush integration.
- Enable the Integration with the HTTP Endpoint, AWS S3 input or GCS input.
- Under the AWS S3 input, there are two types of inputs: using AWS S3 Bucket or using SQS.
- Configure Cloudflare to send logs to the Elastic Agent.
What’s next
As organizations increasingly adopt a Zero Trust architecture, understanding your organization’s security posture is paramount. The dashboards help with necessary tools to build a robust security strategy, centered around visibility, early detection, and effective threat response. By unifying data, normalizing fields, facilitating search, and enabling the creation of custom dashboards, this integration becomes a valuable asset for any cybersecurity team aiming to strengthen their security posture.
We’re looking forward to continuing to connect Cloudflare customers with our community of technology partners, to help in the adoption of a Zero Trust architecture.
Explore this new integration today.