We use ClickHouse widely at Cloudflare. It helps us with our internal analytics workload, bot management, customer dashboards, and many other systems. For instance, before Bot Management can analyze and classify our traffic, we need to collect logs. The Firewall Analytics tool needs to store and query data somewhere too. The same goes for our new Cloudflare Radar project. We are using ClickHouse for this purpose. It is a big database that can store huge amounts of data and return it on demand. This is not the first time we have talked about ClickHouse, there is a dedicated blogpost on how we introduced ClickHouse for HTTP analytics.
Our biggest cluster has more than 100 nodes, another one about half that number. Besides that, we have over 20 clusters that have at least three nodes and the replication factor of three. Our current insertion rate is about 90M rows per second.
We use the standard approach in ClickHouse schema design. At the top level we have clusters, which hold shards, a group of nodes, and a node is a physical machine. You can find technical characteristics of the nodes here. Stored data is replicated between clusters. Different shards hold different parts of the data, but inside of each shard replicas are equal.
Schema of one cluster:

Capacity planning
As engineers, we periodically face the question of how many additional nodes we have to order to support the growing demand for the next X months, with disk space as our prime concern.
ClickHouse stores extensive information in system tables about the operating processes, which is helpful. From the early days of using ClickHouse we added clickhouse_exporter as part of our monitoring stack. One of the metrics we are interested in is exposed from the system.parts table. Roughly speaking, clickhouse_exporter runs SQL queries asking how many bytes are used by each table. After that, these metrics are sent from Prometheus to Thanos and stored for at least a year.
Every time we wanted to make a forecast of disk usage we queried Thanos for historical data using this expression:
sum by (table) (clickhouse_table_parts_bytes{cluster="{cluster}"})
After that, we uploaded data in dataframes to a Jupyter notebook.
There were a few problems with this approach. Only a few people knew where the notebooks were and how to get them running. It wasn't trivial to download historical data. And most importantly, it was hard to look at past predictions and assess whether or not they were correct since results were not stored anywhere except internal blog posts. Also, as the number and size of clusters and products grew it became impossible for a single team to work on capacity planning and we needed to get engineers building products involved as they have the most context on how the growth will change in the future.
We wanted to automate this process and made calculations more transparent for our colleagues, including those who use ClickHouse for their services. Honestly, at the beginning we weren’t sure if it was even possible and what we would get out of it.
Finding the right metrics
The crucial moment of adding new nodes for us is a disk space, so this was a place to start. We decided to use system.parts, as we used it before with the manual approach.
Luckily, we started doing it for the cluster that had recently changed its topology. That cluster had two shards with four and five nodes in every shard. After the topology change, it was replaced with three shards and three nodes in every shard, but the number of machines and unreplicated data on the disks remained the same. However, it had an impact on our metrics: we previously had four replicated nodes in one shard and five replicated in another, we took one node off from the first shard and two nodes from the second and created a new one based on these three nodes. The new shard was empty, so we just added it, but the total amount of data in the first and the second shards was less as the count of the remaining nodes.
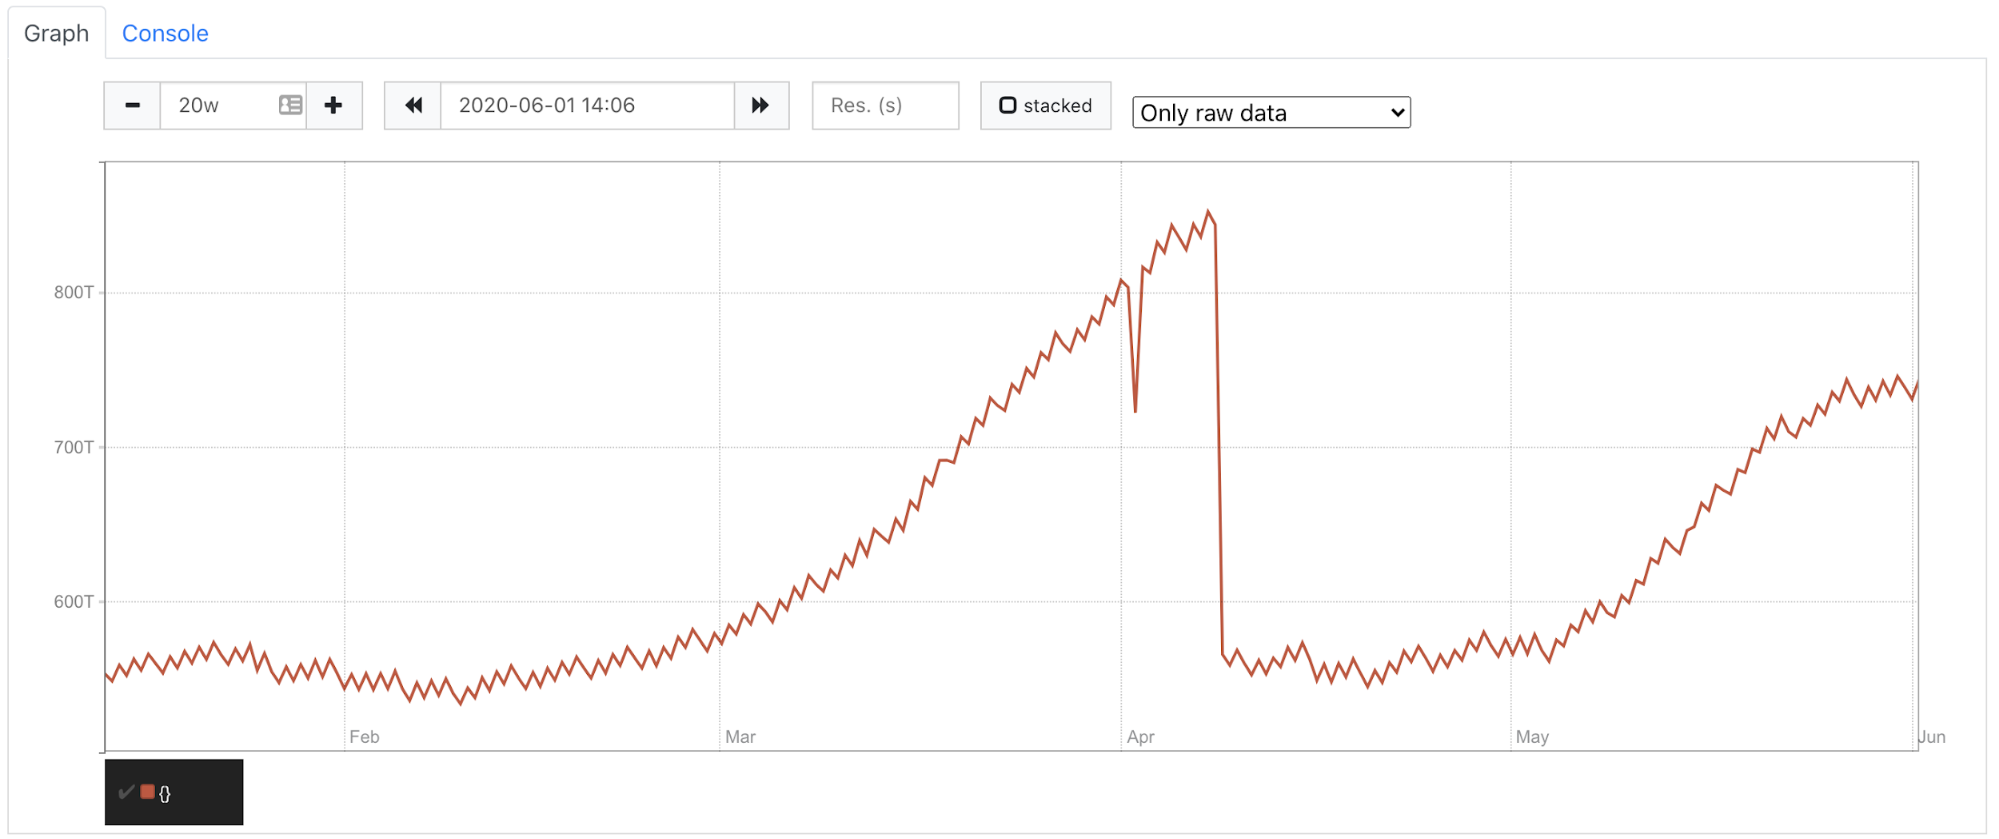
You can see on the graph below in April we had this sharp decrease caused by topology changes. We got ~550T instead of ~850T among all shards and replicas.

When we tried to train our model based on the real data due to the April drop it thought we had a downward trend. Which was incorrect as we only dropped replicated data. The trend for unreplicated data hadn’t changed. So we decided to take into account only unreplicated data. It saved us from the topology change and node replacement in case of problems with hardware.
The rule that we use for metrics now is:
sum by(cluster) (
max by (cluster, shardgroup) (
node_clickhouse_shardgroupinfo{} *
on (instance) group_right (cluster, shardgroup) sum(table_parts_bytes{cluster="%s"}) by (instance)
))
We continue using system.parts from clickhouse_exporter, but instead of counting the whole amount of data we use the maximum of unreplicated data from every shard.
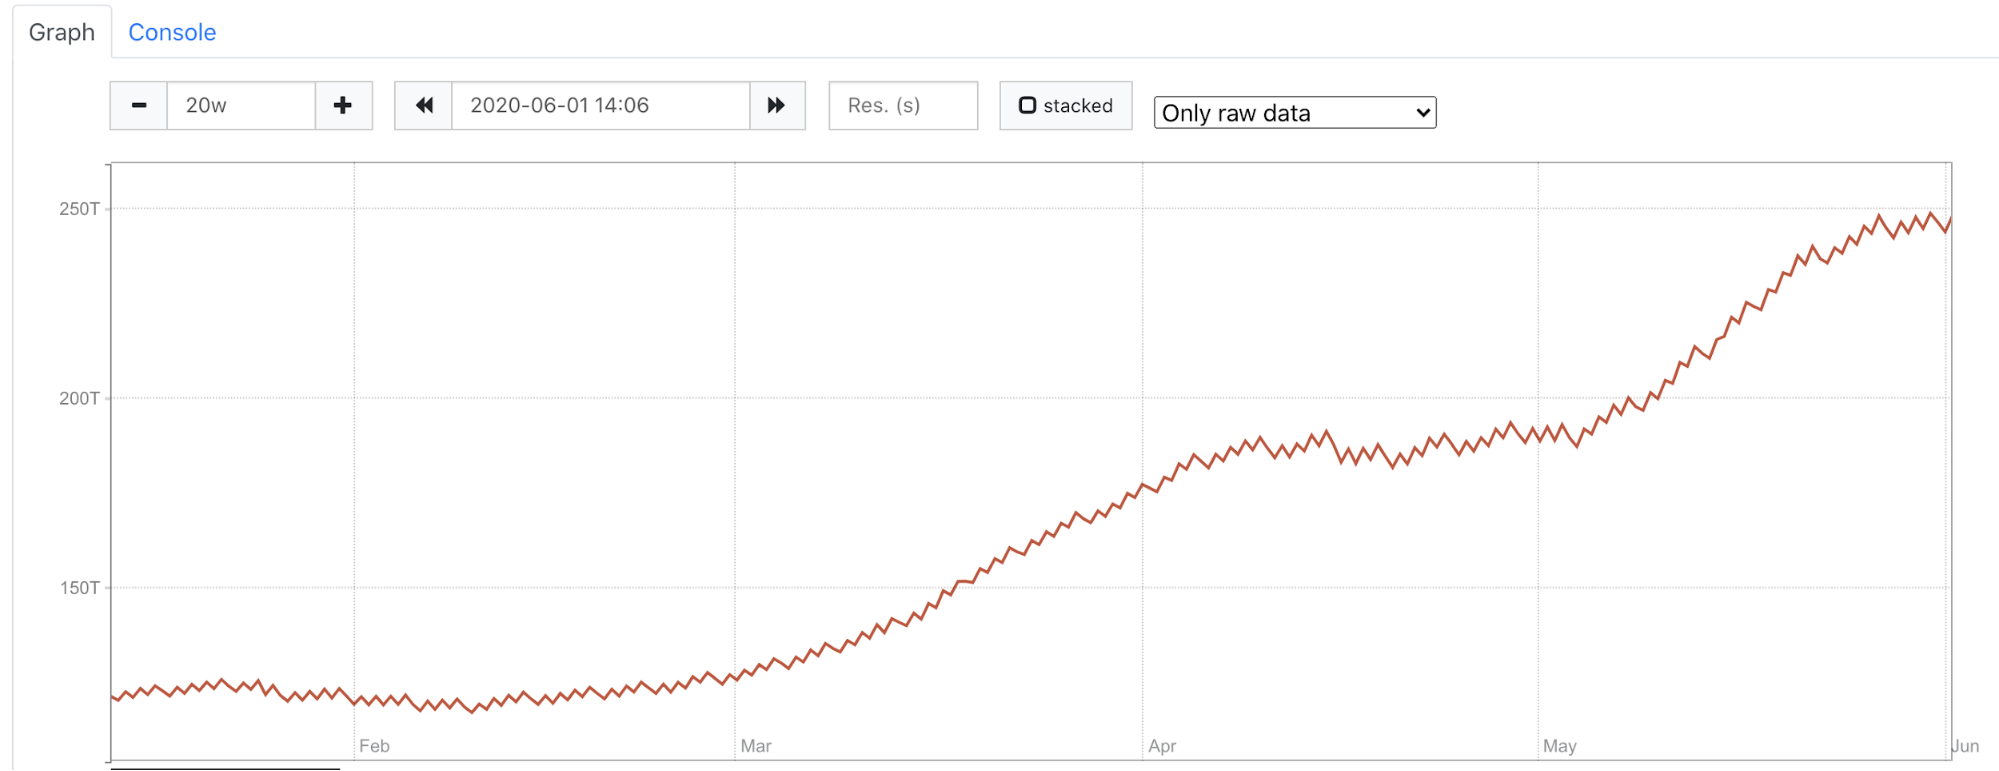
In the image below there is the same cluster as in the image above but instead of counting the whole amount of data we look at unreplicated data from all shards. You can clearly see that we continued to grow and didn’t have any drop in data.

Another problem we faced was that we migrated some tables from one cluster to another because we were running out of space and it required immediate action. However, our model didn’t know that part of the tables didn’t live there anymore, and we didn’t want them to be a part of the prediction. To solve this problem we queried Prometheus to get the list of the tables that existed at the prediction time, then filtered historical data to include only these tables and used them as the input for training a model.
Load of metrics
After determining the correct metrics, we needed to obtain them for our forecasting procedure. Our long-term metrics solution, Thanos, stores billions of data points. Querying it for a cluster with over one hundred nodes even for one day takes a huge amount of time, and we needed these data points for a year.
As we planned to use Python we wrote a small client using aiohttp that concurrently sends HTTP requests to Thanos. The requests are sent in chunks, and every request has start/end dates with a difference of one hour. We needed to get the data for the whole year once and then append new ones day by day. We got csv files: one file for one cluster. The client became a part of the project, and it runs once a day, queries Thanos for new metrics (previous day) and appends data to the files.
Forecasting procedure
At this point, we have collected metrics in files, now it’s time to make a forecast. We needed something for time-series metrics, so we chose Prophet from Facebook. It’s very simple to use, you can follow the documentation and get good results even with the default parameters.
One challenge we faced using Prophet was the need to feed it one data point for a day. In the metric files we have thousands of those for every day. It looks logical to take the point at the end of every day, but it’s not really true. All tables have a retention period, the time for how long we store data in ClickHouse. We don’t know when the data is cleared, it happens gradually throughout the day. So, we decided to take the maximum number for a day.
Drawing Graphs
We chose Grafana to present results, though we needed to store predicted data points somewhere. The first thought was to use Prometheus, but because of high cardinality, we had about 300,000 points in summary for clusters and tables, so we passed. We decided to use ClickHouse itself. We wanted to have both graphs, real and predicted, on the same dashboard. We had real data points in Prometheus and with mixed data source could do this. However, the problem was the same as the loading of metrics into files, for some clusters it’s impossible to obtain metrics for a long period of time. We added functionality to upload real metrics in ClickHouse as well, now both real and predicted metrics are displayed in Grafana, taken from ClickHouse.
Summary
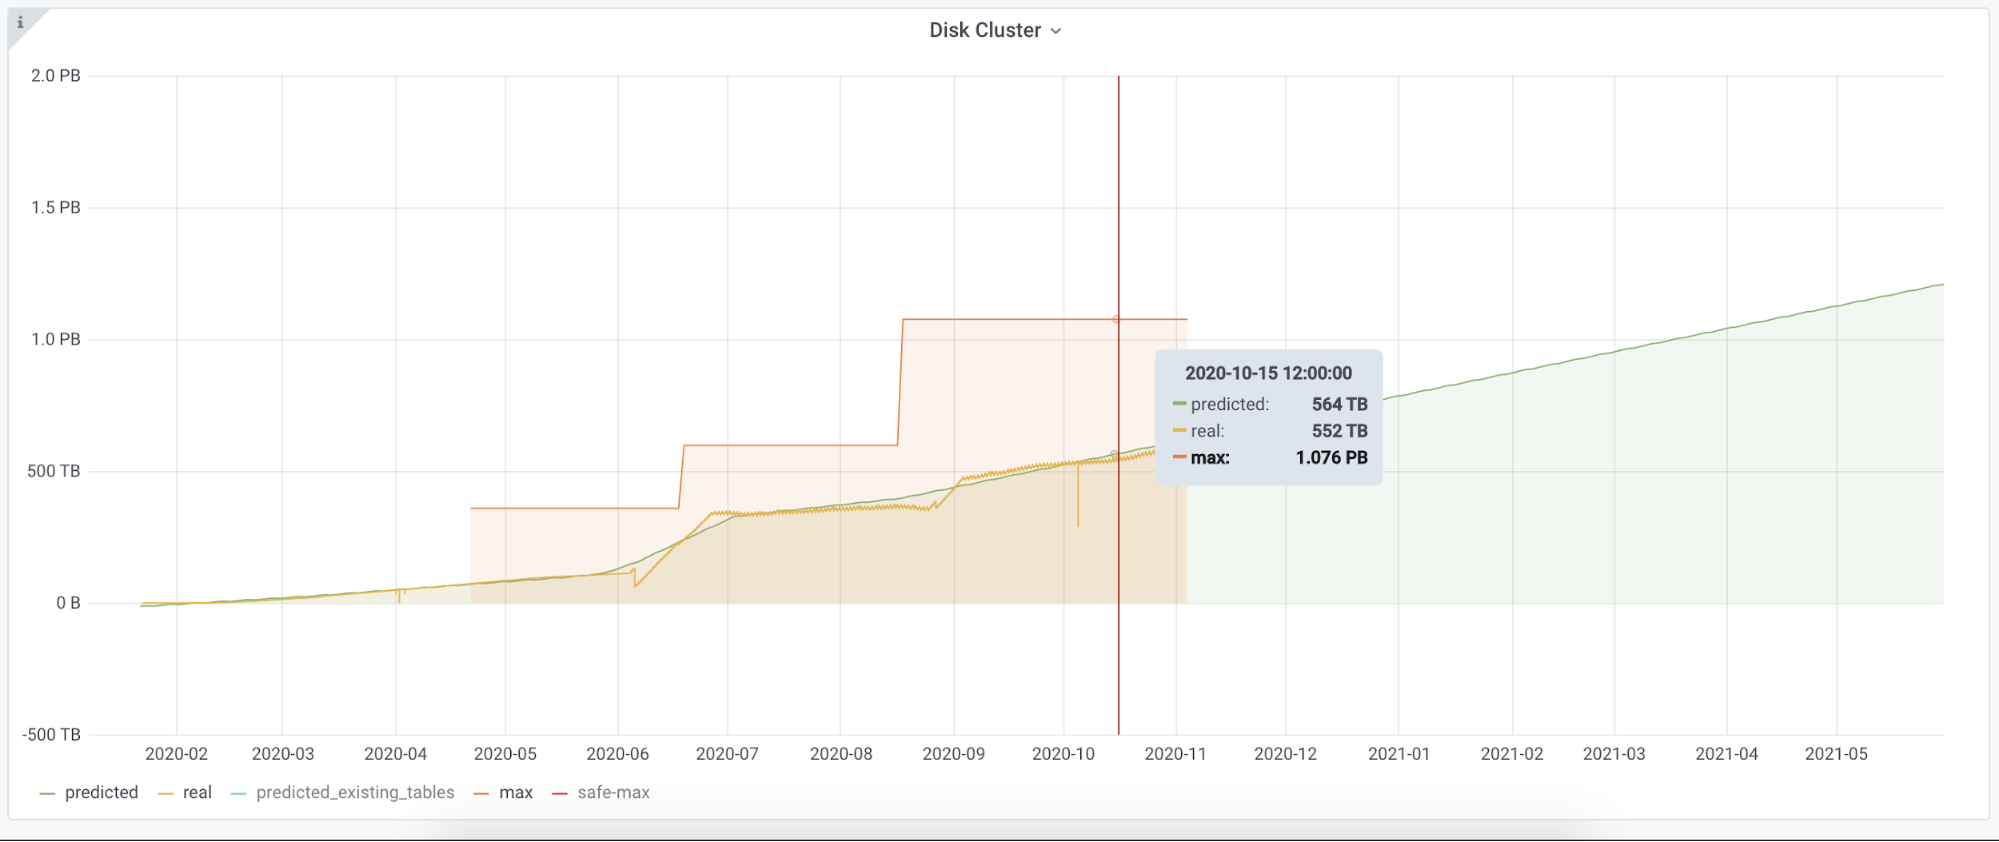
This is what we have in Grafana:
- The yellow line shows the real data;
- The green line was created based on Prophet output;
- The red line - the maximum disk capacity. We already increased it twice.

We have a service running in Kubernetes that does all the toil, and we created an environment for other metrics. We have the place where we collect metrics from Thanos and expose them in the required format to Grafana. If we find the right metrics for accounting other resources like IO, CPU or other systems like Kafka we can easily add them to our framework. We can easily replace Prophet with another algorithm, and we can go back months and evaluate how close we were in our prediction according to the real data.
With this automation we were able to spot we were going out of disk space for a couple of clusters which we didn’t expect. We have over 20 clusters and have updates for all of them every day. This dashboard is used not only by our colleagues who are direct customers of ClickHouse but by the team who makes a plan for buying servers. It is easy to read and costs none of developers time.
This project was carried out by the Core SRE team to improve our daily work. If you are interested in this project, check out our job openings.
We didn’t know what we would get at the end, we discussed, looked for solutions and tried different approaches. Huge thanks for this to Nicolae Vartolomei, Alex Semiglazov and John Skopis.

